MD thesis
Improving the detection of abnormal visual
function in glaucoma using High Spatial
Resolution Perimetry and Motion
Displacement Threshold testing
Mark Westcott FRCOphth,
1999
Supervisors
Professor F W Fitzke PhD
Professor R A Hitchings FRCS FRCOphth.
Institutions:
Institute of Ophthalmology, Bath Street London ECl.
Moorfields Eye Hospital; City Road, London ECl
P.
ProQuest Number: U122170
All rights reserved
INFORMATION TO ALL USERS
The quality of this reproduction is dependent upon the quality of the copy submitted.
In the unlikely event that the author did not send a complete manuscript and there are missing pages, these will be noted. Also, if material had to be removed,
a note will indicate the deletion.
uest.
ProQuest U122170
Published by ProQuest LLC(2015). Copyright of the Dissertation is held by the Author.
All rights reserved.
This work is protected against unauthorized copying under Title 17, United States Code. Microform Edition © ProQuest LLC.
ProQuest LLC
789 East Eisenhower Parkway P.O. Box 1346
1. Abstract
Primary open angle glaucoma is a major cause o f blindness and visual disability. The introduction to this thesis summarises evidence that automated perimetry is not sensitive enough to detect early glaucomatous damage. This thesis investigates two novel tests o f visual function which are Motion Displacement Threshold (MDT) testing and High Spatial Resolution Perimetry (HSRP).
In chapter 4, motion reaction times are shown to be abnormally elevated in glaucoma patients as a function o f threshold elevation. Their potential use as a marker for reliability is outlined. Chapter 5 reports that analysis o f the slope o f the ffequency-of-seeing curve improves the sensitivity o f the MDT test compared with analysis o f the threshold alone. Chapter 6 describes the technique o f High Spatial Resolution Perimetry (HSRP) and investigates its spatial resolution, repeatability and clinical use in glaucoma.
Chapter 7, elevated Motion Displacement Thresholds (MDTs) are identified in glaucoma. These are shown to coexist in some cases with fine scale scotomas identified using HSRP. This suggests that an underlying factor contributing to MDT abnormalities in addition to selective magnocellular loss or reduced redundancy is sensitivity loss on a spatial scale too small to be measured by conventional perimetry. This led to the hypothesis that the orientation o f the MDT stimulus could have a significant effect on motion threshold glaucoma, and that stimulus orientation might be incorporated in order to improve the sensitivity o f the test. This hypothesis was tested in chapter 8, which identified increasing elevation o f motion threshold for a line stimulus moving perpendicular to the retinal nerve fibre layer compared to a line stimulus moving parallel to the retinal nerve fibre layer in some glaucoma patients.
2. Table of contents
1. Abstract
2. Table o f contents_________________________________________________________ 3
3. List o f figures____________________________________________________________ 8
4. Acknowledgements_______________________________________________________11
5. Outline o f thesis________________________________________________________ 12
1. CHAPTER 1 Glaucoma__________________________________________________13
1.1 Definition_______________________________________________________________ 13
1.2 Classification____________________________________________________________ 13
1.2.1 Concepts_______________________________________________________________________ 13
1.2.2 Primary Open Angle Glaucoma (PCAG)_____________________________________________14
1.3 Epidemiology____________________________________________________________ 14
1.3.1 Prevalence______________________________________________________________________ 15
1.3.2 Incidence_______________________________________________________________________ 16
1.3.3 Risk factors_____________________________________________________________________ 16
1.4 Æ tiology_______________________________________________________________ 19
1.4.1 Pathogenesis____________________________________________________________________ 19
1.4.2 Mechanical theories_____________________________________________________________ 20
1.4.3 Vascular theory__________________________________________________________________21
1.4.4 Apoptosis_______________________________________________________________________ 22
1.4.5 Genetic factors___________________________________________________________________23
1.5 Treatment______________________________________________________________ 23
1.6 Summary_______________________________________________________________ 24
2. CHAPTER 2 Visual function in glaucoma_________________________________ 26
2.1 The anatomy of the visual pathway__________________________________________ 26
2.1.1 Introduction_____________________________________________________________________ 26
2.1.2 The retinal ganglion cell__________________________________________________________ 26
2.1.3 Parallel visual pathways__________________________________________________________ 27
2.1.4 Visual function and parallel pathways_______________________________________________28
2.2 Measurement of visual function in glaucoma __________________________________ 30
2.2.2 History of perimetry_____________________________________________________________ 30
2.2.3 Kinetic perimetry________________________________________________________________31
2.2.4 Static perimetry__________________________________________________________________31
2.2.5 Automated perimetry____________________________________________________________ 31
2.2.6 The Humphrey Field Analyzer (H FA)_______________________________________________32
3. CHAPTER 3 Aims o f research: Improving the detection o f abnormal visual
function in glaucoma_______________________________________________________34
3.1 Limitations of conventional automated perimetry in detecting early damage________ 34
3.2 Rationale for using other psychophysical tests_________________________________ 35
3.2.1 Introduction_____________________________________________________________________ 3 5
3.2.2 Selective ganglion cell loss in glaucoma_____________________________________________36
3.2.3 Reduced redundancy_____________________________________________________________ 37
3.3 Motion Perception perimetry in glaucoma____________________________________ 38
3.3.1 Introduction_____________________________________________________________________ 38
3.3.2 Line displacement thresholds______________________________________________________ 38
3.3.3 Random dot kinetograms_________________________________________________________ 40
3.4 Other psychophysical tests_________________________________________________ 42
3.4.1 Short Wavelength Automated perimetry (SWAP)_____________________________________ 42
3.4.2 Flicker perimetry_________________________________________________________________43
3.4.3 High-pass resolution perimetry_____________________________________________________ 43
3.4.4 Frequency doubling perimetry_____________________________________________________ 44
3.5 Aims and plan of research_________________________________________________ 44
3.5.1 Motion sensitivity_______________________________________________________________ 45
3.5.2 High Spatial Resolution Perimetry__________________________________________________ 45
4. CHAPTER 4 Differences in the reaction times fo r motion detection between
normals and glaucoma._____________________________________________________46
4.1 Background_____________________________________________________________ 46
4.2 Purpose________________________________________________________________ 47
4.3 Method_________________________________________________________________ 47
4.3.1 Subjects________________________________________________________________________ 47
4.3.2 Motion Displacement Testing______________________________________________________ 48
4.3.3 Recording of reaction tim e s_______________________________________________________ 48
4.4 Results_________________________________________________________________ 48
4.4.1 Motion thresholds_______________________________________________________________ 48
4.4.3 The relationship between reaction time and stimulus displacement______________________ 49
4.4.4 Are the prolonged reaction times in glaucoma patients accounted for by threshold elevation? 53
4.5 Discussion_____________________________________________________________ 54
5. CHAPTER 5 Characteristics o f Frequency-of-Seeing curves fo r a motion stimulus
in glaucoma eyes, glaucoma suspect eyes, and normal eyes.____________________ 55
5.1 Background_____________________________________________________________ 55
5.2 Purpose________________________________________________________________ 56
5.3 Method_________________________________________________________________ 56
5.3.1 Subjects________________________________________________________________________ 56
5.3.2 Testing strategy__________________________________________________________________57
5.3.3 Analysis________________________________________________________________________ 58
5.4 Results_________________________________________________________________ 61
5 .4.1 Discriminating between the glaucoma eyes and normal eyes using threshold and slope
abnormalities.________________________________________________________________________ 61
5.4.2 The relationship between slope and the 50% seen threshold___________________________ 64
5.5 Discussion______________________________________________________________ 67
6. CHAPTER 6 High spatial resolution automated perimetry in glaucoma________ 69
6.1 Background_____________________________________________________________ 69
6.2 Purpose________________________________________________________________ 69
6.3 Methods________________________________________________________________ 70
6.3.1 Subjects________________________________________________________________________ 70
6.3.2 Technique of fine matrix mapping (FMM) __________________________________________ 70
6.3.3 Examination protocols___________________________________________________________ 71
6.3.4 Statistical analysis________________________________________________________________72
6.4 Results_________________________________________________________________ 73
6.4.1 High Spatial Resolution Perimetry of the blind spot.___________________________________ 73
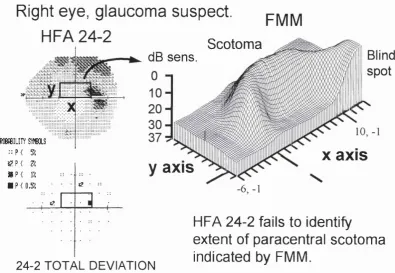
6.4.2 High Spatial Resolution Perimetry in patients with retinal nerve fibre layer defects.________ 75
6.4.3 Clinical evaluation of High Spatial Resolution Perimetry_______________________________ 78
6.5 Discussion______________________________________________________________ 87
7. CHAPTER 7 Abnormal Motion Displacement Thresholds are associated with Fine
Scale Luminance Sensitivity Loss in G laucom a______________________________ 89
7.2 Purpose________________________________________________________________ 90
7.3 Methods________________________________________________________________ 91
7.3.1 Subjects________________________________________________________________________ 91
7.3.2 Motion Displacement Testing______________________________________________________ 92
7.3.3 High Spatial Resolution Perimetry__________________________________________________ 95
7.3.4 Analysis________________________________________________________________________ 96
7.4 Results_________________________________________________________________ 96
7.4.1 Motion Displacement Thresholds (MDTs)___________________________________________ 96
7.4.2 High Spatial Resolution Perimetry Luminance thresholds_______________________________ 97
7.4.3 Comparison between abnormal Motion Displacement Thresholds and abnormal High Spatial
Resolution Perimetry thresholds.________________________________________________________ 98
7.5 Discussion_____________________________________________________________ 104
8. CHAPTER 8 The effect o f stimulus orientation on Motion Displacement
Thresholds in glaucoma,___________________________________________________107
8.1 Background____________________________________________________________ 107
8.2 Purpose_______________________________________________________________ 107
8.3 Methods_______________________________________________________________ 110
8.3.1 Subjects_______________________________________________________________________ 110
8.3.2 Examination protocol___________________________________________________________ 110
8.3.3 Analysis_______________________________________________________________________ 111
8.4 Results________________________________________________________________ 112
8.4.1 Motion Displacement Thresholds__________________________________________________ 112
8.4.2 Effect of stimulus orientation on motion threshold___________________________________ 113
8.5 Discussion__________________________________________ 116
9. CHAPTER 9 Discussion and summary____________________________________118
9.1 High spatial resolution automated perimetry_________________________________ 118
9.1.1 Implications of findings_________________________________________________________ 118
9.1.2 Clinical applications_____________________________________________________________119
9.1.3 Future modifications_____________________________________________________________119
9.2 Motion Displacement threshold testing______________________________________ 120
9.2.1 Reaction times for motion detection________________________________________________ 120
9.2.2 Frequency of seeing analysis for motion detection____________________________________ 122
9.2.3 Association of abnormal Motion Displacement Thresholds with fine scale luminance sensitivity
9.2.4 Stimulus orientation and motion threshold________________________________________ 127
9.3 Summary_____________________________________________________________ 128
10. APPENDIX: Supporting publications____________________________________131
10.1 Peer reviewed published papers___________________________________________ 131
10.2 Papers under review____________________________________________________ 131
3. List of figures
Figure 4.1a Relationship between reaction time and stimulus displacement fo r glaucoma eyes and controls. Reaction times were significantly prolonged in glaucoma eyes fo r displacements 12-18 min. arc.__________________________________________________________________________51 Figure 4. lb Same data as figure 4. la, replotted to show the relationship between reaction time as a
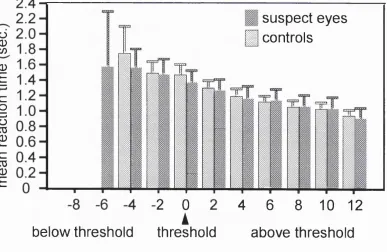
function o f distance in min. arc from threshold. There are now no significant differences between the groups.________________________________________________________________________51 Figure 4.2a Relationship between reaction time and stimulus displacement fo r suspect eyes and
controls, showing a trend ofprolonged reaction times eyes fo r displacements 12-18 min. arc in suspect eyes (not significant).________________________________________________________52 Figure 4.2b Same data as figure 4.2a, replotted to show the relationship between reaction time as a
function o f distance in min. arc from threshold. This abolishes any differences between the two groups.___________________________________________________________________________52 Figure 5.1a Humphrey 24-2 from normal control aged 69 (right), showing site o f motion testing (arrow)
with 4 closest Humphrey test locations. Above is subject’s normal motion frequency-of-seeing curve. Black circles represent raw data points with probit-fitted curve (solid black curve), and 95% C.I. (dashed black curve). Dashed black line indicates 50% seen threshold, with interquartile ranges (dashed gray lines), within mean +2 SD o f control group.___________________________59 Figure 5. lb Humphrey 24-2 o f a glaucoma patient aged 69 with an inferior arcuate scotoma (right).
Arrow indicates site o f motion testing on greyscale plot, with 4 closest Humphrey 24-2 test locations (box) showing normal threshold sensitivity, within 95% population limits on Statpac2 output. Above is motion frequency-of-seeing curve o f same patient, with elevated threshold (11.6 min. arc) and abnormally shallow slope (elevated interquartile range o f 7.6 min. arc). Compare with figure 5.1a.____________________________________________________________________60 Figure 5.2 Receiver operating characteristic (ROC) curve fo r the motion thresholds (gray line) and the
logistic regression model incorporating the interquartile range (black line) fo r normal versus glaucoma eyes (top) and normal versus suspect eyes (bottom)._____________________________62 Figure 5.3 Relationship between calculated interquartile range and threshold o f motion
frequency-of-seeing curves fo r all subjects. The solid line represents the least-squares linear f i t through the data. Dashed lines represent cut-offs below which all o f control values fo r motion threshold (vertical) and interquartile range (horizontal) lie. O ff scale refers to a single glaucoma eye with marked shallowing o f the frequency o f seeing curve with an interquartile range o f 25 min. arc., o ff the y scale.________________________________________________________________________64 Figure 5.4 Top shows the frequency-of-seeing curve o f a glaucoma suspect with a normal 50% seen
motion threshold o f 8.4 min. arc and a normal slope (interquartile range o f 4.2 min. arc).______66 Figure 5.4 Middle shows the frequency-of-seeing curve from a glaucoma suspect with a similar motion
Figure 5.4 Bottom shows the frequency-of-seeing curve from a glaucoma eye with more extreme shallowing o f the slope, with an abnormal interquartile range o f 9.6 min. arc, although the motion threshold remains normal at 8.5 min. a rc .______________________________________________66 Figure 5.5 Frequency-of-seeing curve o f glaucoma eye from patient aged 75 with elevated threshold
(13.2 min. arc) and normal slope, indicated by interquartile range o f 5.1 min. arc (normal range up to 6 min. arc).___________________________________________________________________67 Figure 6.1 Contour plot o f luminance sensitivity from fine matrix maps performed over blind spot o f a
normal control, superposed with a fundal Scanning Laser Ophthalmoscope image (inverted) o f the subject. Contour lines represent isoluminantpoints, in I dB increments. Note steep sensitivity gradients at the edge o f the blind spot as well as more subtle linear defects corresponding in location and extent to the major retinal vascular trunks exiting the optic d isc ._______________74 Figure 6.2a Top figure is a fundal scanning laser ophthalmoscope image (inverted) obtained from a
patient showing a retinal nerve fibre layer defect. Bottom figure shows high spatial resolution luminance contour plots which have been superimposed. The sensitivity loss corresponds closely to the extent o f the retinal nerve fibre layer defect.______________________________________ 76 Figure 6.2b shows a Humphrey 30-2 greyscale and statpac2 total deviation p lo t, and adjacent FMMs,
which reveal an obvious superior arcuate extending from the blind spot, not shown by the
Humphrey 30-2.____________________________________________________________________ 77
Figure 6.3 a Humphrey 30-2 o f glaucoma eye. Boxes indicate superior and inferior sites o f F M M . 79 Figures 6.3b & d Pointwise difference versus mean plots fo r first and second FM M in the superior
location, fo r raw (b) and Gaussian filtered (d) thresholds. ________________________________79 Figures 6.3c & e Corresponding plots fo r raw (c) and filtered thresholds (e) o f the FMMs in the inferior
location. Dashed lines indicate pointwise limits o f agreement, represented as 2 SD, between the first and second FMMs.______________________________________________________________79 Figure 6.4a SD ofpointwise differences o ffirst and second FM M versus mean sensitivity o ffirst and
second FM M using raw thresholds____________________________________________________82 Figures 6.4b Same axis fo r figure 6.4a, but using Gaussian filtered thresholds. The effect offiltering has
been to reduce the magnitude o f the SD by a factor o f approximately 2, representing a twofold improvement in repeatability. Lines indicates the least squares linear fi t o f the data, excluding I outlier.___________________________________________________________________________ 82 Figure 6.5 a Humphrey 30-2 greyscale and Statpac2 total deviation plot from glaucoma eye, with site o f
FM M indicated by box._____________________________________________________________ 84 Figure 6.5b Resulting FMMs obtained from same patient at the location indicated on figure 6.5 a. Plots
o f Gaussian filtered sensitivity thresholds o f first (left figure) and repeat (right figure) reproducible threshold profiles reveal a steep sensitivity gradient from severely depressed
sensitivity, represented as elevated area, to normal sensitivity. ____________________________84 Figure 6.6a Humphrey 30-2 greyscale and Statpac2 total deviation p lot from glaucoma eye. Box
Figures 6.6b & c Three-dimensional plots o f Gaussian filtered luminance sensitivity thresholds o ffirst and second FMMs. Elevated areas indicate repeatable luminance defects, not seen in the FM M o f an equivalent area o ffie ld from age matched normal controls (figure 6.6d)._________________86 Figure 7. Oa Picture o f a subject performing a M D T te s t.______________________________________94 Figure 7. Ob Close up picture o f the monitor showing the line stimulus used fo r the M D T test. ______94 Figure 7.1 Humphrey 24-2 from a glaucoma subject showing inferior arcuate scotoma. Arrow indicates
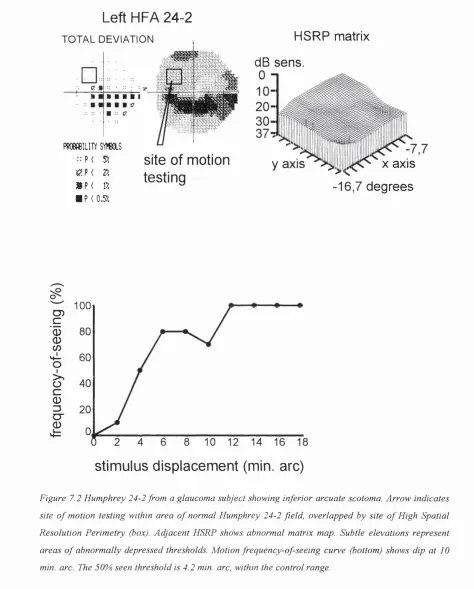
site o f motion testing within area o f normal Humphrey 24-2 field, overlapped by site o f High Spatial Resolution Perimetry (box). Adjacent HSRP matrix map is abnormal: elevations represent area o f depressed thresholds. Motion frequency-of-seeing curve (bottom) shows grossly abnormal motion response.___________________________________________________________________99 Figure 7.2 Humphrey 24-2 from a glaucoma subject showing inferior arcuate scotoma. Arrow indicates
site o f motion testing within area o f normal Humphrey 24-2 field, overlapped by site o f High Spatial Resolution Perimetry (box). Adjacent HSRP shows abnormal matrix map. Subtle
elevations represent areas o f abnormally depressed thresholds. Motion frequency-of-seeing curve (bottom) shows dip at 10 min. arc. The 50% seen threshold is 4.2 min. arc, within the control range.___________________________________________________________________________100 Figures 7.3 Humphrey 24-2 from a glaucoma subject showing superior arcuate scotoma. Arrow
indicates site o f motion testing within area o f normal Humphrey 24-2 field, overlapped by site o f High Spatial Resolution Perimetry (box). Adjacent HSRP matrix map is normal, with normal mean threshold sensitivities, and uniform threshold profile (normal uniformity index). Motion
frequency-of-seeing curve (bottom) shows grossly abnormal motion response. ______________101 Figure 7.4 Humphrey 24-2 from a normal control. Arrow indicates site o f motion testing within area o f
normal Humphrey 24-2 field, overlapped by site o f High Spatial Resolution Perimetry (box). Adjacent HSRP matrix map is normal with uniform luminance profile (mean threshold sensitivity
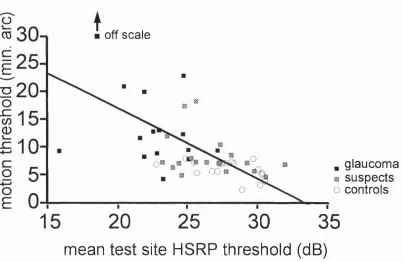
and uniformity index within control range). Normal motion frequency-of-seeing curve (below) with 50% seen threshold within control range.______________________________________________102 Figure 7.5 Relationship between subjects’ Motion Displacement Threshold and HSRP matrix map mean
threshold. The solid line represents the least-squares linear f i t through the data. Arrow indicates 1 outlier o ff the y-scale.______________________________________________________________103 Figures 8. la, b & c Left eye motion test in superotemporal field: vertical line stimulus shown in white
superimposed on fundus image. The arrow shows the direction o f the stimulus displacement in relation to a hypothetical slit-like scotoma orientated along the axis o f the retinal nerve fibre layer shown in black._______________________________________________________________109 Figure 8.2 Scatterplot o f subjects ’ thresholds fo r stimulus motion perpendicular vs. motion parallel to
retinal nerve fibres, with the line o f u n ity._____________________________________________113 Figure 8.3 Difference versus mean plot o f motion thresholds fo r stimulus motion perpendicular and
parallel to retinal nerve fibres. Subjects with normal motion thresholds lie to left o f vertical reference line o f 8.6 min. arc._______________________________________________________114 Figure 8.4 Proportional difference versus mean plot o f motion thresholds fo r stimulus motion
4. Acknowledgements
I would like to acknowledge the encouragement and patience o f my supervisors Professor Fitzke (Institute o f Ophthalmology) and Professor Hitchings (Moorfields Eye Hospital). I am especially indebted to Fred and Roger for their wisdom and for imparting me with a sound scientific training. I also thank both supervisors who as well as being ever accessible for advice, allowed me the freedom to pursue work which I found very interesting.
I would like to thank Dr David Crabb (Institute o f Ophthalmology 1993-97) who provided expert statistical advice and assisted in the statistical analysis in chapters 5 and
6.
Thanks to Ananth Viswanathan (Institute/Moorfields 1995-97) for his programming help which greatly facilitated the analysis o f the study described in chapter 4.
Thank you also to Andrew McNaught, whose collaboration culminated in the study described in chapter 6.
I would like to thank Ted Garway-Heath (Institute/Moorfields 1995-97) and Isobelle Antunes o f the ocular hypertension unit for their assistance in recruiting subjects to undergo High Spatial Resolution Perimetry to provide data for the studies in chapters 6 & 7 .
I gratefully acknowledge the generous support o f the
Friends o f Moorfields Charity
which provided the main project grant. I am also indebted to M r R P Crick and the
International Glaucoma Association
for generously providing me with travel grants to attend international conferences in vision research and present my work.5. Outline of thesis
Chapter 1 summarises the classification, epidemiology, ætiology, and treatment o f
glaucoma. Chapter 2 describes the anatomy and physiology o f the visual system, and outlines the history o f perimetry. Chapter 3 discusses the limitations o f conventional perimetry in detecting early glaucomatous damage and gives an account o f the use o f other psychophysical testing in glaucoma. Chapters 4 to 8 describe the results o f 5 experimental studies in this thesis. Chapter 4 investigates possible differences in reaction time between controls and glaucoma patients for a motion stimulus. Chapter 5 details the improvement in the sensitivity o f the MDT test obtained with the use o f frequency- of-seeing analysis, as compared against the use o f threshold analysis alone. Chapter 6
investigates the use o f High Spatial Resolution Perimetry in glaucoma. Chapter 7 tests the hypothesis that elevated Motion Displacement Thresholds coexist with fine scale depressions o f Humphrey threshold. Chapter 8 describes a study to investigate the effect o f stimulus orientation on motion thresholds.
1. CHAPTER 1
Glaucoma
1.1 Definition
There is no universally agreed definition for glaucoma. One approach is to consider glaucoma as a group o f conditions, characterized by damage to the optic nerve head in association with a diagnostic pattern o f visual field loss, for which elevation o f intraocular pressure is a major risk factor. Recent major epidemiological studies do not include the demonstration o f an elevated lOP (i.e. above 21 mm Hg. ) as part o f the case definition for open angle glaucoma (Mitchell
et a l,
1996; Tielschet al.,
1991). Instead intraocular pressure is more usefully thought o f as a continuous risk factor, which is only one o f several that have been identified.Subjects who have normal visual fields, but have risk factors for the development o f glaucoma such as the presence o f optic disc damage or elevated intraocular pressure, may be defined as glaucoma suspects since they are at risk o f developing the disease in the future.
1.2 Classification
1.2.1 Concepts
Glaucoma is classified into primary or secondary. Primary glaucoma occurs in the absence o f any coexisting or antecedent ocular disease. Secondary glaucomas occur as conditions which are secondary to another ocular or systemic disease. Causes o f secondary glaucoma include uveitis, cataract, and trauma, and account for only approximately 5% o f all glaucomas.
Finally, the congenital glaucomas represent a separate rare group o f disorders characterized by congenital malformations o f the drainage angle o f varying degree, which may be accompanied by ocular or systemic malformations.
1.2.2 Primary Open Angle Glaucoma (PCAG)
The commonest form o f glaucoma in the Western world is primary open angle glaucoma. These patients have by definition cupping o f the optic nerve head and visual field loss, with an open aqueous drainage angle o f normal appearance.
Patients with primary open angle glaucoma frequently remain asymptomatic until extensive and unrecoverable visual field loss has occurred. An important characteristic o f the disease is the progressive deterioration o f the visual field with constriction o f the visual field which may lead ultimately to blindness. Although the intraocular pressure may be raised at the time o f diagnosis, major epidemiological studies have consistently shown that only about half o f newly detected cases o f POAG have an elevated intraocular pressure (commonly defined as >= 21 mm Hg.) at the time o f screening (Sommer
et al.,
1991b). In addition, a significant proportion o f patients diagnosed as having POAG on the basis o f optic nerve head cupping and visual field damage never have elevated lOPs. For example, in the Baltimore eye survey, 21% o f patients confirmed as POAG failed to demonstrate elevated intraocular pressures above 21 mm Hg. on further follow up (Sommer, et al., 1991b). Many clinicians classify these patientsas Normal Tension Glaucoma (NTG), particularly if diurnal measurements o f lOP fail
to demonstrate any elevation o f lOP above 21 mm Hg.
1.3 Epidemiology
In the United States there are probably 2 million glaucoma sufferers, o f whom 120,000 are blind (Leske, 1983). Guzman suggested that the economic burden o f glaucoma rivals that for cataract, despite the considerably lower prevalence o f the disease compared to cataract (Guzman
et al.,
1992). In the US for example, direct health care costs from glaucoma are estimated at about US$ 2 billion (£1.2 billion) and indirect costs at about US$ 500 million (£300 million).1.3.1 Prevalence
Hollows and Graham conducted an epidemiological study that has subsequently become a benchmark for studies o f glaucoma prevalence (Hollows and Graham, 1966). Their study was the first to examine a large proportion o f a defined population using comprehensive case finding methods. They also included extensive visual field testing as part o f the case definition, although this was not performed on all subjects. They studied a sample o f 4231 from Ferndale in Wales (age range 40-70 years) and found a prevalence o f POAG o f 0.5% in the population studied.
Leibowitz et al reported a prevalence o f POAG o f 1.4% from a sample o f 2631 o f the 3977 members o f the Framingham (Massachusetts) Heart Study population still living in
1973-1975 (age range 52-85 years) (Leibowitz
e ta l,
1980).Although these studies were population-based, they were not true random samples o f the population at risk. More recent studies based on the evaluation o f multiple risk factors within a random sample o f the population have suggested a higher prevalence.
The Baltimore Eye Survey surveyed 5308 black and white urban American subjects aged 40 years or older to give a prevalence o f 1.3% among the white population (Sommer, et al., 1991b). The Beaver Dam study reported a slightly higher prevalence for POAG o f 2.1% in a non-urban sample o f 4926 predominantly white subjects in Wisconsin (age range 43-84 years).
A study by Coffey et al reported a prevalence o f 1.9% in a sample o f 2186 subjects aged over 50 in the rural community o f Roscommon in the West o f Ireland (Coffey, et al., 1993).
prevalence rates agree among white populations o f equivalent ages. An important finding that all these studies consistently highlight is the fact that at least 50% or more o f the glaucoma within the community is undiagnosed. They also emphasize the poor performance o f lOP as a screening test, as only half o f newly detected cases o f POAG have raised lOP >=21 mm. Hg. (Coffey, et al., 1993; Klein
et a l,
1992; Sommer, et al., 1991b).1.3.2 Incidence
There are major difficulties in estimating the incidence o f glaucoma. The difficulties o f reliable early detection present problems in deciding at what point the disease becomes manifest. This is illustrated by the observation that pathological changes at the optic disc and nerve fibre layer can occur many years before the development o f a repeatable visual field defect (Quigley
et a l,
1980; Sommeret a l,
1991a; Zeyen and Caprioli, 1993). The incidence o f glaucoma can only be determined by prospective long-term studies, ideally o f a truly representative random sample o f a population. It is hoped that longitudinal follow-up o f the Baltimore and Beaver Dam studies will provide estimates o f the incidence o f glaucoma in the future.1.3.3 Risk factors
The epidemiological studies described above have greatly improved our understanding o f the risk factors which predispose an individual to POAG. These studies have consistently highlighted the multifactorial nature o f the disease. Thus an individuals’ risk o f POAG is best considered as the combination o f a number o f risk factors, although the exact magnitude o f risk attributable to a specific risk factor remains a matter o f debate.
1.3.3.: Intraocular pressure
O f all the risk factors that have been identified in the large epidemiological studies described above, lOP consistently remains a major risk factor.
Leske (1983) suggested that the overall risk o f developing POAG is approximately five times higher in subjects with lOPs > 21mm Hg than in subjects with lower lOPs (Leske,
The Baltimore Eye Survey identified a clear log-linear relationship between the prevalence o f POAG and the level o f the screening 1 0 ? (Sommer, et a l, 1991b). This relationship reached high levels o f significance and existed both for all cases o f POAG and for untreated previously undiagnosed POAG in the community. For example, for subjects with screening lOPs in the 19-21 mm Hg range, the prevalence o f POAG was 1.8%. In subjects with lOPs in the 22-29 mm Hg. range the prevalence was 8.3% and with lOPs above 29 mm Hg. this rose to 25%. A clear relationship between lO P and prevalence was also identified for a black population in the Barbados Eye Study (Leske
e ta l,
1995).Both studies made the important observation that even low levels o f lOP were associated with a small but definite risk o f POAG. Although this risk was small, the fact that the majority o f the population had low screening lOPs resulted in significant numbers o f POAG below 21 mm Hg. This finding o f a continuous relationship between TOP and prevalence may explain the significant numbers o f POAG cases identified with screening pressures below 21 mm Hg. in every major epidemiological study to date. An important finding o f many studies is that they have consistently identified a significant proportion o f undiagnosed POAG using accepted disc and field criteria in subjects with screening lOPs below 21 mm Hg., emphasising the poor performance o f TOP as a screening measure (Coffey, et a l, 1993; Klein, et a l, 1992; Sommer, et a l, 1991b).
1.3.3.Ü Age
Epidemiological studies o f POAG prevalence have identified age as a major risk factor, which may be as important as TOP. For example, the Beaver Dam eye study indicated that the prevalence o f POAG increased with age from 0.9% in subjects 43 to 54 years o f age to 4.7% in people 75 years o f age or older (Klein, et a l, 1992). Similar results were obtained in the Roscommon study showing that the 70-79 year old age band have a 4.5 times increased risk compared to the 50-59 age group (Coffey, et a l, 1993). By comparison, the Baltimore study identified an eightfold increase for the same age groups (Sommer, et a l, 1991b). Prevalence rates for older age groups may be even higher, as suggested by the Blue Mountain Study (Mitchell, et a l, 1996). This study reported an exponential increase in POAG prevalence with age, with a prevalence rising to 10.2% in
people aged 85 years or older. >\
1.3.3.!!! Race
Being o f African, African-American, or Afro-Caribbean origin is a significant risk factor. The Baltimore Eye Survey showed that black Americans had strikingly higher rates o f POAG, compared to whites at every age (Tielsch, et al., 1991). For example, the prevalence rates for blacks ranged from 1.2% in those aged 40 to 49 years to 11.3% in those aged 80 years or older. In whites for the same age groups the rates ranged from 0.9% to 2.2%. The Barbados Eye Study found even higher prevalence rates o f POAG in an entirely Afro-Caribbean population (Leske
et a l,
1994). Age-adjusted comparisons showed that the prevalence rates for the Barbados Eye study were 7 times that o f the Baltimore Eye Survey whites, and 1.5 times that o f the Baltimore Eye Survey black participants.1.3.3.ÎV Family history
A number o f studies have shown that a family history is an important risk factor in the development o f POAG (Leske, et al., 1995; Tielsch
et a l,
1994). The Baltimore Eye Survey showed a significant age-adjusted association o f POAG with a family history of glaucoma (Tielsch, et a l, 1994). This was higher in siblings (odds ratio = 3.69) than in parents (odds ratio = 2.17) or children (odds ratio = 1.12). However there was evidence for selection bias, as the odds-ratios were between two and three times higher for subjects who had prior knowledge o f their glaucoma diagnosis than for those who first received their diagnosis at the time o f the study examination.1.3.3.V Other factors
Although diabetes was previously thought o f as an independent risk factor for POAG, results from large population-based studies have failed to find evidence o f an association between diabetes and POAG (Sommer, et a l, 1991b; Tielsch
et a l,
1995).There is some evidence that myopia is a risk factor for POAG (Wilson
et al.,
1987) but recent studies have suggested there is no direct link (Quigleyet al.,
1994).The majority o f epidemiological studies have not shown any association o f POAG with gender (Coffey, et al., 1993; Klein, et al., 1992; Tielsch, et al., 1991). The exceptions are the Framingham and Barbados Eye Studies, which identified a preponderance o f males with POAG.
Another factor which has been investigated is whether or not there is a significant association between migraine and POAG, which remains a matter o f debate. For example, although a positive association between migraine and Normal Tension Glaucoma (NTG) has been reported (Phelps and Corbett, 1985), results from the Beaver Dam study found no association between POAG and a history o f migraine (Klein, et al., 1992). However the relationship between migraine and POAG is complex and may be modified by age, as shown by the recent Blue Mountain study which did find a significant association between headache and POAG (odds ratio 2.5) in the 70-79 age group, although not for other age groups (Wang
et al.,
1997).1.4 Ætiology
1.4.1 Pathogenesis
A full discussion o f the extensive and controversial literature is beyond the scope o f this MD. A recent comprehensive review is given by Hayreh (Hayreh, 1994).
1.4.2 Mechanical theories
The hypothesis that glaucomatous optic neuropathy is produced mechanically by raised lOP was first postulated by von Graefe nearly 140 years ago (von Graefe, 1857). In human eyes with secondary glaucoma, elevations o f intraocular pressure are clearly associated with optic nerve cupping. In other primates, optic nerve cupping can be obtained experimentally in eyes with chronic elevation o f intra-ocular pressure obtained using laser damage to the trabecular meshwork. This remains the only method o f inducing glaucomatous changes o f the optic nerve that resemble those seen in human POAG (Pederson and Gaasterland, 1984). Using this primate model, Pederson et al have examined the development o f optic disc cupping with chronic elevation o f lOP. They reported that the degree o f neuronal loss was more marked in eyes with higher levels o f lOP and in eyes with a longer exposure to an elevated lOP (Pederson and Gaasterland,
1984). Histological examination o f these eyes shows posterior bowing o f the lamina cribrosa, with associated local interruption o f axonal transport at this level. According to the mechanical theory, it is proposed that mechanical compression o f the axons by raised intraocular pressure occurs as they traverse the lamina cribrosa, resulting in ganglion cell death.
Post mortem studies o f glaucomatous human eyes by Quigley et al have shown similar changes, characterised by posterior bowing o f the lamina cribrosa with associated stretching, distortion and compression o f the laminar sheets (Quigley, et al., 1981). This is associated with reductions in optic nerve axon density throughout the optic nerve, which is more severe in the superior and inferior poles. This led Quigley to propose that the characteristic visual field defects in glaucoma result from regional differences in the structure o f the scleral lamina cribrosa and their susceptibility to mechanical damage (Quigley, et a l, 1981).
et al., 1991b; Vogel
et al.,
1990; Weberet al.,
1993) and with the extent o f glaucomatous optic nerve damage (Airaksinenet al.,
1992). Other studies have failed to show an unequivocal relationship between lOP and progressive deterioration in the visual field (Chauhan and Drance, 1992; Holmin and Krakau, 1982; O'Brienet al.,
1991). It has become apparent from these studies that for a given level o f intra-ocular pressure elevation, there exists considerable individual variability in the susceptibility to developing glaucomatous optic nerve change and visual field deterioration. This clinical observation has recently been supported experimentally by Harweth et al. They investigated the relationship between visual field deterioration and intraocular pressure elevation in 18 monkeys with laser induced unilateral glaucoma. They found that visual field defects occurred above a certain “threshold” o f lOP elevation, with the absolute level o f threshold TOP elevation varying considerably between eyes. However once visual damage occurred, the rate o f visual field progression occurred at more or less uniform rates (Harwerth and Smith, 1997).
1.4.3 Vascular theory
Another mechanism that has been postulated to account for the reduction in ocular blood flow in some patients is vasospasm. A number o f studies have identified the presence o f peripheral vasospasm (e.g. migraine, chronic cold hands and feet) as a risk factor for glaucoma, particularly for normal tension glaucoma (Drance
et al.,
1988; Phelps and Corbett, 1985).A number o f techniques have been used to attempt to obtain an indirect measure o f optic nerve head blood flow. These have been limited by the difficulties o f obtaining sensitive and reproducible measurements and may not measure the posterior ciliary circulation which is o f prime importance.
Abnormalities o f blood flow have been reported in normal tension glaucoma using the ocular pulse to measure blood flow (James and Smith, 1991) and colour Doppler ultrasonography to measure blood flow velocity (Butt
et al.,
1995).1.4.4 Apoptosis
1.4.5 Genetic factors
The mechanism by which genes influence the susceptibility to POAG is as yet unknown. Teikari and Airaksinen have recently shown that IGF and the dimensions o f the optic nerve head are genetically determined (Teikari and Airaksinen, 1992). This suggests that genetic factors may influence the facility o f aqueous outflow and the susceptibility o f the optic disc to the development o f glaucomatous change. Other evidence confirming the importance o f genetic factors in determining the susceptibility to glaucoma is the identification o f a number o f pedigrees with autosomal dominant inheritance POAG (Kitsos
et al.,
1988). Sheffield et al have recently published the first mapping o f a gene causing an autosomal dominant form o f juvenile open angle glaucoma (JOAG) in a pedigree (Sheffieldet a l,
1993). They used linkage analysis to identify positive linkage to a region on the long arm o f chromosome 1. Subsequently, other investigators have also demonstrated linkage to this region. However, this linkage appears to be associated with rare juvenile onset primary open angle glaucoma (JOAG) and the genetic relationship between JOAG and POAG is not known. The later onset o f POAG and the undoubted genetic heterogeneity o f POAG presents major difficulties in the mapping o f POAG genes.1.5 Treatment
It is beyond the scope o f this thesis to give an exhaustive account o f the various treatments for glaucoma. For a more detailed account o f the therapeutic rationale for glaucoma the reader is referred to the following reviews (Hitchings, 1992; Hitchings,
1995; Luntz and Harrison, 1994).
Surgical treatment (known as trabeculectomy or filtration surgery) commonly involves making a guarded corneoscleral channel to allow a controlled flow o f aqueous into the subconjunctival space. Results from recent trials have shown filtration surgery to be superior to medical or laser treatment in reducing lOP and preserving vision (Migdal, et al., 1994). Recently there have been major advances in surgical techniques to improve the long-term success o f drainage surgery. One advance is the use o f perioperative antiproliferative agents to modify the local healing response and reduce scarring at the site o f surgery (Khaw and Migdal, 1996). A number o f trials have shown that the perioperative application o f these agents can achieve a significant lowering o f lOP in the long-term after surgery, compared with previous techniques (Goldenfeld
et a l,
1994). Despite these advances, postoperative subconjunctival scarring still remains the most important cause o f subsequent failure o f drainage surgery (Khaw and Migdal, 1996). In normal tension glaucoma, treatment has been aimed at further lowering TOP (deJonget a l,
1989; Hitchingse ta l,
1995; Schulzer, 1992) or correcting for presumed abnormal vascular circulation at the optic nerve head (Kitazawaet a l,
1989; Netlandet a l,
1993). With regard to the efficacy o f medical treatment o f POAG, Rossetti have emphasized the fact that only a fraction (16/102) o f published trials were properly designed to assess the effectiveness o f treatment by comparing active treatment with an untreated or placebo group. O f such trials, only 3 trials investigated the effect o f treatment on long-term visual function, and their cumulative results failed to show a protective effect o f treatment (Rossettiet a l,
1993). The authors concluded that there was a need for a more evidence based and critical assessment o f current treatment in glaucoma. This situation may be improved once the results are known from a number o f large scale prospective treatment trials with defined end points which include visual function.1.6 Summary
lamina cribrosa. Alternatively, the vascular theory postulates that an abnormality in blood flow to the optic nerve head is the main cause o f nerve fibre damage. However, it is likely that the pathogenesis is multifactorial. This is supported by recent epidemiological evidence which has identified a number o f risk factors. These factors include increasing age, elevated lOP, being o f Affo-Caribbean origin, and having a family history o f glaucoma.
2.
CHAPTER 2
Visual function in glaucoma
2.1 The anatomy of the visual pathway
2.1.1 Introduction
This section will examine the anatomy o f the visual system and discuss the concept o f parallel visual processing in the human visual system. An understanding o f the visual pathways provides the framework in which to develop more sensitive tests o f early visual damage in glaucoma.
2.1.2 The retinal ganglion cell
The main pathway o f visual information in the primate retina is from the photoreceptors to the bipolar cells, which in turn synapse to the ganglion cells, either directly or via amacrine cells or other bipolar cells.
Ganglion cells are defined as visual neurons having long axons that project to the brain via the optic nerve. There are approximately 1.1 - 1.3 million ganglion axons (fibres) in the adult human optic nerve (Balazsi
et al.,
1984; Pottset a l,
1972). The number o f ganglion fibers declines with age throughout life, although the individual variation in the total nerve fibre count makes it extremely difficult to estimate the normal rate o f age- related decline. Frisen used pooled histological study data to estimate a retinal ganglion cell loss o f approximately 5,000 per year (Frisen, 1991). The axons o f the ganglion cells become myelinated at the lamina cribrosa, and undergo partial decussation at the optic chiasm, to synapse with second order neurons at the dorsal lateral geniculate nucleus (dLGN).The ganglion cell is o f fundamental importance in glaucoma because the major histological abnormality in glaucoma is an absolute reduction in the number o f ganglion cell axons in the optic nerve, as a consequence o f ganglion cell death (Quigley
et a l,
Physiological studies in cats and primates suggested that retinal ganglion cells could be separated into 2 major classes, called “X” and “Y” cells (Lennie, 1980). These cells were found to correspond to anatomically distinct classes o f ganglion cells. The anatomical equivalents o f the “X ” cells have confusingly been called B or P cells in primates, or
midget cells in humans. To avoid confusion it is easier to refer to midget cells as P-cells,
as these cells project to the parvocellular layers o f the dorsal lateral geniculate nucleus (dLGN).
The anatomical equivalents o f the “Y ” cells are A or a cells in primates, and parasol cells in humans. I shall refer to these cells as M-cells as these cells project to the magnocellular layers o f the dLGN.
P-ganglion cells constitute 80% o f the retinal ganglion cells in primates, and are found at highest density in the fovea (Perry
et al.,
1984). Characteristic features o f P-cells include the presence o f small dendritic fields, small to medium sized axon diameters, and projections to the parvocellular dLGN (Leventhalet al.,
1981).M-ganglion cells constitute only 10% o f the retinal ganglion cells and are evenly distributed across the retina. Typically M-cells are characterized by the presence o f large dendritic fields, faster conducting large axon diameters, and projections to the magnocellular dLGN (Leventhal, et al., 1981).
2.1.3 Parallel visual pathways
Physiological evidence suggests that the morphological differences between the P-cells and M-cells reflect distinct differences in function (Livingstone and Hubei, 1987).
For example, M-cells have high contrast sensitivity, and respond optimally to low spatial frequency stimuli (<1 cycle/deg ). M-cells also lack spectral selectivity, i.e. they are not tuned to a particular waveband or colour (De-Monasterio, 1979; Derrington and Lennie,
1984; Kaplan and Shapley, 1982; Marrocco, 1976; Perry, et a l, 1984).
P-cells have much smaller receptive fields, and respond optimally to high spatial frequency stimuli. They have low contrast sensitivity and do show spectral selectivity (De-Monasterio, 1979; Derrington and Lennie, 1984; Kaplan and Shapley, 1982; Marrocco, 1976; Perry, et a l, 1984).
The anatomic separation o f M-cells and P-cells is most evident in the dLGN, which is sharply delineated into 6 layers; retinal P-cells synapse with second order neurons in the dorsal 4 layers (parvocellular layers), M-cells synapse in the ventral 2 layers.
The parvocellular layers o f the dLGN project to layer IVC beta (the “striate” cortex), and then to layer III o f the primary visual cortex (Brodmans area 17 or V-1). Parvocellular connections o f layer III project widely, with major projections to Brodmans area 18, to the dorsal lateral parietal cortex and the inferotemporal cortex. Magnocellular dLGN projects to layers IVC alpha and IVB o f the primary visual cortex. From layer IVB, there are projections to layer III, as well as direct connections to the middle temporal cortex, otherwise known as MT. For the sake o f simplicity, only the major connections o f the parallel pathways have been considered here.
2.1.4 Visual function and parallel pathways
There is considerable evidence that fundamental visual processing occurs via the separate pathways o f the parvocellular and magnocellular systems. This segregation o f visual processing is broadly maintained throughout the visual system, although recent evidence suggests that there is some mixing o f the parallel pathways in the higher visual centres (Merigan and Maunsell, 1993).
The concept o f separate processing streams is o f fundamental importance, and is a basis for understanding the development o f more sensitive tests o f visual function in glaucoma. The following section details some o f the evidence for parallel processing as it applies to the following aspects o f visual function.
2.1.4.Î Contrast sensitivity and visual acuity
Experimental work in primates suggests that contrast sensitivity at low and medium spatial frequencies is principally a function o f the magnocellular system, which is far more sensitive than the parvocellular system at these frequencies (Derrington and Lennie,
1984).
2.1.4.!! Motion sensitivity
There is extensive evidence to suggest that motion sensitivity is principally carried out by the magnocellular system. Experimentally induced lesions o f the magnocellular dLGN in primates results in profound losses o f motion sensitivity to fast moving gratings (Merigan
et al.,
1991; Merigan and Maunsell, 1990). Other experimental work in primates has shown that the perception o f line displacement motion is primarily a function o f magnocellular ganglion cells (Lee, 1993; Leeet al.,
1993; Schilleret al.,
1990a; Schillere ta l,
1990b).Further evidence has been provided from psychophysical experiments by Livingstone and Hubei. They demonstrated that human motion sensitivity was characterized by high contrast sensitivity and colour insensitivity, both o f which are known properties o f the magnocellular system (Livingstone and Hubei, 1988).
However a number o f recent studies have shown that the parvocellular system also makes an important contribution to motion acuity. Studies in humans o f the motion reversal effect (the apparent reversal o f the direction o f motion o f a high frequency grating) provide estimates o f the sampling density o f receptors. Comparisons with the known retinal densities o f magnocellular and parvocellular ganglion cells allow the contribution o f the two pathways to be assessed. Several such studies have shown that motion acuity in the periphery (30 to 40 degrees eccentricity) is limited by the density o f parvocellular cells rather than magnocellular cells (Anderson
et al.,
1995; Galvinet al.,
1996). Some authors have suggested that parvocellular cells play an important role in limiting motion acuity across the entire field (Anderson, et al., 1995). Physiological studies have also shown that P-cells in the visual cortex respond well to moving stimuli.
2.1.4.iii Flicker sensitivity
2.1.4.iv Colour sensitivity
Primate colour perception appears to be primarily mediated by the parvocellular system. This is supported by evidence from primate studies which showed that toxicant induced damage to the parvocellular pathway resulted in substantial reductions in colour sensitivity (Merigan, 1989).
2.2 Measurement of visual function in glaucoma
2.2.1 Fundamentals of perimetry
The visual field is defined as the portion o f space from which light can enter the eye, reach the retina, stimulate the photoreceptors and evoke a sensation o f light. Perimetry is defined as the study and measurement o f the visual field, and is the technique used to identify disturbances in the visual field. It is therefore essential for diagnosing and monitoring glaucomatous visual field damage.
The oldest and most established techniques o f perimetry use tests o f the light sensitivity across the visual field. These tests measure the luminance sensitivity which is the ability o f the eye to perceive the brightness difference between a test target and the background. This luminance sensitivity is greatest at the fovea, and declines with increasing distance towards the periphery. The decline in sensitivity with eccentricity has been described as the “hill o f vision”, which was first coined by Traquair (Traquair, 1931).
2.2.2 History of perimetry
who provided a classification for the evolution o f glaucomatous defects (Traquair, 1931).
2.2.3 Kinetic perimetry
A significant advance was made by Goldmann who developed a bowl perimeter to allow full control o f the luminance o f the background and stimulus (Goldmann, 1945). The Goldmann perimeter is commonly used to perform kinetic perimetry. Kinetic perimetry is performed by moving the stimulus from areas o f the visual field where it cannot be seen to where it can be seen. Lines called isopters are drawn to connect points which show the same sensitivity to differences between stimulus and background. An overall contour map o f the field can be generated using different stimuli to obtain different isopters. Goldmann perimetry became the clinical standard in glaucoma and was only superceded in the last decade by the developments in static automated perimetry.
2.2.4 Static perimetry
An alternative approach to kinetic perimetry is the technique o f static perimetry. Stimuli are presented at fixed locations in the visual field and at varying levels o f luminance. Static perimetry was first described by Sloan using an arc perimeter and by Harms using a bowl perimeter (Harms, 1940; Sloan, 1939). Static perimetry has a number o f important advantages over kinetic perimetry as it can be made operator independent, and lends itself to automation and numerical analysis. However, the potential benefits o f static perimetry have only been realized with the development o f fully automated perimetry.
2.2.5 Automated perimetry
In automated perimetry the entire decision-making process o f the test is controlled by a computer, thus eliminating any bias by the examiner. Automated perimetry is now the predominant and preferred method o f perimetry for glaucoma in clinical practice and research.
The Humphrey Field Analyzer was introduced in the mid 1980s by Heijl (Heijl, 1985). Since this time, a wide range o f automated perimeters has become available, including updated versions o f the Humphrey Field Analyzer, the Octopus and the Henson perimeters. These machines offer a number o f different test programs which utilize either suprathreshold or threshold static examination strategies. Suprathreshold strategies present stimuli at intensities calculated to be above the patient’s threshold at that location, and are useful for rapid screening o f the visual field. Alternatively, full threshold strategies can be used to obtain quantitative estimates o f the threshold at each location by presenting stimuli which change luminance in a stepwise way. Full threshold strategies have the advantage o f allowing a quantitative assessment o f the visual field. This allows changes in the threshold to be assessed over time, although a disadvantage is they are more time consuming and demanding for the patient. The use o f full threshold perimetry is now widely accepted as the mainstay technique for diagnosing and monitoring visual field loss in glaucoma.
I have used full threshold testing programs on the Humphrey Field Analyzer for the research in this thesis. Details o f the test strategy that was used are given in the following section. Comprehensive surveys o f the instrumentation and test strategies currently available are given by Lachenmayr (Lachenmayr and Vivell, 1993) and Henson (Henson
e ta l,
1996).2.2.6 The Humphrey Field Analyzer (HFA)
2.2.6.Î Specification
The Humphrey field analyzer is a bowl perimeter that performs fully automated static perimetry under constant photopic background conditions o f 31.5 apostilbs. The standard projected stimulus is a white size III stimulus, which can be varied in luminance over a range o f over 5.1 log units (range 0.08 to 10,000 apostilbs). The threshold is measured in terms o f sensitivity, ranging from 0-50 dB, where 0 dB represents maximum stimulus brightness.
2.2.6.Ü Test pattern and test strategy
tests consist o f a matrix o f test locations covering the central 24 and 30 degrees o f visual field respectively. The distance between the test locations is 6 degrees, and none o f the test locations lies on the horizontal or vertical meridians.
Alternatively the “custom grid” program allows the experimenter to apply a matrix o f test locations to a particular area o f field, using test locations separated by smaller distances, for instance by 2 degrees. This program was used in my investigations o f High Spatial Resolution Perimetry.
The standard strategy used by the Humphrey for full threshold testing is a 4/2 dB two reversal staircase procedure. The algorithm initially determines the threshold twice at each o f four primary seed locations situated at 9 degrees eccentricity. The starting luminance o f the primary locations is 25 dB. The final 2 dB crossing o f threshold can occur in either the ascending or descending direction and the threshold is taken as the luminance intensity o f the last seen stimulus. The initial starting luminance o f the secondary locations is 2 dB higher than the expected threshold value derived from the knowledge o f the sensitivity o f the primary locations and o f the slope o f the hill o f vision. Fixation is also monitored during the test using the Heijl and Krakau technique, which involves the presentation o f a suprathreshold stimulus within the site o f the predetermined blind spot (Heijl and Krakau, 1975). If this is seen then a loss o f fixation is indicated. The patient’s performance is also assessed by the frequency o f false positive and false negative results.