Patient Preference and Adherence
Dove
press
O r i g i n A l r e s e A r c h
open access to scientific and medical research
Open Access Full Text Article
health-related quality of life and treatment
satisfaction in patients with gout: results
from a cross-sectional study in a managed
care setting
Puja P Khanna1 Aki shiozawa2 Valery Walker3 Tim Bancroft3 Breanna essoi3 Kasem s Akhras4 Dinesh Khanna1
1Department of internal Medicine, University of Michigan, Ann Arbor, Mi, UsA; 2global Outcome research, Takeda Pharmaceuticals international, inc., Deerfield, il, UsA; 3health economics and Outcomes research, Optum, eden Prairie, Mn, UsA; 4novartis Pharmacy services Ag, Dubai, United Arab emirates
Background: Patient satisfaction with treatment directly impacts adherence to medication.
Objective: The objective was to assess and compare treatment satisfaction with the Treatment Satisfaction Questionnaire for Medication (TSQM), gout-specific health-related quality of life
(HRQoL) with the Gout Impact Scale (GIS), and generic HRQoL with the SF-12v2® Health
Survey (SF-12) in patients with gout in a real-world practice setting.
Methods: This cross-sectional mail survey included gout patients enrolled in a large
com-mercial health plan in the US. Patients were $18 years with self-reported gout diagnosis, who
filled $1 prescription for febuxostat during April 26, 2012 to July 26, 2012 and were not taking
any other urate-lowering therapies. The survey included the TSQM version II (TSQM vII, score 0–100, higher scores indicate better satisfaction), GIS (score 0–100, higher scores indicate worse condition), and SF-12 (physical component summary and mental component summary). Patients were stratified by self-report of currently experiencing a gout attack or not to assess the discriminant ability of the questionnaires.
Results: A total of 257 patients were included in the analysis (mean age, 54.9 years; 87% male).
Patients with current gout attack (n=29, 11%) had worse scores than those without gout attack
on most instrument scales. Mean differences between current attack and no current attack for
the TSQM domains were: −20.6, effectiveness; −10.6, side effects; −12.1, global satisfaction (all
P,0.05); and −6.1, convenience (NS). For the GIS, mean differences were: 30.5, gout overall
concern; 14.6, gout medication side effects; 22.7, unmet gout treatment needs; 11.5, gout concern
during attack (all P,0.05); and 7.9, well-being during attack (NS). Mean difference in SF-12
was −6.6 for physical component summary (P,0.05) and −2.9 for mental component summary
(NS). Correlations between several TSQM and GIS scales were moderate.
Conclusion: The TSQM and GIS were complementary in evaluating the impact of gout flare
on treatment satisfaction and HRQoL. Correlations between the two instruments supported the relationship between treatment satisfaction and HRQoL.
Keywords: febuxostat, gout, gouty arthritis, Treatment Satisfaction Questionnaire for Medicine, Gout Impact Scale, SF-12
Introduction
Gout is an inflammatory arthritis caused by deposition of monosodium uric acid crystals in the joints and surrounding tissues (tophi) as a result of excess uric acid burden.1,2 Acute gout attacks manifest as painful, swollen joints; recurrent flares lead to chronic tophaceous gout, resulting in joint damage and disability.2,3 Gout and gout flares are associated with reduced health-related quality of life (HRQoL) 4–7 and higher
correspondence: Aki shiozawa global Outcome research, Takeda Pharmaceuticals international, inc.,
One Takeda Parkway, Deerfield,
il 60015, UsA Tel +1 224 554 7161 Fax +1 224 554 7983
email aki.shiozawa@takeda.com
Journal name: Patient Preference and Adherence Article Designation: Original Research Year: 2015
Volume: 9
Running head verso: Khanna et al
Running head recto: Health-related quality of life in gout disease DOI: http://dx.doi.org/10.2147/PPA.S83700
Patient Preference and Adherence downloaded from https://www.dovepress.com/ by 118.70.13.36 on 26-Aug-2020
For personal use only.
Number of times this article has been viewed
This article was published in the following Dove Press journal: Patient Preference and Adherence
Dovepress
Khanna et al
health care costs.8,9 In the US, the estimated prevalence of gout has increased sharply over the last few decades, from 2.9% of adults in 1988–1994 to 3.9%, or 8.3 million adults, in 2007–2008.10
The American College of Rheumatology (ACR) and European League Against Rheumatism (EULAR) guidelines for the pharmacologic management of acute gout attacks include oral colchicine, non-steroidal anti-inflammatory drugs, and corticosteroids.11,12 For the management of chronic gout, ACR guidelines recommend long-term urate-lowering therapy (ULT) for patients diagnosed with gouty arthritis and meeting one of four criteria, including frequent gout attacks and the presence of a tophus or tophi.13 EULAR guidelines are similar, recommending lifetime ULT for patients with recur-rent gout attacks, chronic arthropathy, tophaceous deposits, nephrolithiasis, and/or radiographic changes associated
with gout.11 Both ACR and EULAR recommend a xanthine
oxidase inhibitor (XOI) as first-line treatment, namely, allopurinol or febuxostat. Probenecid is an alternative for patients who are intolerant of XOIs or for whom XOIs are contraindicated. The goal of ULT is to maintain serum urate levels below 6 mg/dL.11,13
Despite the availability of ULT, many gout patients do not achieve target serum urate levels, in part due to poor adherence to therapy in clinical practice.14–17 In US studies of patients newly initiating ULT, 56%–64% of patients were classified as non-adherent (based on a medication posses-sion ratio less than 0.80) in the 1st year of treatment.15,17 There are multiple barriers to adherence; however, several studies in multiple therapeutic areas have demonstrated a positive link between treatment satisfaction and adherence to therapy.18,19 Treatment satisfaction is also positively corre-lated with HRQoL.19–21 Assessment of treatment satisfaction and HRQoL provides an opportunity to incorporate patient perspectives into clinical decision-making, which should ultimately improve the quality and value of health care.22
The Gout Impact Scale (GIS) is a validated disease-spe-cific instrument that assesses the impact of gout on HRQoL.23 The GIS showed evidence of validity to assess disease-spe-cific functioning and health in patients with gout and seems to capture different aspects than those represented in the Health Assessment Questionnaire and SF-36 in a real-world setting.24 The Treatment Satisfaction Questionnaire for Medication (TSQM) is a validated measure of patient satisfaction with medication.25 The TSQM has been used in studies of other rheumatic diseases26,27 but, to our knowledge, has not been evaluated in patients with gout. Comparing results of both HRQoL and treatment satisfaction instruments in clinical
practice will help inform the selection of tools that provide meaningful insight to clinicians managing gout patients. The objective of this study was to assess and compare treatment satisfaction with the TSQM, gout-specific HRQoL with the GIS, and generic HRQoL with the SF-12v2® Health Survey (SF-12) in gout patients in a real-world practice set-ting, including the assessment of the ability to discriminate between patients with and without a gout attack.
Methods
study overview
This study was a cross-sectional mail survey of patients with self-reported gout who were taking febuxostat28 at the time of the survey. The study protocol received ethics approval and a waiver of authorization from the New England Insti-tutional Review Board (NEIRB). Patients were invited to participate via a mailed invitation that included a consent form, health information release form, the survey and notifi-cation that a US$25 incentive would be sent to patients who completed the survey. The survey was completed August– November 2012.
Patient identification
The study population included commercial health plan members identified in the Optum Research Database which contains claims data for approximately 33.9 million patients with commercial insurance, from all US geographic census regions.29 Health plan members who met the following criteria were eligible to receive an invitation to participate in the study: 1) $1 claim for febuxostat between April 26, 2012 and July 26, 2012; 2) age $18 years as of January 1, 2012 (ie, year of febuxostat prescription); 3) valid provider and patient information; 4) current enrollment in the health plan; and 5) usable patient health information. Patients with a self-reported diagnosis of gout on the survey, who could read and understand English, and who completed the consent and health and information release forms, were included in the analysis. Patients were excluded if they reported a cancer diagnosis in the previous year, had never taken febuxostat, had discontinued febuxostat prior to completing the survey, or had initiated a ULT in addition to febuxostat.
survey
Patients reported demographic (age, sex, and race), socio-economic (highest education level, employment status, occupation, and occupational activities), and clinical (height, weight, and comorbidities) data. Gout status was assessed by asking patients if they had been diagnosed with gout and
Patient Preference and Adherence downloaded from https://www.dovepress.com/ by 118.70.13.36 on 26-Aug-2020
Dovepress health-related quality of life in gout disease
whether they were currently experiencing a gout attack. Medication data included ULT taken prior to febuxostat and concomitant medications to prevent gout attacks or flares. Febuxostat-related data included start and stop dates, dose strength and frequency, and discontinuation information, including any new ULT started.
Treatment satisfaction was assessed by the TSQM version II.30 Patients were asked on the TSQM to rate their level of satisfaction with the ULT they were currently tak-ing for gout. The TSQM has eleven items, representtak-ing four domains (Table 1) scored from 0 to 100, with higher scores indicating better satisfaction.
HRQoL was assessed by the GIS23,31 and SF-12.32,33 The GIS is a disease-specific HRQoL instrument that measures the impact of gout on HRQoL and contains 24 questions representing five scales (Table 1). Each scale has a score of 0–100 with higher scores indicating “worse condition/ impairment” or “greater gout impact”. The SF-12 is a generic HRQoL instrument with eight scales and two summary scores: the physical component summary (PCS) and mental component summary (MCS). T scores for PCS and MCS were calculated by transforming raw scores into norm-based scores to achieve the same mean (50) and standard deviation (SD, 10) of the 2009 US general population normative sample.32
statistical analyses
The sample size was calculated to obtain a pre-specified level of precision for the mean TSQM global satisfaction score. A sample size of 219 is large enough to expect the width of a 95% confidence interval around the mean TSQM global satisfaction score to be no more than 6, assuming a TSQM global satisfaction score SD of 22.6.25
The primary outcomes were treatment satisfaction (TSQM scores) and gout-specific HRQoL (GIS scores). Secondary analyses included assessment of the influence of current gout attack status on patient characteristics, TSQM, GIS, and SF-12 scores, correlations among TSQM, GIS, and SF-12 scales, and patient characteristics associated with TSQM domain scores. The influence of current gout attack status (yes/no) was tested by two-sample t-tests for continuous variables and chi-square test for categorical variables. Pearson correlation coefficients were calculated for the TSQM, GIS, and SF-12 scores. We categorized the strength of the correlation (based on the absolute values of r) as very weak (r=0–0.19), weak (r=0.20–0.39), moderate (r=0.40–0.59), relatively strong (r=0.60–0.79), and strong (r=0.8–1).34
Characteristics of patients most satisfied with treat-ment were assessed by multivariate regression models,
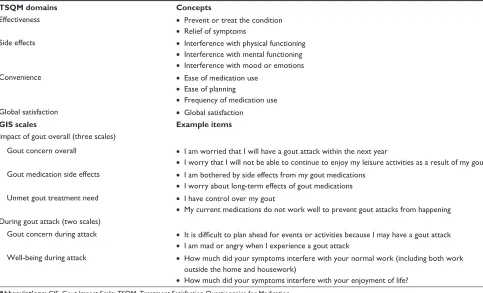
Table 1 concepts from the TsQM and example items from gis
TSQM domains Concepts
effectiveness • Prevent or treat the condition
• relief of symptoms
side effects • interference with physical functioning
• interference with mental functioning • interference with mood or emotions
convenience • ease of medication use
• ease of planning
• Frequency of medication use
global satisfaction • global satisfaction
GIS scales Example items
impact of gout overall (three scales)
gout concern overall • i am worried that i will have a gout attack within the next year
• i worry that i will not be able to continue to enjoy my leisure activities as a result of my gout gout medication side effects • i am bothered by side effects from my gout medications
• i worry about long-term effects of gout medications Unmet gout treatment need • i have control over my gout
• My current medications do not work well to prevent gout attacks from happening During gout attack (two scales)
gout concern during attack • It is difficult to plan ahead for events or activities because I may have a gout attack
• i am mad or angry when i experience a gout attack
Well-being during attack • how much did your symptoms interfere with your normal work (including both work outside the home and housework)
• how much did your symptoms interfere with your enjoyment of life?
Abbreviations: gis, gout impact scale; TsQM, Treatment satisfaction Questionnaire for Medication.
Patient Preference and Adherence downloaded from https://www.dovepress.com/ by 118.70.13.36 on 26-Aug-2020
Dovepress
Khanna et al
one for each TSQM domain. The dependent variable was the TSQM domain score and independent variables were age, race, ethnicity, sex, body mass index, employment status, occupation, occupational activities, highest level of education, febuxostat user status (new or continuing user; new users started febuxostat within 60 days of survey completion), febuxostat dose per tablet, satisfaction with febuxostat compared with prior ULT, concomitant non-ULT medication(s) to prevent gout attack/flares, current gout attack status, count of comorbid conditions, and nor-mative score of SF-12 bodily pain scale (,47, 47–53, .53). Pairwise correlations among independent variables were examined to assess orthogonality of study design. A least-squares regression model was used for the TSQM domains of effectiveness, convenience, and global satisfaction using
F-tests for significance of independent variables. Because
nearly 80% of subjects had a side effect domain score equal to 100 (the maximum possible), a logistic regression model was used for the side effect domain score as a dichotomous variable (1 if side effect score equaled 100, 0 otherwise) and chi-square tests were used for significance of independent variables.
Results
Patient identification
There were 3,272 health plan enrollees with $1 claim for febuxostat between April 26, 2012 and July 26, 2012 (Figure 1A). Of these enrollees, 1,206 (36.9%) were survey eligible and were mailed a survey. There were 281 valid respon-dents for a survey response rate of 23.3% (Figure 1B). Twenty-four respondents (8.5%) were excluded because, at the time of the survey, they had either discontinued febuxostat (n=21) or were taking another ULT in addition to febuxostat (n=3). The final analytic sample included 257 patients who were taking only febuxostat when they completed the survey.
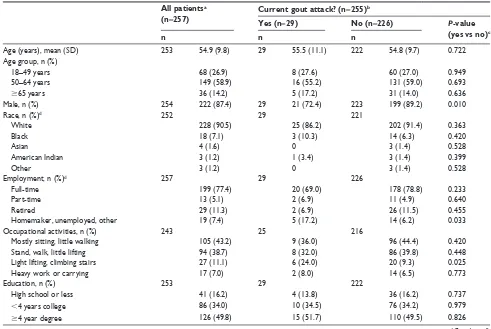
Patient characteristics
Mean (SD) age was 54.9 (9.8) years and 87.4% of patients were men (Table 2). At the time of the survey, 29 patients (11.4%) were experiencing a gout attack, and 56.4% (145/257) of patients reported that they were taking con-comitant gout medication (a non-ULT) to prevent gout flares/attacks. Only seven patients (3.2%) were classified as new users. Comparing patients with a gout attack to patients without a gout attack, patients with an attack had a lesser
+HDOWKSODQHQUROOHHVZLWK FODLPIRUIHEX[RVWDWEHWZHHQ $SULODQG-XO\
1
,QYLWDWLRQVPDLOHG 1
•1RUHVSRQVHQ
•8QGHOLYHUDEOHPDLOQ
•5HIXVDOWRSDUWLFLSDWHQ
•&RQVHQWIRUPQRWVLJQHGQ
•,QHOLJLEOHQ
6XUYH\UHVSRQVHH[FOXVLRQV
•\HDUVRQ-DQXDU\
Q
•1RXVDEOHSDWLHQWKHDOWK
LQIRUPDWLRQQ
•1RWFXUUHQWO\HQUROOHGLQKHDOWK
SODQQ
•1RYDOLGSURYLGHUDQGRUSDWLHQW
LQIRUPDWLRQQ ([FOXVLRQV
$
Figure 1 (Continued)
Patient Preference and Adherence downloaded from https://www.dovepress.com/ by 118.70.13.36 on 26-Aug-2020
Dovepress health-related quality of life in gout disease
Eligible patients N=281
Taking only febuxostat when they completed the survey? Yes
Cohort for the primary analysis set
N=257
Prior use of other ULT?
Other ULT use after discontinuation?
Other ULT use after discontinuation?
Prior use of other ULT? Prior use of other ULT?
Yes
N=139 N=11Yes
Yes
N=5 N=6No N=4Yes N=6No
Yes N=2 No
N=118 N=10No N=1No
No Discontinued
N=21
No Taking febuxostat
and other ULT N=3
B
Figure 1 Sample identification and survey response (A) and study participants (B).
Notes: *no longer enrolled (1), no gout (5), cancer in past year (9), never taken febuxostat (2) language barrier (1), deceased (2). Abbreviation: UlT, urate-lowering therapy.
Table 2 Patient characteristics for all patients and by gout attack status All patientsa
(n=257) Current gout attack? (n=255)
b
Yes (n=29) No (n=226) P-value
(yes vs no)c
n n n
Age (years), mean (sD) 253 54.9 (9.8) 29 55.5 (11.1) 222 54.8 (9.7) 0.722
Age group, n (%)
18–49 years 68 (26.9) 8 (27.6) 60 (27.0) 0.949
50–64 years 149 (58.9) 16 (55.2) 131 (59.0) 0.693
$65 years 36 (14.2) 5 (17.2) 31 (14.0) 0.636
Male, n (%) 254 222 (87.4) 29 21 (72.4) 223 199 (89.2) 0.010
race, n (%)d 252 29 221
White 228 (90.5) 25 (86.2) 202 (91.4) 0.363
Black 18 (7.1) 3 (10.3) 14 (6.3) 0.420
Asian 4 (1.6) 0 3 (1.4) 0.528
American indian 3 (1.2) 1 (3.4) 3 (1.4) 0.399
Other 3 (1.2) 0 3 (1.4) 0.528
employment, n (%)d 257 29 226
Full-time 199 (77.4) 20 (69.0) 178 (78.8) 0.233
Part-time 13 (5.1) 2 (6.9) 11 (4.9) 0.640
retired 29 (11.3) 2 (6.9) 26 (11.5) 0.455
homemaker, unemployed, other 19 (7.4) 5 (17.2) 14 (6.2) 0.033
Occupational activities, n (%) 243 25 216
Mostly sitting, little walking 105 (43.2) 9 (36.0) 96 (44.4) 0.420
stand, walk, little lifting 94 (38.7) 8 (32.0) 86 (39.8) 0.448
light lifting, climbing stairs 27 (11.1) 6 (24.0) 20 (9.3) 0.025
heavy work or carrying 17 (7.0) 2 (8.0) 14 (6.5) 0.773
education, n (%) 253 29 222
high school or less 41 (16.2) 4 (13.8) 36 (16.2) 0.737
,4 years college 86 (34.0) 10 (34.5) 76 (34.2) 0.979
$4 year degree 126 (49.8) 15 (51.7) 110 (49.5) 0.826
(Continued)
Patient Preference and Adherence downloaded from https://www.dovepress.com/ by 118.70.13.36 on 26-Aug-2020
Dovepress
Khanna et al
Table 2 (Continued)
All patientsa
(n=257)
Current gout attack? (n=255)b
Yes (n=29) No (n=226) P-value
(yes vs no)c
n n n
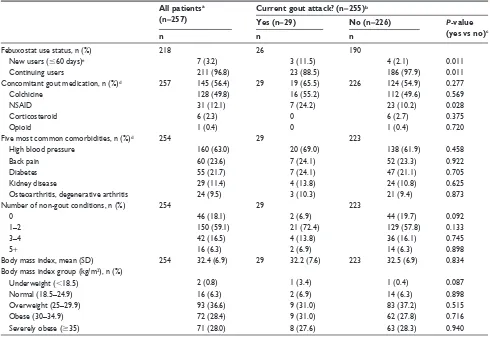
Febuxostat use status, n (%) 218 26 190
new users (#60 days)e 7 (3.2) 3 (11.5) 4 (2.1) 0.011
continuing users 211 (96.8) 23 (88.5) 186 (97.9) 0.011
concomitant gout medication, n (%)d 257 145 (56.4) 29 19 (65.5) 226 124 (54.9) 0.277
colchicine 128 (49.8) 16 (55.2) 112 (49.6) 0.569
nsAiD 31 (12.1) 7 (24.2) 23 (10.2) 0.028
corticosteroid 6 (2.3) 0 6 (2.7) 0.375
Opioid 1 (0.4) 0 1 (0.4) 0.720
Five most common comorbidities, n (%)d 254 29 223
high blood pressure 160 (63.0) 20 (69.0) 138 (61.9) 0.458
Back pain 60 (23.6) 7 (24.1) 52 (23.3) 0.922
Diabetes 55 (21.7) 7 (24.1) 47 (21.1) 0.705
Kidney disease 29 (11.4) 4 (13.8) 24 (10.8) 0.625
Osteoarthritis, degenerative arthritis 24 (9.5) 3 (10.3) 21 (9.4) 0.873
number of non-gout conditions, n (%) 254 29 223
0 46 (18.1) 2 (6.9) 44 (19.7) 0.092
1–2 150 (59.1) 21 (72.4) 129 (57.8) 0.133
3–4 42 (16.5) 4 (13.8) 36 (16.1) 0.745
5+ 16 (6.3) 2 (6.9) 14 (6.3) 0.898
Body mass index, mean (sD) 254 32.4 (6.9) 29 32.2 (7.6) 223 32.5 (6.9) 0.834
Body mass index group (kg/m2), n (%)
Underweight (,18.5) 2 (0.8) 1 (3.4) 1 (0.4) 0.087
normal (18.5–24.9) 16 (6.3) 2 (6.9) 14 (6.3) 0.898
Overweight (25–29.9) 93 (36.6) 9 (31.0) 83 (37.2) 0.515
Obese (30–34.9) 72 (28.4) 9 (31.0) 62 (27.8) 0.716
severely obese ($35) 71 (28.0) 8 (27.6) 63 (28.3) 0.940
Notes: an,257 for some characteristics due to missing values on survey; bOf the 257 patients, 255 had data for current gout attack; cDifference between gout attack and no
gout attack assessed by two-sample t-test for continuous variables and chi-square test for categorical variables; dPatients could report more than category; and ePrescription
for febuxostat #60 days before survey completion.
Abbreviations: SD, standard deviation; NSAID, non-steroidal anti-inflammatory drug.
proportion of males (72.4% vs 89.2%), were a homemaker, unemployed, or other (17.2% vs 6.2%), had an occupational action of lifting or climbing stairs often (24.0% vs 9.3%), were new users (11.5% vs 2.1%), and were taking con-comitant non-steroidal anti-inflammatory drugs (24.1% vs 10.2%) (Table 2).
Treatment patterns
Mean (SD) and median daily doses were 54.5 mg (19.3 mg) and 40 mg, respectively. Mean time between initiating febuxostat and completing the survey was 499 days (range: 6–1,345 days). Of the 21 patients who had discontinued febuxostat at the time of the survey, nine switched to a new ULT: allopurinol (seven patients), probenecid (one patient), and unknown ULT (one patient) (data not shown). Multiple reasons for discontinuation could be provided and these included cost (eight patients), side effects (five patients), symptom resolution (four patients), and ineffective medica-tion (four patients).
Treatment satisfaction
Mean TSQM scores ranged from 75.4 (effectiveness) to 94.7 (side effects) with higher scores indicating bet-ter satisfaction (Table 3). Compared with patients with no current attack, patients with current attack had worse mean scores for all domains except convenience, with mean differences of −20.6 for effectiveness, −10.6 for side effects, −12.1 for global satisfaction (all P,0.05), and −6.1 for convenience (NS).
In the multivariate analysis of patient characteristics associated with TSQM domain scores, patients without gout attack had higher global satisfaction, effectiveness, and side effect scores than patients with gout attack. Global satisfaction scores were higher for patients with less bodily pain on the SF-12 than patients with average bodily pain. Older patients were more likely to have the best possible side effect of score (100). Pairwise correlations among inde pendent variables revealed only very weak/weak relationships.
Patient Preference and Adherence downloaded from https://www.dovepress.com/ by 118.70.13.36 on 26-Aug-2020
Dovepress health-related quality of life in gout disease
Table 3 Mean TsQM, gis, and sF-12 scores for all patients and by gout attack status All patients
(n=255)a
Current gout attack? (n=255)a
Yes (n=29) No (n=226) Difference:
attack vs no attack
P-value (yes vs no)b
Mean (SD) Mean (SD) Mean (SD) Mean (95% CI)
TsQM vii domain scores: 0–100c
effectiveness 75.4 (26.1) 57.2 (26.0) 77.7 (25.2) −20.6 (−30.4, −10.7) ,0.001
side effects 94.7 (14.1) 85.3 (26.3) 95.9 (11.1) −10.6 (−20.7, −0.5) 0.041
convenience 83.4 (15.8) 78.0 (19.8) 84.1 (15.2) −6.1 (−13.9, 1.7) 0.121
global satisfaction 80.0 (19.4) 69.3 (21.0) 81.4 (18.8) −12.1 (−19.5, −4.7) 0.001
gout impact scale: 0–100d
gout overall concern 47.1 (29.5) 74.1 (29.9) 43.7 (27.6) 30.5 (19.6, 41.3) ,0.001
gout medication side effects 43.6 (23.7) 56.5 (26.4) 41.9 (22.9) 14.6 (5.5, 23.6) 0.002
Unmet gout treatment needs 28.2 (21.4) 48.3 (26.2) 25.6 (19.3) 22.7 (12.4, 32.9) ,0.001
gout concern during attack 47.2 (24.2) 57.4 (27.0) 45.9 (23.5) 11.5 (2.2, 20.8) 0.016
Well-being during attack 54.7 (25.0) 61.7 (26.2) 53.8 (24.8) 7.9 (−1.8, 17.6) 0.110
sF-12 scorese
Physical component summary 49.4 (9.5) 43.5 (10.2) 50.1 (9.1) −6.6 (−10.2, −3.0) ,0.001
Mental component summary 52.9 (7.9) 50.3 (9.9) 53.2 (7.5) −2.9 (−6.8, 1.0) 0.137
Notes: aOf the 257 patients, 255 had data for current gout attack; bDifference between gout attack and no gout attack assessed by two-sample t-test; chigher scores
indicate better satisfaction; dhigher scores indicate worse condition or greater gout impairment; and eT scores between 47 and 53 are within average range; those less than
47 indicate impaired functioning. The lowest and highest possible T scores, respectively, are: physical component summary, 11.07 and 71.78; mental component summary,
11.29 and 68.15.32
Abbreviations: CI, confidence interval; SD, standard deviation; TSQM vII, Treatment Satisfaction Questionnaire for Medication version II; GIS, Gout Impact Scale; SF-12,
sF-12v2® health survey.
health-related quality of life
Mean GIS summary scores ranged from 28.2 (unmet gout treatment needs) to 54.7 (well-being during attack) with higher scores indicating worse condition/impairment or greater gout impact (Table 3). Patients with a current gout attack had significantly higher (ie, worse) mean scores than patients without a current gout attack on all scales except well-being during attack. Differences in mean scores between current and no current attack were: 30.5, gout overall concern; 14.6, gout medication side effects; 22.7, unmet gout treat-ment needs; 11.5, gout concern during attack (all P,0.05); and 7.9, well-being during attack. Mean SF-12 scores for all patients (n=255) were 49.4 for the PCS and 52.9 for the MCS (Table 3). Patients with a current gout attack had lower mean scores on the PCS (−6.6, P,0.001) and MCS (−2.9) but the difference in MCS score was not significant.
correlations among instruments
There were weak to moderate correlations between scores on different instruments scales and moderate to relatively strong correlations between certain scale scores within the same instrument (Table 4). These included moderate correlations between GIS gout medication side effect and TSQM side effects (−0.46), the GIS unmet gout treatment needs and TSQM effectiveness (−0.40), and the GIS unmet gout treatment needs and TSQM global satisfaction (−0.50).
Correlations between the TSQM and SF-12 scales and between the GIS and SF-12 scales were all very weak or weak. Correlations between TSQM global satisfaction and both effectiveness and convenience were relatively strong (0.67 and 0.76). GIS gout overall concern and all other GIS scales (except well-being during attack, 0.26) were moder-ately correlated (0.52–0.59), as were GIS gout concern during attack and gout medication side effects (0.53). The correla-tion between GIS gout concern during attack and well-being during attack was relatively strong (0.61).
Discussion
To our knowledge, this is the first study in gout patients to assess treatment satisfaction with the TSQM and to compare the TSQM with the GIS. Both instruments were effective in discriminating the effect of gout attack status with significantly worse scores on three of four TSQM scales and four of five GIS scales for patients currently experiencing a gout attack compared with patients who were not experiencing a gout attack. Similarly, the patient characteristic most predictive of lower treatment satisfaction was the presence of a current gout attack. There were several moderate correlations between GIS and TSQM scales that supported the relationship between gout treatment satisfaction and gout-related quality of life.
Gout-specific HRQoL as measured by the GIS showed that patients did have some concern about their overall gout,
Patient Preference and Adherence downloaded from https://www.dovepress.com/ by 118.70.13.36 on 26-Aug-2020
Dovepress
Khanna et al
Table 4
Pearson correlation results for T
sQM, gis , and sF-12 TSQM vII GIS Effectiveness
Side effects
Convenience
Global satisfaction Gout overall concern
Gout
medication
side effects
Unmet gout treatment needs Gout concern during attack Well-being during attack
T sQM vii effectiveness 1.00 side effects 0.16 1.00 c onvenience 0.49 0.30 1.00 g lobal satisfaction 0.67 0.35 0.76 1.00 gis g
out overall concern
− 0.34 − 0.22 − 0.29 − 0.38 1.00 g
out medication side effects
− 0.25 − 0.46 − 0.35 − 0.44 0.59 1.00
Unmet gout treatment need
− 0.40 − 0.20 − 0.39 − 0.50 0.52 0.34 1.00 g
out concern during attack
− 0.06 − 0.25 − 0.17 − 0.15 0.54 0.53 0.28 1.00
Well-being during attack
0.09 − 0.23 0.02 0.02 0.26 0.34 0.11 0.61 1.00 sF-12 Physical functioning 0.15 0.13 0.10 0.11 − 0.23 − 0.09 − 0.12 − 0.15 − 0.09 r ole physical 0.13 0.26 0.11 0.16 − 0.25 − 0.17 − 0.20 − 0.18 − 0.19 Bodily pain 0.12 0.12 0.06 0.10 − 0.24 − 0.14 − 0.17 − 0.16 − 0.17 g eneral health 0.00 0.22 0.01 0.03 − 0.13 − 0.07 − 0.03 − 0.16 − 0.11 Vitality 0.11 0.15 0.13 0.17 − 0.30 − 0.23 − 0.26 − 0.22 − 0.20 social functioning 0.16 0.22 0.14 0.19 − 0.26 − 0.22 − 0.22 − 0.28 − 0.20 r ole emotional 0.09 0.35 0.12 0.20 − 0.22 − 0.33 − 0.05 − 0.27 − 0.26 Mental health 0.12 0.16 0.15 0.22 − 0.29 − 0.30 − 0.20 − 0.32 − 0.25 Pcs 0.12 0.16 0.06 0.08 − 0.21 − 0.06 − 0.16 − 0.12 − 0.10 M cs 0.10 0.27 0.16 0.24 − 0.28 − 0.38 − 0.18 − 0.34 − 0.29 Notes: c olor key: . 0.60; 0.50–0.59; 0.40–0.49; 0.30–0.39. Abbreviations: T sQM v ii, Treatment
satisfaction Questionnaire for Medication version
ii; gis , g out impact scale; sF-12, sF-12v2
® h
ealth
survey; P
cs
, physical component summary; M
cs
, mental component summary.
Patient Preference and Adherence downloaded from https://www.dovepress.com/ by 118.70.13.36 on 26-Aug-2020
Dovepress health-related quality of life in gout disease
gout medication side effects, and concern about gout and well-being during their gout attack. However, patients indicated that their treatment was adequate as shown by lower scores on the unmet gout treatment need score. Mean GIS scores across all patients ranged from 28.2 to 54.7 and were lower (indicat-ing less gout impairment) than mean GIS scores observed by Hirsch et al with mean differences of 1.1 (well-being during attack) to 16.0 points (gout concern overall).35 Our study was specific to ULT medication for gout prevention and all respondents were required to have a febuxostat prescription; 7.4% of patients in the earlier study were not taking any gout medication and, of the 92.6% of patients who were on therapy, the medication could have been for acute treatment of gout flares and/or gout prevention. Patients in the earlier study were also older on average than our patients (62.2 vs 54.9 years). However, both studies found a trend toward worsening GIS scores (except for well-being during attack) with increasing attack frequency35 or current attack status (our study). The estimated minimally important differences for the GIS scales range from 5.2 to 7.6 points,36 and we observed worse scores for patients currently experiencing a gout attack vs those not experiencing an attack with mean differences ranging from 7.9 to 30.5 points. These results, coupled with recent studies of the GIS,35,36 support its feasibility (patients were able to complete the GIS themselves) and validity (correlations with other instruments and differences between current gout attack and no current gout attack) for assessing HRQoL in gout.
Generic HRQoL scores as measured by the SF-12 were within the average range of the normative US sample (47–53): mean T scores were 49.4 for the PCS and 52.9 for the MCS. Our mean scores are higher than previously reported SF-36 scores for gout patients on the PCS (37.9) and MCS (48.5), with the largest mean difference evident in PCS scores.5 However, only approximately two-thirds of patients in the earlier study reported taking any current gout medication (allopurinol and/or colchicine) and they were older on average than our patients (62.2 years vs 54.9 years), which likely contributed to lower scores. Almost all patients (98.7%) in our study were continuous users of febuxostat, having taken it on average for 499 days. Our PCS and MCS results are consistent with a study that examined mean SF-36 scores of patients closer in age (57.1 years) to our patients and who had been taking ULT therapy for 1 year (mean PCS, 48.5; mean MCS, 54.2).37 The PCS and MCS were able to discriminate patients with gout attack vs no attack with mean differences on the PCS (−6.6) and MCS (−2.9) that are at or above the clinically meaningful difference of 3 points.32 The impact of gout attack was most pronounced for the PCS
which is consistent with a previous study which observed larger decrements in the PCS than the MCS with increasing frequency of gout flares.38 Only weak correlations were found between the SF-12 and the TSQM and GIS.
The TSQM discriminated gout attack status, with patients who were currently experiencing a gout attack register-ing significantly lower mean scores on all scales except convenience. Differences in convenience scores by gout attack status would not be expected since the indication for febuxostat is once daily dosing, regardless of attack status. The findings that patients experiencing an attack scored higher on medication side effects could imply that patients thought that an attack could be a side effect of medication or that patients with side effects are more likely to stop their medication and therefore experience an attack. There were several moderate correlations between the TSQM and GIS scales, supporting the relationship between treatment sat-isfaction and HRQoL. The moderate correlations between the GIS unmet gout treatment needs and TSQM global sat-isfaction (−0.50) and effectiveness (−0.40) scales suggest that both measures captured the degree to which patients believed that their medication was beneficial for their gout treatment. The correlation between the side effect scales of the GIS and TSQM was also moderate (−0.46), indicating consistent findings from both instruments.
Patient-reported outcomes are an important consideration in the clinical management of patients with gout. While clinical assessment will be the basis for diagnosis, patient-reported out-comes provide important inputs for understanding satisfaction with treatment and the impact of gout on daily living, and for tracking response to treatment. Measuring treatment satisfaction is also a solid first step in shared decision-making to promote better adherence to therapy and, ultimately, improved clinical and quality-of-life outcomes. The TSQM has eleven items vs the 24-item GIS and may offer greater convenience in busy clinical practice settings. However, the GIS captures additional information on gout concern overall and status during a gout attack, both important considerations for disease management. Nevertheless, additional research is needed to support routine adoption of these measures in clinical practice. The minimally important difference for the TSQM scales needs to be deter-mined and Outcome Measures in Rheumatology (OMERACT) has not endorsed two scales of the GIS: gout concern overall and unmet gout treatment needs.39 Our results provide further evidence of the performance of these measures in a real-world setting to advance future research and, coupled with previous research,35,36 provide further psychometric properties to support GIS as an appropriate measure.
Patient Preference and Adherence downloaded from https://www.dovepress.com/ by 118.70.13.36 on 26-Aug-2020
Dovepress
Khanna et al
There are several limitations to this study which should be considered. This was a cross-sectional survey of a con-venience sample of patients and the self-reported results are subject to recall bias. Almost all patients (96.8%) were taking febuxostat for at least 60 days, which may bias the results in favor of patients satisfied with treatment. The study also lacked a formal comparator group of patients taking a ULT other than febuxostat, so satisfaction with febuxostat cannot be compared to another benchmark. Finally, our results are based on commercial health plan enrollees and 82% were employed, so employed individuals are disproportionately represented.
Both the GIS and TSQM were complementary in evaluat-ing the impact of disease and treatment satisfaction in patients treated with febuxostat in both acute and chronic gout. The SF-12 was able to discriminate acute attack vs not, but only weakly associated with treatment satisfaction and disease-specific HRQOL. Current gout attack was the strongest pre-dictor of patient satisfaction. Correlations between GIS and TSQM scales supported the relationship between treatment satisfaction and gout-specific quality of life.
Acknowledgments
The authors would like to thank Sarah Peirce-Sandner (Optum, Eden Prairie, MN, USA), who provided medical writing sup-port and was funded by Takeda Pharmaceuticals International. The authors would also like to thank the individuals at Optum who were involved in the study at various stages: Margaret Good, Yvette Grenier, Fang Liu, Jeffrey McPheeters, Angela Watkins, Julia Xeroteres, and Bryan Zachau.
Disclosure
PP Khanna has served as a consultant to Takeda Pharma-ceuticals International, Inc. A Shiozawa is an employee of Takeda Pharmaceuticals International, Inc., febuxostat is a product of Takeda. V Walker, T Bancroft, and B Essoi are employees of OptumInsight who were paid consultants to Takeda Pharmaceuticals International, Inc. in connection with this study. D Khanna has served as a consultant to AstraZeneca and Takeda Pharmaceuticals International, Inc. KS Akhras was employed by Takeda Pharmaceuticals International, Inc. at the time the research was conducted.
References
1. Tausche AK, Jansen TL, Schroder HE, Bornstein SR, Aringer M, Muller-Ladner U. Gout – current diagnosis and treatment. Dtsch Arztebl Int. 2009;106(34–35):549–555.
2. Terkeltaub R. Update on gout: new therapeutic strategies and options.
Nat Rev Rheumatol. 2010;6(1):30–38.
3. Neogi T. Clinical practice. Gout. N Engl J Med. 2011;364(5):443–452.
4. Becker MA, Schumacher HR, Benjamin KL, et al. Quality of life and dis-ability in patients with treatment-failure gout. J Rheumatol. 2009;36(5): 1041–1048.
5. Lee SJ, Hirsch JD, Terkeltaub R, et al. Perceptions of disease and health-related quality of life among patients with gout. Rheumatology
(Oxford). 2009;48(5):582–586.
6. Roddy E, Zhang W, Doherty M. Is gout associated with reduced qual-ity of life? A case-control study. Rheumatology (Oxford). 2007;46(9): 1441–1444.
7. Chandratre P, Roddy E, Clarson L, Richardson J, Hider SL, Mallen CD. Health-related quality of life in gout: a systematic review. Rheumatology
(Oxford). 2013;52(11):2031–2040.
8. Wu EQ, Forsythe A, Guerin A, Yu AP, Latremouille-Viau D, Tsaneva M. Comorbidity burden, healthcare resource utilization, and costs in chronic gout patients refractory to conventional urate-lowering therapy. Am J
Ther. 2012;19(6):e157–e166.
9. Wu EQ, Patel PA, Yu AP, et al. Disease-related and all-cause health care costs of elderly patients with gout. J Manag Care Pharm. 2008;14(2): 164–175.
10. Zhu Y, Pandya BJ, Choi HK. Prevalence of gout and hyperuricemia in the US general population: the National Health and Nutrition Examina-tion Survey 2007–2008. Arthritis Rheum. 2011;63(10):3136–3141. 11. Hamburger M, Baraf HS, Adamson TC 3rd, et al. 2011
Recommenda-tions for the diagnosis and management of gout and hyperuricemia.
Postgrad Med. 2011;123(6 Suppl 1):3–36.
12. Khanna D, Khanna PP, Fitzgerald JD, et al. 2012 American College of Rheumatology guidelines for management of gout. Part 2: therapy and antiinflammatory prophylaxis of acute gouty arthritis. Arthritis Care
Res (Hoboken). 2012;64(10):1447–1461.
13. Khanna D, Fitzgerald JD, Khanna PP, et al. 2012 American College of Rheumatology guidelines for management of gout. Part 1: system-atic nonpharmacologic and pharmacologic therapeutic approaches to hyperuricemia. Arthritis Care Res (Hoboken). 2012;64(10): 1431–1446.
14. Harrold LR, Andrade SE, Briesacher B, et al. The dynamics of chronic gout treatment: medication gaps and return to therapy. Am J Med. 2010; 123(1):54–59.
15. Harrold LR, Andrade SE, Briesacher BA, et al. Adherence with urate-lowering therapies for the treatment of gout. Arthritis Res Ther. 2009; 11(2):R46.
16. Riedel AA, Nelson M, Joseph-Ridge N, Wallace K, MacDonald P, Becker M. Compliance with allopurinol therapy among managed care enrollees with gout: a retrospective analysis of administrative claims.
J Rheumatol. 2004;31(8):1575–1581.
17. Solomon DH, Avorn J, Levin R, Brookhart MA. Uric acid lowering therapy: prescribing patterns in a large cohort of older adults. Ann
Rheum Dis. 2008;67(5):609–613.
18. Barbosa CD, Balp MM, Kulich K, Germain N, Rofail D. A literature review to explore the link between treatment satisfaction and adher-ence, compliance, and persistence. Patient Prefer Adherence. 2012;6: 39–48.
19. Delestras S, Roustit M, Bedouch P, et al. Comparison between two generic questionnaires to assess satisfaction with medication in chronic diseases. PLoS One. 2013;8(2):e56247.
20. Biderman A, Noff E, Harris SB, Friedman N, Levy A. Treatment sat-isfaction of diabetic patients: what are the contributing factors? Fam
Pract. 2009;26(2):102–108.
21. Nett RB, Tiseo PJ, Almas M, Sikes CR. Patient satisfaction with eletriptan in the acute treatment of migraine in primary care. Int J Clin
Pract. 2007;61(10):1677–1685.
22. American Medical Association. Getting the most for our health care dollars. Available from: http://www.ama-assn.org/resources/doc/ health-care-costs/prevention-and-wellness.pdf. Accessed September 11, 2013.
23. Hirsch JD, Lee SJ, Terkeltaub R, et al. Evaluation of an instrument assessing influence of Gout on health-related quality of life. J
Rheu-matol. 2008;35(12):2406–2414.
Patient Preference and Adherence downloaded from https://www.dovepress.com/ by 118.70.13.36 on 26-Aug-2020
Patient Preference and Adherence
Publish your work in this journal
Submit your manuscript here: http://www.dovepress.com/patient-preference-and-adherence-journal
Patient Preference and Adherence is an international, peer-reviewed, open access journal that focuses on the growing importance of patient preference and adherence throughout the therapeutic continuum. Patient satisfaction, acceptability, quality of life, compliance, persistence and their role in developing new therapeutic modalities and compounds to optimize
clinical outcomes for existing disease states are major areas of interest for the journal. This journal has been accepted for indexing on PubMed Central. The manuscript management system is completely online and includes a very quick and fair peer-review system, which is all easy to use. Visit http://www. dovepress.com/testimonials.php to read real quotes from published authors.
Dovepress
Dove
press
health-related quality of life in gout disease
24. Spaetgens B, van der Linden S, Boonen A. The Gout Assessment Questionnaire 2.0: cross-cultural translation into Dutch, aspects of validity and linking to the International Classification of Function-ing, Disability and Health. Rheumatology (Oxford). 2014;53(4): 678–685.
25. Atkinson MJ, Sinha A, Hass SL, et al. Validation of a general measure of treatment satisfaction, the Treatment Satisfaction Questionnaire for Medication (TSQM), using a national panel study of chronic disease.
Health Qual Life Outcomes. 2004;2:12.
26. Jobanputra P, Maggs F, Deeming A, et al. A randomised efficacy and dis-continuation study of etanercept versus adalimumab (RED SEA) for rheu-matoid arthritis: a pragmatic, unblinded, non-inferiority study of first TNF inhibitor use: outcomes over 2 years. BMJ Open. 2012;2(6):e001395. 27. Lin HY, Cheng TT, Wang JH, et al. Etoricoxib improves pain,
func-tion and quality of life: results of a real-world effectiveness trial. Int J
Rheum Dis. 2010;13(2):144–150.
28. Takeda Pharmaceuticals America I. Uloric (febuxostat). Prescribing information. 2013. Available from: http://www.uloric.com/. Accessed September 17, 2013.
29. Census Regions and Divisions of the United States. US Census Bureau. http://www2.census.gov/geo/pdfs/maps-data/maps/reference/us_reg-div.pdf. Accessed May 22, 2015.
30. Atkinson MJ, Kumar R, Cappelleri JC, Hass SL. Hierarchical construct validity of the Treatment Satisfaction Questionnaire for Medication (TSQM version II) among outpatient pharmacy consumers. Value
Health. 2005;8(Suppl 1):S9–S24.
31. Colwell HH, Hunt BJ, Pasta DJ, Palo WA, Mathias SD, Joseph-Ridge N. Gout Assessment Questionnaire: initial results of reliability, validity and responsiveness. Int J Clin Pract. 2006;60(10):1210–1217.
32. Maruish ME, editor. User’s Manual for the SF-12v2 Health Survey. 3rd ed. Lincoln (RI): QualityMetric Inc.; 2012.
33. Ware J Jr, Kosinski M, Keller SD. A 12-Item Short-Form Health Survey: construction of scales and preliminary tests of reliability and validity.
Med Care. 1996;34(3):220–233.
34. BMJ. Correlation and regression. Available from: http://www.bmj. com/about-bmj/resources-readers/publications/statistics-square-one/11-correlation-and-regression. Accessed December 6, 2013.
35. Hirsch JD, Terkeltaub R, Khanna D, et al. Gout disease-specific qual-ity of life and the association with gout characteristics. Patient Relat
Outcome Meas. 2010;2010:1–8.
36. Khanna D, Sarkin AJ, Khanna PP, et al. Minimally important differences of the Gout Impact Scale in a randomized controlled trial. Rheumatology
(Oxford). 2011;50(7):1331–1336.
37. Khanna PP, Perez-Ruiz F, Maranian P, Khanna D. Long-term therapy for chronic gout results in clinically important improvements in the health-related quality of life: short form-36 is responsive to change in chronic gout. Rheumatology (Oxford). 2011;50(4):740–745. 38. Khanna PP, Nuki G, Bardin T, et al. Tophi and frequent gout flares
are associated with impairments to quality of life, productivity, and increased healthcare resource use: results from a cross-sectional survey.
Health Qual Life Outcomes. 2012;10:117.
39. Singh JA, Taylor WJ, Simon LS, et al. Patient-reported outcomes in chronic gout: a report from OMERACT 10. J Rheumatol. 2011;38(7): 1452–1457.
Patient Preference and Adherence downloaded from https://www.dovepress.com/ by 118.70.13.36 on 26-Aug-2020