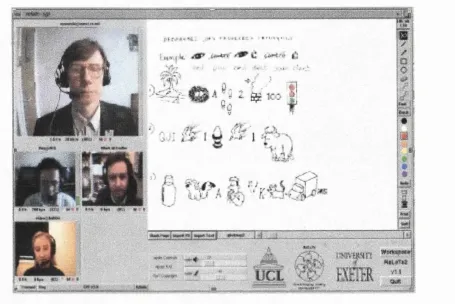
Assessing the Quality of Audio and Video
Components in Desktop Multimedia Conferencing
Anna Watson
A dissertation submitted in partial fulfilment o f the requirements for the degree o f
Doctor o f Philosophy o f the
University o f London
Department o f Computer Science University College London
ProQuest Number: U644155
All rights reserved
INFORMATION TO ALL USERS
The quality of this reproduction is dependent upon the quality of the copy submitted.
In the unlikely event that the author did not send a complete manuscript and there are missing pages, these will be noted. Also, if material had to be removed,
a note will indicate the deletion.
uest.
ProQuest U644155
Published by ProQuest LLC(2016). Copyright of the Dissertation is held by the Author.
All rights reserved.
This work is protected against unauthorized copying under Title 17, United States Code. Microform Edition © ProQuest LLC.
ProQuest LLC
789 East Eisenhower Parkway P.O. Box 1346
A cknowledgements
I would like first to acknowledge the help and guidance of my supervisor Angela Sasse, who has
inspired and encouraged me throughout the period of this research. Her enthusiasm, generosity and
friendship are much appreciated. Thanks are also due to Philip Arden, my supervisor at BT Labs,
Vicky Hardman, second supervisor at UCL, and Andrew Monk at the University of York for
willing assistance and feedback.
I am indebted to many UCL colleagues for invaluable contributions to the studies documented in
this thesis. Particular thanks go to Ismail Ismail for speaking proper, Orion Hodson for much and
patient technical assistance, Colin Perkins for always being there to answer questions, and Yael
Shmueli. Co-experimenters and friends Anne Adams, Anna Bouch, Sacha Brostoff, Julian
Chesterfield, Jane Hughes, Isidor Kouvelas, Louise Sheeran and Gillian Wilson also deserve credit
and thank yous.
I’d like to acknowledge the staff and students of the Language Centres at UCL and Exeter
University, without whom there could have been no ReLaTe project; David Heamshaw at
Westminster University for allowing me to gather data from his willing and enthusiastic students;
Daniel Pilon, formerly at CRC in Ottowa; and colleagues on the ETNA project at Glasgow
University, in particular Rachel McEwan.
Thanks to family and friends, near and far, who have helped probably more than they realise,
especially Judith Watson, Conor Watson, Nicola Mitchell, Laura Pettigrew and the 4-Pack.
Lastly, but definitely not leastly, thank you to my parents, who never really understood what I was
Abstract
This thesis seeks to address the HCI (Human-Computer Interaction) research problem of how to
establish the level of audio and video quality that end users require to successfully perform tasks via
networked desktop videoconferencing.
There are currently no established HCI methods of assessing the perceived quality of audio and
video delivered in desktop videoconferencing. The transport of real-time speech and video
information across new digital networks causes novel and different degradations, problems and
issues to those common in the traditional telecommunications areas (telephone and television).
Traditional assessment methods involve the use of very short test samples, are traditionally
conducted outside a task-based environment, and focus on whether a degradation is noticed or not.
But these methods cannot help establish what audio-visual quality is required by users to perform
tasks successfully with the minimum of user cost, in interactive conferencing environments.
This thesis addresses this research gap by investigating and developing a battery of assessment
methods for networked videoconferencing, suitable for use in both field trials and laboratory-based
studies. The development and use of these new methods helps identify the most critical variables
(and levels of these variables) that affect perceived quality, and means by which network designers
and HCI practitioners can address these problems are suggested. The output of the thesis therefore
contributes both methodological (i.e. new rating scales and data-gathering methods) and substantive
(i.e. explicit knowledge about quality requirements for certain tasks) knowledge to the HCI and
networking research communities on the subjective quality requirements of real-time interaction in
networked videoconferencing environments.
Exploratory research is carried out through an interleaved series of field trials and controlled
studies, advancing substantive and methodological knowledge in an incremental fashion. Initial
studies use the ITU-recommended assessment methods, but these are found to be unsuitable for
assessing networked speech and video quality for a number of reasons. Therefore later studies
investigate and establish a novel polar rating scale, which can be used both as a static rating scale
and as a dynamic continuous slider. These and further developments of the methods in future lab-
based and real conferencing environments will enable subjective quality requirements and
Table of Contents
ACKNOWLEDGEMENTS... 2
ABSTRACT...3
TABLE OF CONTENTS... 4
LIST OF FIGURES...13
LIST OF TABLES...15
LIST OF ABBREVIATIONS AND ACRONYMS... 16
CHAPTER 1: INTRODUCTION...18
1.1 Desktopconferencingo v erth e In t e r n e t...18
1.2 Descriptionoftheresearchp r o b l e m...19
1.3 Theresearch a p p r o a c h... 20
1.4 Scopeo fthet h e s is... 21
1.5 Co n tr ibutio n softhet h e s is...22
1.6 Overview ofthet h e s is... 23
CHAPTER 2: THE RESEARCH CONTEXT... 26
2.1 Wh a tIS H C I?... 26
2.1.1 Views o f HCI...2 7 2.1.1.1 HCI as a scien ce...27
2.1.1.2 HCI as a design s c ie n c e ... 28
2.1.1.3 HCI as an engineering d isc ip lin e... ^... 28
2.1.1.4 C onclusions...29
2.1.2 HCI evaluation...30
2.1.2.1 Evaluation conducted in this th esis... 31
2.1.3 The MMC research context...32
2.1.3.1 Evaluating MMC experiences...33
2.2 Som etechnolog y DEFINITIONS... 34
2.3 Ch aracteristicso fdigitaln etw o rk ssuppo rtingm ultim ediaa p pl ic a t io n s 34 2.3.1 Bit rate...;...35
2.3.2 Delay...35
2.4 Inte rn et Protocoln e t w o r k s...36
2.4.1 The Multicast backbone (Mbone)...36
2.4.2 Mbone packet lo ss...37
2.4.3 Multicast multimedia conferencing...38
2.5 Au d io...39
2.5.1 Bandwidth vs. compression, vs. processing power, V5. perception...39
2.5.2 RAT {Robust Audio Tool)...40
2.5.2.1 E n cod in g... 41
2.5.2.2 Packet s iz e s ... 41
2.5.2.3 Silence suppression... 42
2.5.2.4 Full/half d up lex... 42
2.5.2.5 Repair m eth o d s... 42
2.5.2.6 Reception statistics... 44
2.6 Vid e o... 45
2.6.1 H.261 video coding...45
2.6.2 vie (VldeoConferencing Tool)...46
2.6.2.1 Receiving video... 46
2.6.2.2 Transmitting... 46
2.6.2.3 Reception statistics... 47
2.7 Sh a r ed WORKSPACE... 47
2.8 Ev a lu a t in g MMC c o m m u n ic a t io n... 48
CHAPTER 3: SPEECH AND VIDEO COMMUNICATION... 51
3.1 AUDIO-VISUAL COMMUNICATION... 51
3.2 Speech a n dh e a r in g... 52
3.2.1 Speech...52
3.2.2 Hearing...55
3.2.3 The impact o f degraded speech on understanding...55
3.2.4 Speech and hearing in M M C...57
3.3 Visu a lc o m m u n ic a t io n... 58
3.3.1 ‘Reading' speech from the fa c e...58
3.3.2 Speech-reading in VMC...59
3.3.3 The impact o f frame rate on speech reading...61
3.3.4 The impact o f frame rate on interactive task performance...62
3.3.5 Speech production...63
3.3.7 Delay...65
3.3.8 Image size and gesture...66
3.4 Video - tou s e, orno ttou s e? ... 67
3.4.1 VMC and tasks...69
3.5 H o w MMC COMMUNICATION DIFFERS... 69
3.6 Su m m a r y...70
CHAPTER 4: MEASURING PERCEPTION OF SPEECH AND VIDEO...71
4.1 Mea sur in gspeech in t e l lig ib ilit y...71
4.1.1 Syllable tests...71
4.1.2 Word tests...72
4.1.3 Sentence tests...72
4.1.4 Passage tests...72
4.1.5 Assessing packet speech intelligibility...73
4.2 Objectivev e r su ssubjectivespeechq uality a sse ssm e n tm e t h o d s... 75
4.3 Subjectivem e a su r em en tm e t h o d s... 75
4.4 Speechq u alitys c a l e s... 76
4.4.1 Other speech quality tests...77
4.4.2 Applying the scales to the assessment o f MMC speech...77
4.5 Im a g eq u alitys c a l e s...80
4.5.1 Additional image quality methods...81
4.5.2 Fitting the scales to MMC video...81
4.6 Au d io v isu a lq u alityinm ultim edia s e r v ic e s... 83
4.7 Interim s u m m a r y... 83
4.8 Theneedforaco ntin u o u sr ating s c a l e...84
4.8.1 How SSCQE works...85
4.8.2 Applications o f SSCQE...85
4.9 Beh av io ur a ltraitsofc o n tin u o u se v a l u a t io n... 86
4.9.1 Investigating other potential effects...87
4.9.1.1 Fatigue...87
4.9.1.2 Severity and duration of impairment...87
4.9.1.3 Drift... 88
4.9.1.4 Instructions to subjects when audio is present... 88
4.9.2 Assessing perceived audio quality...89
4.9.3 Discussion...89
4.10.1 Internationally interval, or internationally ordinal?...91
4.10.3 Summary...92
4.11 Whatisq u a lit y?... 92
4.11.1 Speech quality...93
4.11.2 Video quality...93
4.11.3 Speech and video quality in MMC...94
4.12 Chapters u m m a r y... 94
4.13 Researcha g e n d a... 95
4.13.1 Research aims...95
4.13.2 Research methods...95
CHAPTER 5: MODELLING AND CAPTURING INTERNET SPEECH AND VIDEO IN EARLY STUDIES... 98
5.1 T h e RELATE FIELD TRIALS... 98
5.1.1 Overview o f the ReLaTe project...98
5.1.2 Evaluation focus and methods...100
5.1.2.1 Observation...101
5.1.2.2 Questionnaires and rating s c a le s ...101
5.1.2.3 Group discussion w orkshop... 102
5.1.3 Observations and findings from group workshops and questionnaires...102
5.1.3.1 Overall findings...102
5.1.3.2 Audio findings... 103
5.1.3.3 V ideo findings...105
5.1.4 Interpretation o f results...107
5.2 St u d y 1 ; Co m pen sa tingforpa ck etlo ssin In t e r n eta u d io...110
5.2.1 Material...I l l 5.2.2 Subjects...I l l 5.2.3 Procedure... I l l 5.2.4 Results...112
5.2.4.1 Rating scale use...116
5.2.5 Discussion...117
5.3 St u d y 2: In v estig a tingtheintelligibilityoflo ngerspeechstim ul i...118
5.3.1 M aterial...118
5.3.2 Subjects...118
5.3.3 Procedure...118
5.3.5 Discussion...119
5.4 St u d y 3 In v est ig a tingtheperceivedquality ofp a ssag esofsp e e c h... 120
5.4.1 M aterial...120
5.4.2 Subjects...121
5.4.3 Procedure...121
5.4.4 Results...121
5.4.5 Discussion...122
5.5 S t u d y 4: M e a s u r in g t h e q u a l i t y o f a c o n v e r s a t i o n ... 122
5.5.1 M aterial...123
5.5.2 Subjects...123
5.5.3 Procedure...123
5.5.4 Results...123
5.5.5 Discussion...124
5.6 Co m bin edf in d in g s...125
5.7 St u d y 5: Asse ssin gtheperceivedle v elo fa u d io-v id eos y n c h r o n is a t io n... 126
5.7.1 M aterial...127
5.7.2 Subjects...127
5.7.3 Procedure...127
5.7.4 Results...128
5.7.5 Discussion...128
5.8 In te r im SUMMARY... 129
5.9 St u d y 6: Graphicsca lingofq u a lityt e r m s... 129
5.9.1 M aterial...130
5.9.2 Subjects...130
5.9.3 Procedure...130
5.9.4 Results...130
5.9.5 Discussion...131
5.10 Chapterc o n c l u sio n s...133
5.10.1 Substantive results...133
5.10.2 Methodological results...133
CHAPTER 6: INVESTIGATING A POLAR CONTINUOUS QUALITY SCALE... 135
6.1 St u d y 7 : Inv est ig a ting anewqu a litys c a l e...135
6.1.1 Material...135
6.1.2 Subjects...136
6.1.4 Results...136
6.1.5 Discussion...138
6.2 St u d y 8: Dista n celearningco u r seo nnetw orksa n dc o m m u n ic a t io n s...139
6.2.1 Assessment plan...139
6.2.2 Rating scales...140
6.2.3 Group discussions...140
6.2.4 Video rating results...140
6.2.5 Issues arising from the general discussion...141
6.2.6 Summary and critique...143
6.3 Chapterc o n c l u sio n s... 143
6.3.1 Substantive results...143
6.3.2 Methodological results...144
CHAPTER 7: INVESTIGATING REAL-TIME CONTINUOUS QUALITY RATING 145 7.1 St u d y9: In v est ig a tingperceivedquality u sin g Q U A S S ...145
7.1.1 Study overview...146
7.1.2 M aterial...146
7.1.3 Subjects...147
7.1.4 Procedure...147
7.1.5 Results...148
7.1.6 Discussion o f rating study...150
7.2 UsingQUASS inrealw orldc o n f e r e n c e s...151
7.3 I n te r im SUMMARY...152
7.4 St u d y 10: Controllingr eceivedq ualityu sin gQUASS...153
7.4.1 M aterial...154
7.4.1.1 QUASS configuration...154
7.4.1.2 Set-up...155
7.4.1.3 Task... 155
7.4.2 Subjects...156
7.4.3 Procedure...156
7.4.3.1 Instructions to subjects...156
7.4.4 Results...156
7.4.4.1 Analysing the slider data... 157
7.4.4.2 The effect of video...162
7.4.4.3 The effect of the budget... 163
7.4.5 Discussion o f results...167
7.4.5.1 Controlling the conversation and the slider...167
7.4.5.2 The limit to loss tolerance... 167
7.4.5.3 The video non-effect... 168
7.4.5.4 The effective budget... 168
7.4.6 Experimental critique...168
7.5 Ch a p t e rc o n c l u s i o n s... 169
7.5.1 Substantive results...169
7.5.2 Methodological results...170
CHAPTER 8: WHAT COMPONENTS HAVE THE GREATEST IMPACT ON PERCEIVED MMC QUALITY?... 171
8.1 Th e PIPVIC FIELD TRIALS... 171
8.1.1 Issues in evaluating IP-based videoconferences...171
8.1.2 Objective and subjective data collection...172
8.1.2.1 Objective data collection...172
8.1.2.2 Subjective data collection...172
8.1.3 Results...173
8.1.4 Discussion...175
8.2 St u d y 11 : In v e st ig a tin gtheeffectsofotherfactorsonperceivedq u a l it y 175 8.2.1 Rationale fo r conditions chosen...175
8.2.1.1 Codec, packet size and packet loss repair m ethod... 176
8.2.1.2 Packet loss rates...176
8.2.1.3 ‘Bad’ microphone... 176
8.2.1.4 Volume differences... 176
8.2.1.5 E ch o... 177
8.2.2 M aterial...177
8.2.3 Subjects...178
8.2.4 Procedure...178
8.2.5 Results...178
8.2.5.1 Quantitative results... 179
8.2.5.2 Qualitative resu lts...180
8.2.6 Discussion...181
8.3 Furtherv o c a b u l a r yh n d i n g s...182
8.3.1 Findings from the first QUASS study...182
8.3.2 Findings from distance learning course...184
8.3.2.1 Audio results...184
8.3.2.2 Video findings...186
8.3.2.3 Discussion... 186
8.3.3 Findings from the second QUASS study...187
8.3.4 Discussion...188
CHAPTER 9: CONCLUSIONS AND RECOMMENDATIONS...191
9.1 Th er e s e a r c hp r o b l e m r e s t a t e d... 191
9.2 Co n t r ib u t io n so ft h et h e s i s...192
9.2.1 Speech intelligibility and quality...193
9.2.1.1 Substantive contributions...193
9.2.1.2 Methodological contributions... 193
9.2.2 Perceived video quality...196
9.2.2.1 Substantive contributions...196
9.2.2.2 Methodological contributions... 197
9.2.3 Other substantive and methodological contributions...198
9.2.3.1 Conducting research in the field ... 198
9.2.3.2 Investigating the vocabulary of quality... 199
9.2.4 Shortcomings o f the thesis research...200
9.2.5 Recommendations to HCI researchers and network designers...201
9.3 Futurew o r k... 204
REFERENCES...208
APPENDIX A: SAMPLE RELATE QUESTIONNAIRE... 217
APPENDIX B: RAW DATA FROM STUDY 1, COMPENSATING FOR PACKET LOSS IN INTERNET AUDIO...220
APPENDIX C: RAW DATA FOR STUDY 2, INVESTIGATING THE INTELLIGIBILITY OF LONGER SPEECH STIMULI... 223
APPENDIX D: RAW DATA FOR STUDY 3, INVESTIGATING THE PERCEIVED QUALITY OF PASSAGES OF SPEECH... 225
APPENDIX F: RAW DATA FOR STUDY 5, ASSESSING THE PERCEIVED LEVEL OF AUDIO-VIDEO SYNCHRONISATION... 227
APPENDIX G: RAW DATA FOR STUDY 7, INVESTIGATING A NEW QUALITY SCALE 228
APPENDIX H: INDIVIDUAL SUBJECT RATING CORRELATIONS WITH LOSS RATE IN THE FIRST QUASS STUDY... 231
APPENDIX I: INDIVIDUAL RATING BEHAVIOUR IN THE SECOND QUASS STUDY232
APPENDIX J: RAW DATA FOR STUDY 11, INVESTIGATING THE EFFECTS OF OTHER FACTORS ON PERCEIVED QUALITY... 245
APPENDIX K: EXAMPLE OF A WEB-BASED ASSESSMENT FORM USED IN THE PIPVIC FIELD TRIALS...247
List of figures
Figure 1: Typical desktop conferencing set-up...38
Figure 2: The RAT main interface...41
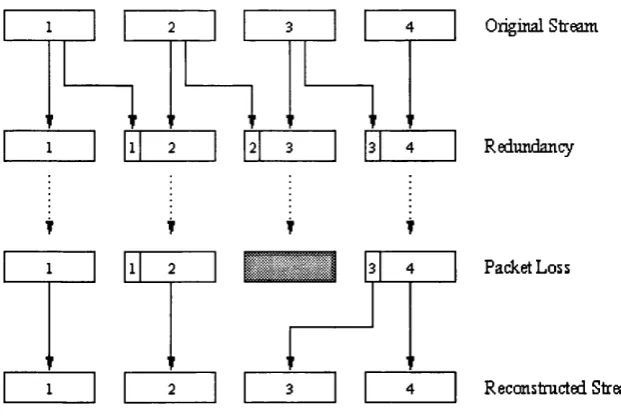
Figure 3: Redundant transm ission...44
Figure 4: RAT reception statistics for a conference participant...45
Figure 5: The main vie window, showing thumbnail images... 46
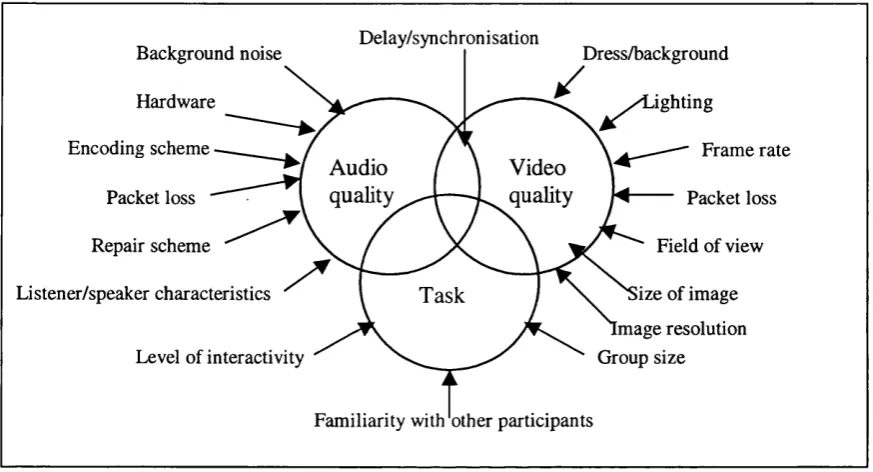
Figure 6: An overview of the main factors affecting perceived media quality in M M C... 49
Figure 7: ITU-T recommended speech quality measurement scales...78
Figure 8: ITU-R recommended image quality measurement scales...80
Figure 9: The ReLaTe integrated interface... 100
Figure 10: Intelligibility of packet loss speech repaired with SS, PR and LPC at 20, 40 and 80 ms packet sizes respectively...113
Figure 11: Mean opinion scores for packet loss speech repaired with SS, PR and LPC at 20, 40 and 80 ms packet sizes respectively... 113
Figure 12: Interaction plot for intelligibility scores at 20 and 30% packet lo s s ...115
Figure 13: Interaction plot for quality ratings at 20 and 30% packet lo s s ... 115
Figure 14: Mean sentence intelligibility with packet loss repaired with either packet repetition (PR) or LPC redundancy... 119
Figure 15: Mean perceived speech quality, with packet loss repaired with silence substitution (SS) or LPC redundancy... 121
Figure 16: Mean perceived quality rating of connection during a conversational task, where packet loss is repaired with packet repetition (PR) or LPC redundancy...124
Figure 17: Combined perceived quality results from word, passage and conversation tests 125 Figure 18: Rating scale for assessing degree of synchronisation... 127
Figure 19: Perceived degree of audio-video synchronisation, where 1 represents ‘not synchronised’ and 5 ‘synchronised’ ... 128
Figure 20: Mean positions for quality terms placed on 200 mm line. ITU terms are indicated by an unfilled square. The right-hand axis shows the theoretical positions of the ITU terms on the 5-point scale... 132
Figure 21: The polar continuous scale (not to scale)...136
Figure 22: Mean ratings awarded for speech passages with loss repaired with packet repetition (PR) or LPC redundancy... 137
Figure 23: The QUASS interface...146
Figure 25: Mean slider position every second for condition 2... 149
Figure 26: Mean slider position every second for condition 4... 149
Figure 27: Standard deviations for condition 2 ... 150
Figure 28: QUASS interface with budget...154
Figure 29: Experimental set-up...155
Figure 30: Average loss tolerated by Group A (no video) and Group V (video), in the ‘no budget’ and ‘budget’ conditions... 162
Figure 31: The effect of the budget on individual rating behaviour... 163
Figure 32: The 100-point quality rating scale... 173
Figure 33: Loss reported from UCL by a Glasgow conference participant over a one-hour project meeting...174
Figure 34: Mean quality rating awarded for different degradation types, on 1st and 2nd occasion of hearing...179
List of tables
Table 1: Speech repair scheme characteristics: method and perceptual effect...44
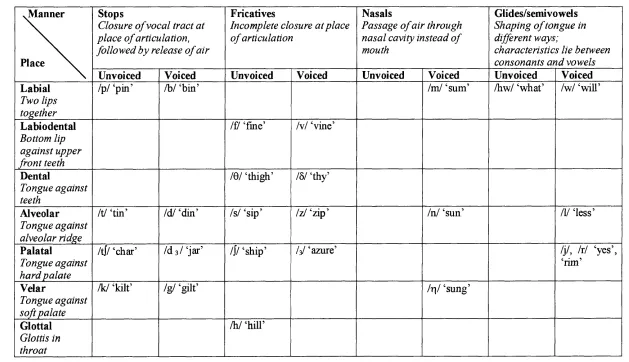
Table 2: Summary of consonant classification (adapted from Warren, 1982)...54
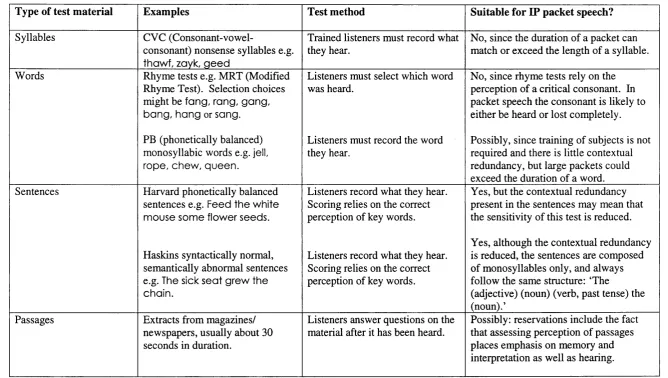
Table 3: Speech intelligibility test methods... 74
Table 4: Audio loss levels reported during one hour-long session... 104
Table 5: Audio scale rating results for two students (SI and S2) over the course...105
Table 6: Means and standard deviations for PB word list intelligibility results...112
Table 7: Means and standard deviations for PB word list quality ratings... 112
Table 8: Main effects and interactions for intelligibility scores at 20 and 30% packet loss 114 Table 9: Interaction plot for quality ratings at 20 and 30% packet loss...116
Table 10: Minimum and maximum quality ratings awarded in each condition...116
Table 11: Means and standard deviations of sentence intelligibility... 119
Table 12: Means and standard deviations for perceived quality of passages... 121
Table 13: Means and standard deviations for perceived quality of speech during a conversational task... 123
Table 14: Mean scores and standard deviations for perceived degree of synchronisation...128
Table 15: Means and standard deviations for position of terms on graphic scale...131
Table 16: Video rating results for weeks 2 and 6, where 0 represents a rating of ‘completely inadequate’ and 100 represents a rating of ‘completely adequate’... 141
Table 17: Packet loss patterns imposed on the speech files...147
Table 18: Individual subject behaviour in the audio-only group, Group A, in the no budget (NB) and budget (B) conditions... 160
Table 19: Individual subject behaviour in the audio and video group. Group V, in the no budget (NB) and budget (B) conditions... 161
Table 20: Average loss rejected by individuals in Group A (no video) and Group V (video), with condition (no budget and budget) and group means...165
Table 21: Key problems reported by users in the PIPVIC field trials...174
Table 22: Combined subjective rating means for 1st and 2nd presentation of the conditions... 180
Table 23: Words and number of times selected to describe audio quality 'at worst' by 24 subjects 183 Table 24: Frequency of audio term selection... 185
Table 25: Frequency of video term selection... 185
Table 26: Descriptive audio terms generated by the subjects... 188
List of abbreviations and acronyms
ADPCM Adaptive Differential Pulse Code Modulation
CCIR Comite Consultatif International de Radiocommunication
CC ITT Comité Consultatif International de Telephonie et Télégraphié
CCR Comparison Category Rating
GIF Common Intermediate Format
CSCW Computer-Supported Cooperative Work
CSN Circuit-Switched Network
DCR Degradation Category Rating
DSCQS Double Stimulus Continuous Quality Scale
DSIS Double Stimulus Impairment Scale
DVI Digital Video Interactive
EBU European Broadcasting Union
FTF Face to face
GSM Groupe Spéciale Mobile
H C I Human-Computer Interaction
HDTV High Definition Television
ISDN Integrated Services Digital Network
IP Internet Protocol
ITU International Telecommunications Union
LPC Linear Predictive Coding
M bone Multicast Backbone (of the Internet)
M M C Multicast Multimedia Conferencing
M OS Mean Opinion Score
M PEG Motion Picture Expert Group
ms millisecond
NTE Network Text Editor
PB Phonetically Balanced
PC M Pulse Code Modulation
PR Packet Repetition
PSN Packet-Switched Network
Q C IF Quarter Common Intermediate Format
QoS Quality of Service
QUASS Quality Assessment Slider
RAT Robust-Audio Tool
SCIF Super Common Intermediate Format
SDR Session Directory tool
SS Silence Substitution
SSCQE Single Stimulus Continuous Quality Evaluation
TC P Transport Control Protocol
UCL University College London
vat Video-Audio Tool vie VldeoConferencing tool
VMC Video Mediated Communication
Chapter 1: Introduction
1.1 Desktop conferencing over the Internet
Desktop multimedia conferencing entails the communication of two or more individuals across a
network using a combination of audio, video and shared workspace. Users sit in front of their
computers and communicate in real time via microphone, camera, and (usually) shared digital
workspace. The communication can take place on a point-to-point basis, or involve many
individuals and sites (via multicasting - Deering, 1988), and therefore offers many diverse
communities the opportunity to collaboratively work across great distances. Uptake of the
technology has been increasing in the higher education and research communities for applications
such as distance education and remote project meetings, and the rapid growth of digital
broadcasting and entertainment systems has ensured that the technology has spread throughout
industrial and commercial communities in recent years. As network infrastractures improve, and
equipment costs drop, it can be anticipated that multimedia conferencing will continue to grow in
popularity.
However, as the popularity of the Internet is growing, and the uptake of multimedia conferencing
technology is increasing, a cautionary note must be sounded. There is a danger that the growing
Internet community could become a victim of its own success: as traffic increases, so does network
congestion, which has particularly adverse effects on the successful and timely delivery of real-time
data. This increase of network congestion has prompted calls for Quality o f Service (QoS)
guarantees, which could be achieved by mechanisms such as bandwidth reservation (see section
1.2). QoS means different things to different people. According to Fluckiger (1995), QoS in
networking terms is a “...concept by which applications may indicate their specific requirements to
the network, before they actually start transmitting information data”. This raises the question
‘What requirements does the application have?’ Ultimately, an application’s requirements must be
the application user’s requirements, i.e. “...a residential person, a professional individual, a
subscriber organisation, a computer program, a computer system”. In the context of this thesis, it
is the requirements of the end-user of a system, the person who interacts with a network application
to achieve a particular task, that determine whether the media quality is good enough.
The work reported in this thesis has been carried out in the context of Internet Protocol (IP)-based
multicast multimedia conferencing (MMC), but many of the issues and findings should be relevant
for other desktop conferencing systems and networks, and contribute to the design and development
of multimedia conferencing applications in general.
1.2 Description of the research problem
The research focus of this thesis is how to establish, from an end-user perspective, what audio and
video quality is required to make desktop videoconferencing usable.
There is an implicit assumption in the networking community that all audio and video quality
problems in videoconferencing will be solved by increasing or reserving bandwidth (e.g. Jay ant,
1990; Zhang et al., 1993). However, bandwidth is expensive, and to employ a scheme such as
bandwidth reservation effectively, it would be sensible to establish what the different media quality
requirements actually are, from an end-user’s point of view, for different tasks. Designers of
services and applications stand to benefit from knowing the minimum quality required (for a
particular task to be achieved successfully, without causing user dissatisfaction and undue user cost
- see section 2.1.2) and the maximum point beyond which increased quality offers no benefit to the
user. Identifying these quality boundaries will be of importance to the networking community:
even if available bandwidth can be maximised in most places, there will always be consumer
demand for lower quality at lower cost (Podolsky et al., 1998).
Although bandwidth requirements undoubtedly need to be identified, many other factors can have
an impact on user perception, especially the multimodal perception entailed in videoconferencing.
For example, it is known that increasing audio quality can create an illusion of increased video
quality (Negroponte, 1995), and that volume differences between speakers in videoconferences can
cause negative quality perceptions (see section 8.2). Factors such as these need to be identified, and
their impact on perceived quality should be explored systematically.
However, this raises a further problem - there is no established methodology in either the Human-
Computer Interaction (HCI) or networking communities for assessing the subjective quality of
audio and video delivered through real-time videoconferencing systems. This is partly due to the
fact that until recently, much conferencing (over the Internet) was confined to the networking
research community, but also because interactive, multi-person conferencing presents a non-trivial
conglomeration of variables that can interact to affect perceived quality, rendering traditional
speech and picture quality measurement methods insufficient. Increasing the bandwidth may
reduce the effects of network congestion, but factors such as the hardware used, the method of
encoding, the background noise, and the task being undertaken will all play a role in affecting the
overall perceived quality. From Gestalt psychology we are told that ''‘the whole is greater than the
is necessary to first identify and understand the role that each of those parts plays, and how they
interact with one another.
Therefore, the main research questions addressed in this thesis are:
• How should the subjective quality of the component media (audio in particular) delivered in
desktop videoconferencing be measured? (What existing measurement methods might be
suitable, and where might these methods fail?)
• What are the fundamental factors that affect perceived media quality in desktop
videoconferencing?
• What can and should be done to ensure sufficient subjective media quality for different
videoconferencing tasks to be completed successfully?
1.3 The research approach
To date, surprisingly little empirical (either qualitative or quantitative) work has been carried out in
the area of networked videoconferencing. Existing research into speech and video quality
perception has tended to develop objective modelling techniques, or to investigate the subjective
quality of the medium in isolated and brief segments. However, objective modelling techniques
have not been perfected for the fluctuating conditions and degradations that can be common in
networked communication, and it is therefore argued that they should not be relied upon to derive
subjective quality requirements (see section 4.2). Although investigating the subjective quality of
the medium in isolation permits a greater degree of control, with respect to MMC this approach can
only be a part of the data-gathering, since there are so many other influencing factors in the real
world. In addition, short segments listened to or viewed in isolation can tell us nothing about task
performance (see section 2.1.2).
Central to this HCI thesis is the premise that effective evaluation of MMC perceived quality can
only be achieved through grounding the research in a MMC context, i.e. through conducting
research with real users using MMC technology in real tasks. It is argued that only through
observation in the field can the issues most important to end users be identified. Experimental
hypotheses about these issues can then be formulated and verified under laboratory simulation.
This ‘hand-in-hand’ combined approach is believed to be particularly sensible in investigations of
interactive networked communication, due to the multiplicity of factors that could be assumed to
affect perceived quality.
In order to establish the feasibility and value of communicating via MMC, it is necessary to conduct
field trials using the technology between different sites and across different disciplines. Both
subjective and objective data must be collected, to increase understanding of the end user
requirements and the optimal network configurations. Laboratory-based simulations alone would
not be sufficient to achieve this aim within a reasonable timeframe.
The starting point of the research, therefore, is to gain an understanding of the audio and video
quality issues involved in MMC. A review of the literature in the areas of spoken and visual
communication, and how transmission of these media has traditionally been measured from a
subjective point of view, is also required. Empirical research then needs to be undertaken to
explore which of the existing methods can be successfully applied in the new research area of
networked videoconferencing, and new methods need to be developed if necessary. On the basis of
the research undertaken, conclusions and recommendations should be provided regarding the
assessment of media quality, and the provision of sufficient levels of the same for different MMC
tasks.
1.4 Scope of the thesis
The original aim of this thesis research was to establish, from an HCI perspective, what audio and
video quality is required to make desktop videoconferencing systems usable. This means that the
quality delivered should be sufficient to meet user requirements within the context of a particular
task, such that the task goal can be achieved successfully (and be perceived as such), without
provoking undue cost to the user (in terms of fatigue or stress). It was determined early on in the
research, however, that there was no suitable existing method for determining perceived quality of
audio and video experienced in interactive videoconferencing communication. As a result, the
thesis research focus shifted to a more methodological one, exploring and developing techniques to
help design an HCI method for assessing audio and video quality.
The research initially focused on identifying the issues that might have an impact on perceived
quality of audio and video in networked videoconferencing environments. It rapidly became clear
that the number of factors involved was far too great to investigate within the time period of the
research (see section 2.8). As a result of the observations made in the ReLaTe field trial (see
section 5.1), the research emphasis was placed on the audio channel rather than the video channel,
since this was found to be the most critical factor to end users. The audio factors likely to play the
schemes. However, the research approach meant that an awareness and consideration of all other
factors was extant (see sections 5.1, 6.2 and 8.1).
In addition to limiting the scope of the variables to be investigated, the means by which to
investigate their effect on perceived quality had to be constrained. Although one of the key goals of
the research was to identify existing research methods that can be applied successfully in the
evaluation of videoconference audio and video quality, it was clearly not possible to conduct an
exhaustive investigation and comparison of all the available methods. Chapter 4 presents an
overview of the methods identified and describes why some of them were not considered suitable
for further research.
1.5 Contributions of the thesis
An understanding of subjective requirements is critical to the survival of real-time multimedia
applications and services, since it is the end users that will determine whether an application is
successful or not. For example, system developers may favour the implementation of one method
of speech encoding over another if it reduces the amount of bandwidth required, but if users do not
like the sound quality delivered, applications utilising the scheme are likely to be rejected. As
mentioned in section 1.2, there are currently no suitable guidelines in the HCI literature for
evaluating the conditions commonly experienced by users in videoconferencing applications.
Traditional techniques for subjective assessment of audio and video quality have been developed
from an engineering standpoint, with a view to determining whether degradations are detectable or
not. From an HCI point of view, this level of investigation is almost irrelevant - what matters is
whether the level of quality that is delivered is sufficient for a task to be carried out successfully,
with acceptable cost to the user.
In addressing the need for an HCI method for assessing and establishing required audio and video
quality, the research presented in this thesis makes a number of methodological and substantive
contributions. Methodological contributions include:
1. An evaluation of the suitability of existing methods for subjective assessment of the audio and
video quality delivered in networked videoconferencing environments (in theory in Chapter 4,
and in practice in Chapter 5).
2. The development of new methods for the subjective assessment of this new technology, leading
to a means of identifying different subjective quality issues and deriving subjective quality
requirements for different videoconferencing applications (see Chapters 6, 7 and 8). For
example, a new polar rating scale is explored and assessed in section 6.1.
Substantive contributions include:
3. A fuller understanding of the issues involved in subjective perception formation in MMC (in
particular in Chapters 5 and 8). For instance, research in the field backed up by experimental
data shows that volume differences can have a more profound effect on perceived quality than
audio packet loss (see section 8.2).
4. Substantive knowledge about the audio and video quality requirements for some MMC tasks (in
particular Chapters 7 and 8). For example, packet loss levels that will be tolerated in a
conversational task are established in section 7.4.
The thesis contributes knowledge to the HCI community in terms of a methodology for assessing
perceived quality of audio and video in MMC conferences, and offers benefits to QoS networking
researchers and developers in terms of providing a means of establishing objective audio and video
requirements for different tasks.
1.6 Overview of the thesis
In section 1.2 the research problems to be addressed were identified as:
1. What are the fundamental factors that affect perceived media (audio and video) quality in
desktop videoconferencing?
2. How should the subjective quality of the component media delivered in desktop MMC be
measured? (What existing measurement methods might be suitable, and where might these
methods fail from an HCI viewpoint?)
3. Which methods aid in identifying critical quality factors, and upper and lower objective quality
limits required for different videoconferencing tasks?
The fundamental factors that may affect perceived quality are described and explained in Chapters 2
and 3, and investigated practically in chapters 5, 6, 7 and 8. The existing methods for assessing
subjective quality are investigated theoretically in Chapter 4, and practically in Chapter 5. New
subjective assessment methods are explored in Chapters 5, 6, 7 and 8. The results of the studies
undertaken in these chapters help answer the third research problem of which methods help
establish quality requirements for different tasks.
The individual chapters are outlined below.
Chapter 2 presents a working definition of networked multimedia communication and provides
descriptions of the multimedia tools used in the research presented in the main body of the thesis.
constituent media of audio, video and shared workspace are discussed. Chapter 2 also presents an
overview of the HCI discipline and outlines the academic approach undertaken in the thesis. This
chapter therefore justifies the research strategy undertaken in the overall context of HCI research.
Although there has been little previous research on subjective quality assessment in networked
videoconferencing, there has been much research on the process and product of video-mediated
communication in general, and this research is surveyed in Chapter 3. The mechanisms and results
of spoken and visual communication are considered separately, and then together in the context of
the task being undertaken.
The final background chapter. Chapter 4, focuses on the methods that are traditionally used to
measure the perceived quality of transmitted speech and video. A distinction is made between
speech intelligibility and speech quality, since it is possible to gain high intelligibility without
corresponding high quality. Subjective measurement methods recommended by the ITU are
considered in relation to their suitability for assessing the novel conditions experienced in MMC.
Although the ITU rating scales may in some cases be suitable, serious issues are brought to light:
the labels on the category quality scales do not represent equal intervals (calling into doubt the
legitimacy of results gained through them), and the scale does not allow for the multidimensionality
of perceived quality to be measured. Chapter 4 also introduces the most recent ITU-recommended
quality rating method, the Single Stimulus Continuous Quality Evaluation (SSCQE), which permits
quality ratings to be recorded every second by means of a slider. The research presented in this
thesis resulted in the development of a similar method for gathering subjective quality data, a tool
named QUASS (QUality Assessment Slider). However, as is argued in Chapters 7 and 9, QUASS
is significantly different from the SSCQE method, and offers a more powerful functionality.
Chapter 4 ends with a detailed discussion of the research agenda in the light of the literature review.
Chapters 5-8 present the empirical research undertaken. Field trials, exploratory studies, and larger
experiments are described. The pros, cons and trade-offs involved in both experimental and real-
world studies of MMC are elucidated and discussed. The motivations for, and methods used in, the
studies are presented, and the results are considered in terms of methodological and substantive
contributions to the thesis.
Chapter 5 describes a remote language teaching field trial, and presents the results of early research
undertaken on the basis of observations made in the field trial. These early studies explored the use
of traditional (ITU-recommended) rating methods in the context of MMC speech and video.
Although the scales allowed substantive knowledge to be advanced, the vocabulary on the scales
was found to be unsuitable for representing the range of MMC qualities, and the multidimensional
aspect of quality perception. The need for a new rating method was identified, whereby the effects
of different quality dimensions can be investigated.
Therefore, Chapter 6 presents studies, both in the lab and in the field, exploring the use of a novel,
polar continuous rating scale. Although the novel rating scale proved useful and reliable, the
drawbacks of one overall rating at the end of a session are highlighted, leading to the development
ofQUASS.
Studies using QUASS are discussed in Chapter 7. It was found that continuous real-time subjective
quality rating can be performed well by subjects in an experimental setting, but not so well in a real-
world conference, where the primary (conference) task demands all of the user’s attention. This led
to the development of a version of QUASS where the slider now controlled the objective quality
that a user received i.e. the user could request the level of quality required in order to perform a
task. In an interactive test environment the method was proven to work well, although individual
differences appear profound. The results are analysed and discussed.
Chapter 8 presents the findings from a large-scale field trial where the impact of different types of
quality degradations was clearly elucidated for the first time. The observations from the field trial
were corroborated in an experiment, which also enabled data to be gathered on how users describe
different types of degradation. Additional research into the vocabulary of MMC degradations, as
used by different user groups, is summarised. The importance of establishing a common descriptive
vocabulary between developers and users is discussed, and the application of different descriptive
terms to different dimensions of quality, and to diagnostic help facilities, is discussed.
The final chapter, chapter 9, draws together all of the substantive results attained from the various
methods employed throughout the research. The usefulness of the different approaches in terms of
achieving the overall goals of developing an HCI evaluation methodology for videoconferencing
applications, and of establishing quality guidelines for certain applications, are discussed. A
Chapter 2: The research context
This chapter presents both the HCI context and research domain - videoconferencing across Internet
Protocol networks - of the thesis. The first part of this chapter outlines the view of HCI within
which the thesis research is conducted, and briefly introduces the methods used. The second part of
the chapter introduces the research topic of networked multimedia communication in detail, and
presents the issues involved in the evaluation of desktop videoconferencing. A definition of
multimedia communication is first provided, and then a description of the characteristics of the
networks over which multimedia communication occurs. The key components of audio, video and
shared workspace are presented. Finally the key issues and difficulties involved in assessing the
usability of, and evaluating the delivered quality in, MMC are discussed.
2.1 What is HCI?
Human-computer interaction can be defined as ‘''the discipline concerned with the design,
evaluation, and implementation o f interactive computing systems fo r human use and with the study
o f major phenomena surrounding th em ”(ACM SIGCHI, quoted in Dix et al., 1998). Since it is
concerned with the technical design of the interacting machine in addition to the human-machine
interface, HCI is vertically more extensive than human factors, but it is less extensive horizontally,
since it is limited to a much narrower class of machines (Dix et al., 1998).
As a research discipline HCI is relatively young (dating from the early 1980s with the emergence of
the personal computer), and has attracted researchers from a variety of disciplines (chiefly
psychology, computer science and human factors, but also from areas as diverse as art and design,
linguistics and social anthropology). This multidisciplinary make-up is a contributory factor to the
discipline’s continuing struggle to define its overall research strategy and methodology. Although it
is agreed that the chief goal of HCI is to provide knowledge and methods for the design of usable
computer technology, there is currently a lack of consensus over how the research should be
conducted and its knowledge communicated to designers. Different approaches to the discipline
aim to produce different levels of knowledge output e.g. heuristics, guidelines or engineering
principles. The following section summarises the different positions with an aim to explaining the
research framework of this thesis. For a more detailed discussion of these positions, see Sasse
(1997).
2.1.1 Views of HCI
2.1.1.1 HCI as a science
In an attempt to prevent the ‘soft’ psychological input to HCI being pushed out by the ‘hard’
formalisms of the computer science and software engineering contributions, Newell and Card
(1985) proposed a programme to turn psychological research relevant to HCI into a ‘hard’ science,
by incorporating psychological knowledge into models and design tools to be used by designers.
The framework for the construction of such models and tools would be based on:
1. task analysis:symbolic descriptions of tasks from which user behaviour can be predicted;
2. calculation:prediction of user behaviour through explicit operations on mathematical models;
3. approximations: acceptance that such calculations can only be approximate because of the
complexity of human behaviour.
A number of criticisms can be levelled at this approach, however. It has been observed that
restricting the psychological contribution to HCI knowledge to formal descriptions and approximate
calculations would mean discarding a wealth of applicable information about users, and therefore
actually reducingthe overall psychological input to HCI. Carroll and Campbell (1986) suggest that,
rather than reducing the psychological contribution to HCI to quantitative measurements and
calculations, psychologists should ensure that the value of explanatory, conceptual HCI research is
recognised and applied. Dix et al. (1998) agree with this, stating that "fAe dearth o f predictive
psychological theory means that in order to test certain usability properties o f their designs,
designers must observe how actual users interact with the developed product and measure their
perform ance” As Sasse (1997) argues, the '‘''application o f quantitative methods to behavioural and
cognitive phenomena which have not been sufficiently well described and understood can lead to
the ‘garbage in, garbage out’ problem well known in computer science. ”
A further criticism of this approach is provided by Bellotti (1988), who observes that existing
science-based modelling techniques such as Moran’s Command Language Grammar (Moran, 1981)
and Payne and Green’s Task-Action Grammar (Payne and Green, 1986) have not been taken up by
designers. It appears that these methods require too much effort and time to master, for too little
gain. Mack and Nielsen (1994) also point out that in addition to being difficult to learn, formal
methods “are very difficult to apply and do not scale up well to complex, highly interactive user
interfaces. ”
In response to these problems, an alternative to HCI as a science was formulated by Carroll and
2.1.1.2 HCI as a design science
Whilst Newell and Card (1985) argue that empirical HCI research should gather quantitative data
from which to build models for designers to use, thereby following the traditional science approach,
Carroll and Campbell (1986) stress the value and importance of conceptually deep, explanatory
theories of human-computer interaction. They argue that it is necessary to collect “a// the
information we can g e f \ since, like psychologists, HCI researchers are in no position to observe
mental processes directly. In response to a criticism by Newell and Card that observation alone
does not allow HCI research to advance beyond an informal, qualitative stage, Carroll and
Campbell (1989) presented their artifact theory. The central premise of this theory is that it is only
after a system or artifact has been developed that HCI research issues tend to be identified and
addressed. Although Newell and Card would argue this as testament to HCI science lagging
computing technology, Carroll and Campbell claim that the artifacts act in HCI in the same way as
theories in more traditional scientific disciplines. By observing and evaluating artifacts in use in the
real world, HCI research will eventually be advanced through the formulation of theories of user-
system interaction, based on these observations and evaluations.
2.1.1.3 HCI as an engineering discipline
A third view of HCI is as an engineering discipline, formulated by Long and Dowell (1989). They
define HCI as “...the design o f humans and computers interacting to perform work effectively. ”
The theory is that HCI can be decomposed into the domains of software engineering and human
factors., forming two complementary problems to be solved:
• the design of computers interacting with humans (the domain of software engineering);
• the design of humans interacting with computers (the domain of human factors).
Both domains are responsible for constructing their own engineering principles. Software
engineering is assumed to be close to establishing such principles, whilst human factors is not
currently in a position to formulate them. Although the approach is an attractive one, with its long
term goal of being able to apply engineering principles to HCI design problems { ‘specify and
implement’ the solution), this goal is a long way off: as previously stated, all of the requirements for
an interactive system cannot be determined from the start because our models of the psychology and
sociology of the human and human cognition are incomplete, and do not allow us to predict how to
design for maximum usability. Sasse (1997) also cautions against the presumption that software
engineering is close to establishing its engineering principles: “The problem is the often implicit
-assumption that, because research on the “C ” side o f HCI is carried out in disciplines named
computer science and software ensineerins, ail research in these areas follows strict science and
engineering procedures and yields “hard" results. This assumption is incorrect. ”
2.1.1.4 Conclusions
As Sasse (1997) observes, although there are distinct philosophies of HCI, there are arguments why
pursuing any of these approaches exclusively may not produce the integrated body of applicable
knowledge which the discipline needs to establish. Subscribing to the ‘HCI as a science’ school of
thought requires the formulation of models of the user that call on knowledge about human
cognition that is far from complete. HCI as a design science, on the other hand, can be accused of
producing craft knowledge which is only applicable to the system or artifact under investigation.
The route to expressing concrete HCI knowledge from this approach is still not clearly mapped out.
Engineering principles for HCI are an appealing concept, but as has been argued, the discipline is
still some way off from establishing human factors principles. So how should an individual
researcher plan his or her HCI research?
There are certain facts that are not disputed by any investigators, and it is these that provide a guide
as to where to start in planning research. The HCI discipline seeks to construct a body of
knowledge; therefore, any research undertaking should aim to contribute to this accumulation of
HCI knowledge. It is both substantive and methodological support and knowledge that needs to be
advanced and increased. Substantive (declarative) knowledge is advanced through research
findings, with the aim of using these to prescribe guidelines or standards for design.
Methodological support is provided through general system development methods and the refining
and development of specific HCI techniques to suit the application under evaluation/development.
Before undertaking research, the researcher should determine what related knowledge from other
disciplines exists, whether it can be adopted in its existing form or whether an HCI-specific version
needs to be constructed (Sasse, 1997).
HCI knowledge needs to be made accessible and applicable to designers in order to achieve its
intended effect. Designers are users of HCI knowledge; therefore this knowledge has to be
presented in a format that supports them in the task they are trying to perform. This means it has to
be translated into accessible guidelines, efficient methods, or incorporated into tools. It can be
argued that the best way to ensure the knowledge that is gained is rounded and comprehensive is for
HCI to use both quantitative and qualitative methods, as advocated by Newell and Card (1986). As
Sasse (1997) states, “The semantic prejudice which associates experiments and quantitative data
inappropriate, or badly planned or controlled, can set back research. Anecdotal science is avoided
by studies that are well planned and executed, and meticulously documented fo r the inspection by
other researchers
2.1.2 HCI evaluation
Evaluation can be defined as '‘an assessment o f the conformity between a system's actual
performance and its desired performance" (Whitefield et al., 1991). This performance can be
measured from three HCI perspectives: task performance, user satisfaction, and user cost. Task
performance is generally assessed in terms of effectiveness and efficiency. Effectiveness relates to
whether users can complete the tasks given to them, and efficiency is concerned with aspects such
as the time taken to complete the task, the frequency of errors, and the frequency of accessing help
facilities. User satisfaction is subjectively measured, often by rating scales or interviews. User cost
is determined mainly by objective measurements of factors such as degree of fatigue, stress,
repetitive strain injury (RSI) potential, and mental effort. The perspectives that will be measured,
and the methods used within these perspectives, will depend on the goals of the evaluation. The
goals of the evaluation will in turn depend on the time available to carry out the evaluation, and the
resources and skills of the investigators.
Two different types of evaluation can be undertaken: summative evaluation and formative
evaluation. Summative evaluation tends to takes place after the implementation of an interface or
system, and is designed to determine whether the design goals were achieved. The output of a
summative evaluation is a report listing the issues/problems found. Formative evaluation, on the
other hand, is an evaluation of an unfinished user interface, and aims to expose usability problems
that exist in the current iteration. Formative evaluation is better positioned to help form the solution
to a design problem.
Evaluation can be carried out in either the laboratory or the field. There are advantages and
drawbacks to both types of evaluation. Laboratory studies offer a high level of control over the
conditions in which the evaluation is carried out, but the lack of context (e.g. office environment
and décor) may mean that one is investigating a situation that never occurs in the real world. Dix et
al. (1998) observe that it is '’'’especially difficult to observe several people cooperating on a task in a
laboratory situation as interpersonal communication is so heavily dependent on context." Field
studies, on the other hand, allow the gathering of data on interactions between systems and between
individuals which would be missed in a laboratory study, but are subject to greater interference
from extraneous events such as phone calls and high background noise. Dix et al. conclude that, on
balance, field study is to be preferred, since it permits the study of the interaction as it occurs in
actual use, but they caution that even in this situation, the subjects are likely to be influenced by the
presence of the analyst and/or recording equipment, so the situation will always be somewhat less
than ‘natural’.
As stated above, the evaluation methods that are used will depend on the goals and objectives of the
evaluation. Their applicability/usefulness will also depend on where the data is being collected, and
the type of system being assessed. Some common HCI evaluation methods include specialist
reports, user reports and observational methods (Preece et al., 1994).
• Specialist reports such as an ‘expert walkthrough’ involve an HCI specialist operating a computer or system from the users’ point of view and reporting the difficulties
encountered/changes that should be made. These methods are also known as usability inspection methods, and are methods of evaluating software user interfaces using rules, guidelines or heuristics, rather than acquiring (and analysing) behavioural end-user feedback
(Mack and Montaniz, 1994).
• User reports are based on users’ memory of/inferences about a system. The techniques used to gather the data are questionnaires, interviews, surveys etc.
• Observational methods typically involve documenting user performance using a system, and can take place either in the real world or in controlled laboratory settings.
Mack & Nielsen (1994) include
• Automatic assessment (where usability measures are computed by running a system through evaluation software) and
• Formal measurement (using exact models and formulae to calculate usability measures) but report that '"With the current state o f the art, automatic methods do not work and form al
methods are very difftcult to apply and do not scale up well to complex, highly interactive user
interfaces. Empirical methods are the main way o f evaluating user interfaces, with user testing
probably being the most commonly used method. Often, real users can be dijficult or expensive to
recruit in order to test all aspects o f all the versions o f an evolving design. In this respect,
inspection methods are a way to ‘save users’”.
2.1.2.1 Evaluation conducted in this thesis
The studies conducted in this thesis have considered task performance where possible, but the
emphasis has been on subjective methods for user satisfaction. This was determined to be the most
important aspect to investigate since establishing user satisfaction is critical for the uptake of any