United Kingdom ISSN 2348 0386 Vol. VIII, Issue 3, March 2020
Licensed under Creative Common Page 429
http://ijecm.co.uk/
A GROSS MARKETING MARGIN AND PRODUCERS’ SHARE
DESCRIPTIVE ANALYSIS OF THE BEEF VALUE CHAIN IN ESWATINI
Sicelo Ignatius Dlamini
Department of Tropical Agriculture and International Cooperation
National Pingtung University of Science and Technology, Pingtung 91201, Taiwan frsicelodlamini2@gmail.com
Wen-Chi Huang
Department of Agribusiness Management
National Pingtung University of Science and Technology, Pingtung 91201, Taiwan Corresponding author: wenchi@mail.npust.edu.tw
Abstract
Value chain involves all the activities along the production-consumption continuum through
the engagement of economic agents. Analysing value chains is paramount in understanding
production systems, relationships in market channels, participation of actors and inhibitors
of production and competitiveness. Currently, Eswatini’s beef value chain lacks a
comprehensive empirical analysis that unpacks operations and challenges therein.
Therefore, this study provides a baseline descriptive analysis of the beef value chain
through identifying economic agents, describing market channels, evaluating farmers’
economic benefit from each channel and unearthing bottlenecks. The focus group technique
was used as a pre-data collection strategy and shelf price data were collected from 102 beef
outlet from all major towns. Further supplementary secondary data were collected from
government reports. A descriptive-thematic analysis approach was applied through content
analysis to draw conclusions from the data. The identified economic agents include input
suppliers, farmers, rancher, feedlotters, processors, butchers, supermarkets and
consumers. Farmers obtained more producers’ share through direct sale to consumers
Licensed under Creative Common Page 430 farmers’ economic benefit. Farmers are encouraged to form associations to increase their
productivity and bargaining power. The government is encouraged to establish a pro-poor
market framework to advance beef production.
Keywords: Beef cattle, value chain, gross marketing margin, producers’ share, Eswatini
INTRODUCTION
Swaziland is an agrarian country with about 70% of the population dependent on agriculture on Swazi Nation Land (SNL). National economic growth has been, in the recent past, subdued below 2% (Central Bank of Eswatini, 2016/2017), except for the 2.4% rebound experienced in 2018/2019 (Central Bank of Eswatini, 2018/2019). This recovery was attributed to improved performance of the agriculture and forestry sector, which contributed 8.0% to real GDP in 2018, out of which 4.4% was accounted for by the livestock subsector (Central Statistics Office, 2018).
The high economic value of livestock products, meat, milk and dairy products, anchors livestock production and marketing as a focal point in rural economic development. In this regard, beef commands the highest unit value among the livestock produc ts, placing beef cattle farmers at a prime position to ameliorate their livelihoods (Behzadi et al., 2018). Further advancements in domestic and export demand for livestock products, due to increases in household income and population, and shifts in consum er preferences (Lie et al., 2018; Puente-Rodríguez et al., 2019) further magnify the centrality of the livestock subsector in rural and national economic growth (Rich et al., 2011). This then presents an agribusiness opportunity for farmers, in which agricultural markets play a pivotal role as a conduit between cattle production and beef supply.
In Eswatini, beef cattle are popular among SNL smallholder farmers compared to Title Deed Land – TDL (see Figure 1a). According to the Department of Veterinary and Livestock Services (2018), beef cattle accounted for 48% of the red-meat livestock population (see Figure 1b). A total of 446,013 (90%) herds of beef cattle were raised by 48,595 (99%) smallholder SNL farmers compared to 731 (1%) commercial farmers on TDL. Generally, classification of farmers into smallholder and commercial farmers is solely based on land tenure, as opposed to production scale (Dizyee et al., 2017). Hence, “smallholder farmers” refers to SNL farmers in rural areas.
Licensed under Creative Common Page 431 Figure 1a: Proportion of the beef cattle farmers according to land tenure.
Figure 1b: Proportion of the different red-meat livestock.
Source: Adapted from Department of Veterinary and Livestock Services (2018).
The dearth of a structured marketing network for the beef industry in Eswatini has compromised market incentives necessary for the propagation of market-oriented production. Poor market organization imposes market imperfection that subdues farm gate prices, which in turn relegate smallholder farmers to low economic benefit (Purcell et al., 2017). This further imposes livestock market failure that cumbers market-oriented production and market participation, thereby jeopardizing the establishment and integration of smallholder farmers into functional value chains that maximize benefits for all actors. Hence, market organization and inclusive value chain management are antecedents of agricultural market efficiency, which undermine the potential of agriculture in rural development frameworks (Cacciolatti & Lee, 2016; Lie et al., 2018).
Moreover, research in this subject has focused on the analyses of supply chains (Masuku & Sihlongonyane, 2015; Masuku, 2011) and market orientation (Abafita et al., 2016), disregarding the assessment of farmers’ benefit from existing value chains. Inasmuch as market orientation is the bedrock for creating superior customer value (Han et al., 1998; Ruekert, 1992) required for developing competitive advantage and enterprise performance (Gainer & Padanyi, 2005; Liu et al., 2003), value chain analysis (from a rural development standpoint) is critical in the enhancement of the generally incapacitated smallholder farmers. Such farmers lack the knowhow and potential to compete successfully under market imperfection. Hence, the lack of credible empirical analysis is a fundamental obstacle in rural development decision- and policy-making processes (Rosales et al., 2017), in which, its resolution is essential for the up-liftment of livelihoods in developing countries.
Licensed under Creative Common Page 432 mapping-out of the beef market channels to identify the economic agents. Furthermore, gross marketing margin and producers’ share analyses were conducted to determine farmers’ benefit within the existing market channels.
LITERATURE REVIEW
Beef cattle production and market dynamics
Beef cattle are pivotal to the lives of the people of Eswatini, useful for subsistence and economic purposes. Subsistence wise, they provide draft power for farming and other functions, and are used for slaughters in traditional ceremonies (Khoza & Vilane, 2013). Commercially, beef cattle are of high economic value, thus kept as a store of wealth and are only sold through forced sales to meet immediate cash needs.
The population trends from 2011 to 2018, Figure 2, indicate that SNL harbours larger cattle population compared to TDL, justifying the centrality of smallholder farmers in agriculture-based rural development programmes. However, the Figure reveals that the cattle population has been decreasing over the years; showing percentage declines of 35% and 46% for SNL and TDL respectively, with an overall 36% decline of the national herd. Generally, such decline is ascribed to several challenges such as recurrent drought, human settlement and invasive weeds that claim pastures. Behind these challenges is low market participation by farmers, which is a resultant problem due to market failure in yielding meaningful economic benefit for farmers.
Licensed under Creative Common Page 433 In Eswatini, the failure to incorporate beef cattle farmers into functional value chains has subverted market potential of providing incentives for farmers, thus promoting the notion wealth storage through cattle accumulation over income generation through market involvement. This is one of the reasons for the lack of investment in superior breeds, evident by the dominance (80%) of the native small-sized and low-quality Nguni breed cattle over the prolific high-quality exotic breed (Khoza & Vilane, 2013). Although crossbreeding with the Brahman breed is gaining momentum (Dlamini & Huang, 2019), farmers generally practise low investment non-market-oriented production, through holding on to the unimproved native breed. This leads to low market benefit that translates to poor income generated for reinvestment. Furthermore, lack of enterprise-generated income weakens farmers’ capacity to recover from cattle losses during droughts, further inducing a shrink in domestic beef cattle production.
Customary in Southern Africa, continuous unenclosed communal grazing is practised under uncontrolled stocking rates, uncontrolled breeding and poor pasture management. Such practices are symptoms of a low investment non-market oriented production system that aggravates land degradation and pasture depletion (Tefera, 2013; Tfwala et al., 2012). Coupled with loss of cattle quality due to delayed sales, land degradation and pasture depletion exacerbates the production of low-quality cattle that fetch low market prices (Dizyee et al., 2017), thus diminishing farmers’ market benefit and eroding the sectors ability to improve national and rural economic growth. Therefore, the integration of farmers into functional livestock value chains is critically vital for creating a pull effect necessary to attract farmers into market-oriented production. Without meaningful economic benefit for farmers, the primary actors of agri-food systems, agriculture as a sector will continue to be relegated into a less profitable enterprise that fails to advance the development agenda for rural farming population that forms majority of the people in developing countries.
Licensed under Creative Common Page 434 Value chain
Value chain involves all the activities along the production-consumption continuum (Dzanja et al., 2013), including pre-strategic design for product or service idea-generation (Duguma et al., 2013). For agricultural products, the continuum incorporates production, processing, logistics co-ordination for delivery of the final products to the consumer, and dealing with inhibitory factors (Thwala, 2011). A value chain goes beyond supply chain that focuses on the input-output structure to assess the series of interlinking steps and the nature and character of a product (Gereffi et al., 2001; Masuku, 2011), by capturing the value added along the supply chain (Gilbert, 2006). Put differently, supply chain is a subset of a value chain.
In value chain analysis, the physical, economic and social transactions involved in the production and transformation processes are theoretically organized into vertical and horizontal integration (Xaba & Masuku, 2012). For our purpose, vertical integration is a case where farmers sell cattle to actors who transform them into beef that is sold to the final consumer. This resembles the coordination within upstream and downstream firms to create consumer value (Howard, 2006). Some writers have termed this “no integration” because of the lack of formal link relationships (contracts) between the different actors (Priyadarshi & Routroy, 2018).
Some understanding about market dynamics has created an appreciable level of bargaining power such that some farmers prefer to sell cattle directly to individual consumers for home slaughters. These farmers have some capacity to access & manage market information to develop a competitive strategy to survive in the market. We, therefore, term this horizontal integration.
Ideally, value chains are assessed at different levels; global, regional, national and firm levels (Rosales et al., 2017; Şerbănel, 2015). Firm vertical integration value chain analysis, at micro and macro levels, is well documented in literature with a corporate competitive advantage outlook for the advancement of organizational performance. However, we hold a rural development view-point, considering a sectorial value chain (Rieple & Singh, 2010) that emanates with a huge number of farmers without extensive comprehension of the complex market dynamics. In this case, farmers are disintegrated from other players (non-contracted) along the value chain. Such disintegration does not disqualify our approach since value addition exists as cattle are transformed into beef along the production-consumption continuum. Moreover, this broad perspective analysis offers insights that would not surface in studies where individual economic agents are a priority (Rosales et al., 2017).
Licensed under Creative Common Page 435 2012), that promote collaboration among actors and allocate meaningful final commodity value to all economic agents (Gereffi et al., 2001). It is an integral basis for the development of sustainable market systems (Ambe, 2012; Lambert & Cooper, 2000), aimed at creating competitive advantage required to meet domestic and export demand.
Without proper value chain management, smallholder farmers in developing countries often fail to thrive under imperfect market conditions. These farmers lack the capacity to develop competitive strategies necessary to realize meaningful economic benefit from unorganized markets. In fact, the lack of focus on pro-poor market approach (Hellin et al., 2009) hampers the amelioration of livelihoods through agriculture sub-Saharan Africa. Therefore, good value chain management proceeds with the elucidation of the distribution of the value added among actors with an aim of eliminating power asymmetry that imposes malapportionment of end-product value to relevant actors (Purnomo et al., 2009). Hence, value chain analysis is a diagnostic strategy for grafting smallholder farmers into functional food value chains (Lie et al., 2018), to promote rural development and economic growth by creating win-win relationships (Donovan et al., 2015; Stoian et al., 2012).
METHODOLOGY
Study area
Eswatini is a landlocked country, between South Africa and Mozambique, with a surface area of 17, 364km2 (Central Intelligence Agency, 2019). Being predominantly rural, 74.2% of the total area is classified as Swazi Nation Land (Mabuza et al., 2013), where about 70% of the population depend on agriculture. Although categorised as a lower middle-income country, 60.4% of the population live below the 2011 purchasing power parity of $3.20USD per person per day (World Bank, 2019). The unemployment rate remains above 40% (Ministry of Labour and Social Security, 2013/14), imposing poverty, especially on the farming population on SNL. According to the last household income and expenditure survey of the Central Statistics Office (2010), about 73% of the SNL populace lives below the poverty line.
The country is divide into four administrative districts, Hhohho, Lubombo, Manzini and Shiselweni. Each district has two major towns, with a constellation of shopping centres around the administrative offices.
Data collection
Licensed under Creative Common Page 436 Second, a sectorial outlook was conducted through the focus group technique to map-out beef market channels and to identify the actors involved in each channel. A focus group consists of five to twelve participant working together through in-depth interactive discussion to unearth critical information about a subject or issue of interest (De Ruyter, 1996). This data collection method is generally applied in qualitative research in a wide variety of situations such as marketing and advertisement, market strategies, new product development and in understanding consumer behaviour (Cox et al., 1976; Keown, 1983; Quible, 1998). For purposes of this study, the focus group was composed of ten extension officers that mapped-out the beef value chain in Eswatini. The group discussion was designed and conducted according to the guidelines by Krueger and Casey (2001).
Third, beef unit price data were collected from processors/wholesalers, butcheries and supermarkets using a data collection form. The data were collected from all major beef outlets in all the main towns in the four districts of Eswatini. The prices were monitored from September 2018 to December 2019. Table 1 shows the location, type and number beef outlets from whom shelf price data were collected.
Table 1. Location, type and number of beef outlets used in the study
Region Town Beef outlet Total
Supermarkets Butcheries Processors/
Wholesalers
Hhohho Mbabane 10 8 1 19
Pigg’s Peak 5 2 2 9
Lubombo Siteki 3 5 1 9
Big Bend 2 1 - 3
Manzini Manzini 16 11 4 31
Mankayane 5 4 - 9
Shiselweni Nhlangano 6 11 - 17
Hlatsikhulu 2 2 - 4
Lavumisa 1 - - 1
Total 50 44 8 102
Data analysis
Licensed under Creative Common Page 437 from data, we adopt this method as an umbrella approach to develop the market channel networks within the unorganized livestock market in the study area. The approach came in handy in the identification of bottlenecks, often called themes in psychology, and in making informed adjustment to discern meaningful trends and patterns. In a study related to agriculture, Wood et al. (2014) applied the methodology to analyse the transfer of knowledge among farmers. Tate et al. (2010) used the approach to identify issues emerging from corporate social responsibility reports of selected companies. Furthermore, gross marketing margin and producers’ share were computed from price data to evaluate farmers’ benefit from the different market channels.
Analytical framework
Price transmission analysis, i.e. how the value generated by a product or service is distributed among economic agents (Fernández-Polanco & Llorente, 2019; Lie et al., 2018), was conducted using gross marketing margin and producers’ share analyses to evaluate farmers’ benefit from each market channel. Several studies (Duguma et al., 2013; Legese & Fadiga, 2014; Masuku & Sihlongonyane, 2015; Masuku, 2011; Xaba & Masuku, 2012) have used total gross marketing margins (TGMM) and producers’ share to evaluate the efficiency of value chains in allocating meaningful benefit to farmers.
According to Kidanu (2010), TGMM is the difference between the farm gate price received by the farmer and the price paid by the customer for the final product. It can be understood as an important index that captures the portion of the final commodity value that does not go to the farmer (Ghorbani, 2008). In a cases of multiple economic agents involved in the transformative processes of raw material and logistic transfer of services and final products, TGMM is the sum of gross marketing margin (GMM) that is computed at every stage along the value chain. A wider margin reflects high prices to consumers and low prices to farmers (Masuku & Sihlongonyane, 2015). Hence, GMM is critical in revealing economic actors that benefit the most along the chain.
Licensed under Creative Common Page 438 Market channels that minimize the TGMM are deemed efficient since they narrow the TGMM (Rangasamy & Dhaka, 2008), fairly distributing the end-product value to all actors. Under horizontal integration, GMM is equal TGMM (Xaba & Masuku, 2012). Such channels yield maximum value to farmers since they avoid intermediaries in the value chain. However, where one or more intermediaries are involved in handling the produce, vertical integration, the total gross margin expands, thus reducing the producers’ share. Following Xaba & Masuku (2012), GMM, TGMM and Producers’ share, along each market channel, were computed as follows:
(1)
(2)
(3)
Where:
GMM = Gross Marketing Margin; TGMM = Total Gross Marketing Margin; Pdprice = Producer’s price; Rtlprice = Retail price; Pdshare = Producers’ share.
RESULTS AND DISCUSSION
Description of the beef value chain
Licensed under Creative Common Page 439 Figure 3: A diagrammatical presentation of economic agents involved in beef flow in Eswatini
The second category includes a cluster of marketing channels that involve several economic agents. The economic agents include farmers, ranchers, feedlotters, processors/wholesalers and municipal abattoirs, and retailers (butcheries and supermarkets). From a market integration point of view, the transfer of the beef between several actors resembles coordination between upstream and downstream economic agents (Howard, 2006), noting the processor-feedlotter contractual linkage relationships. Hence, our classification of this category as vertical integration.
Production side
Input supply and services
Licensed under Creative Common Page 440 Recently, the government has provided transport and import permits to enhance the sourcing of hay from South Africa during severe droughts. The government also plays a key role in providing extension services through the Department of Veterinary and Livestock Services (DVLS) of the Ministry of Agriculture. Livestock Veterinary Assistants are deployed at communal dip tanks to ensure parasite and disease monitoring and control. The DVLS also runs district livestock clinics for disease surveillance and control.
SNL cattle production
Generally, SNL farmers source breeding stock from other farmers, government ranches and private breeders. The functional government breeding ranches, Mahlangatsha, Mpisi and Manyonyaneni, also produce high-quality performance-tested bulls that are loaned for 3 years to SNL farmers at a E500 administrative cost (E – Emalangeni, the currency of Eswatini), to improve cattle market value and killing-out percentage. However, the capacity of these ranches is small to inject a meaningful impact into the value chain. Live cattle importation provides an alternative wellspring for breeding stock. To this end, a noted total of 170 cattle were imported for breeding purposes in 2014 (Department of Veterinary and Livestock Services, 2014).
SNL farmers are the main players in the beef value chain, holding 99% of the cattle population and accounting for more than 70% of beef slaughters at the export abattoir (Department of Veterinary and Livestock Services, 2018). However, the notion of wealth preservation and gaining prestige through cattle accumulation supersedes income generation, inducing cattle loss of value and inconstant participation in the value chain. This then erodes value addition potential and initiatives among farmers, thereby eliminating market-oriented production. In turn, this relegates cattle farming into low benefit enterprise, undermining the role of agriculture in poverty alleviation.
Licensed under Creative Common Page 441
TDL cattle production
Cattle production on TDL is characterized by market-orientation, under a high-input-management system. Cattle quality is high due to investment in improved breeding and pasture management practices. The farmers mainly source breeding stock through imports from South Africa and auctions from government breeding ranches. Ranch grazing is coupled with supplementary feeding in winter under control stocking rates and cattle are often sold at peak market value. For these reasons, TDL cattle attain high market value than SNL cattle. This provides market incentives for farmers, through higher economic benefit per herd.
Dairy cattle production
In addition to beef cattle production, beef is also sourced from culled dairy herds. Retired and non-productive dairy cows are disposed of through sales to willing buyer for slaughters. Male calves are also sold to farmers who raise then for slaughter. Often than not, dairy beef is used to meet domestic demand, through home and butchery slaughters, due to its poor quality.
Value addition
Value addition on the production side entails conditioning cattle to enhance market value. Innovations towards such value addition are limited to feedlotting and ranching. These market-oriented practices are aimed at yielding high-quality grade beef for domestic and international markets (Carrer et al., 2013). Although these practices advance farmers’ economic benefit, the adoption rate has been low due to the high-imbedded investment cost. According to (Department of Veterinary and Livestock Services, 2014), feedlotting dates back to the 1980s, but the number of registered feedlots declined from 134 in 2011 to 92 in 2014. Regional consultations confirmed 17 functional feedlots in the Manzini districts in 2018, justifying the position of feedlotters within the beef value.
Licensed under Creative Common Page 442 In a bid to advance market-oriented production and supply of high-quality beef, the government established “sisa” and fattening ranches. Fattening ranches have a dual function; to improve market value through ranch feeding and promote off -take to reduce pasture and land degradation on communal pastures. “Sisa” ranches, on the other hand, accept breeding heifers and cows that are mated with improve bulls under good pasture management to produce high-quality cattle. Culls are transferred to fattening ranches for finishing and auctioning on behalf of the farmer. Such ranching arrangements provide value addition services, on the production side, to promote farmers’ economic benefit during cattle sales. Both types of ranches charge an administrative cost of E30 per herd per month. However, capacity and insufficient government funds have crippled the potenti al of these ranches.
Processing side
Cattle slaughters and beef production
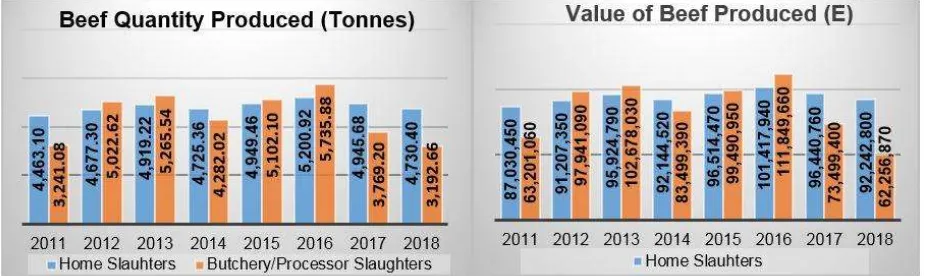
Beef processing begins with cattle slaughters; home slaughters and commercial slaughters through butchery-abattoir and export-oriented slaughters. A total of 4,730.40 tonnes of beef, at a value E92,242,800, were produced through home slaughters from 26,280 herds of cattle sourced from SNL farmers in 2018 (Department of Veterinary and Livestock Services, 2018). Municipal abattoirs and butcheries produced 2,569.68 tonnes of beef from 14,276 cattle at a valued at E50,108,760. The export abattoir yielded 622.98 tonnes from 3,510 slaughters at a minimum valued of E12,148,110. The comparative graphical presentation of the beef quantities and values in Figure 4 reveals that there is no distinct pattern between home slaughter and commercial slaughters. However, the figure unveils the pivotal role played by smallholder farmers in the beef value chain in Eswatini.
Licensed under Creative Common Page 443 Standards of sanitation and inspection are high in abattoir-butchery and export-oriented slaughters, where inspections are critical. Contrary, post-mortem disease inspections are generally practised for home slaughters, raising issues of food safety. This is attributed to the subsistence nature of food production in rural areas and the lack of government budget for home slaughter inspections. After slaughtering, beef from commercial slaughters is cured and stored in preparation for value addition.
Beef value addition
Beef value addition involves initiative activities aimed at improving the beef quality by butcheries and processors in preparation for sales. After slaughtering, dressing and inspection, preservatives and tenderizers are added to dissected carcasses, which are stored in specialized refrigerated rooms to reduce the moisture content through the curing process. Cured butchers’ cuts such as brisket, chuck, stewing beef and fillet are then cut into small beef cuts for sale as fresh meat.
Further value addition initiatives involve the production of beef products such as sausages and burgers. Generally, processing and/or value addition is the missing link in Africa’s value chains. In 2017, a total value of E36,901.71 of processed beef was imported alongside a total of 727,627.55 kg of beef fat from Australia, Argentina, Brazil, South Africa and Uruguay (Department of Veterinary and Livestock Services, 2017).
Marketing side
Beef cattle marketing
Cattle marketing is in a virtual sense, where livestock are transacted through word-of-mouth advertisement and face-face bargaining. The common point of contact between farmers and buyers is at dip tanks, where Veterinary Assistants play a pivotal linkage role. Pricing is predominantly based on eye-judgement considering cattle physical characteristics, except for a few beef processors that utilize apparatus such as weight scales and belts. Otherwise, experience and bargaining power play a central role during sales. However, market imperfection erodes the farmers’ bargaining power when transacting with butcheries’ and processors’ procurement officers, forcing farmers to succumb to mediocre prices.
Licensed under Creative Common Page 444 benefit. This emphasizes the necessity of livestock market organization through the establishment of production systems and pro-poor market channels that ensure fair economic benefit for all economic agents. Otherwise, agriculture will continue to be relegated into a low-income enterprise. Nonetheless, farmers usually gain some bargaining power when dealing with individual buyers that scout cattle for home slaughters. However, such sales take longer, considering the distress nature of cattle sales. Alternativ ely, occasional auctions are organized in strategic areas through government officials or private farms. In cases of highly distressed sale, farmers visit processors and butcheries to offer their cattle for sale.
Beef marketing - wholesaling and retailing
Beef marketing is characterized by elaborate competition between multiple beef outlets. The two popular beef processor-wholesalers are Swaziland Meat Industries (SMI) and Swaziland Meat Wholesalers. Both outlets undertake the wholesale and retail functions, selling to other retailers (butcheries and supermarkets) and operating side retail outlets to consumers. These wholesalers mainly supply retail outlets such as supermarkets (Spar, Pick and Pay, Shoprite, Boxer) and butcheries. SMI is the only entity with an export license, providing access to international markets.
Several butcheries are engaged in beef processing and retailing. These outlets are widespread in rural and urban areas, although rural butcheries are not as consistent in operation as those in urban areas are.
Beef imports and exports
Licensed under Creative Common Page 445
Figure 5: Graphical comparison of domestic beef consumption, production, imports and exports from 2011 to 2018.
Source: Adapted from Department of Veterinary and Livestock Services (2011-2018).
Economic benefit analysis
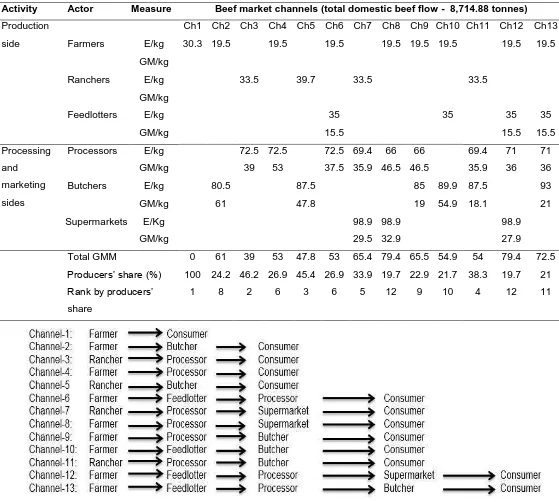
Table 2 presents the market channels through which beef is marketed. The thirteen channels are organised according to the number of economic agents involved, from the least to the highest. Due to the lack of measurement apparatus during sales, the government gazetted lowest local beef carcass grade price of E19.50 per kg was set as farmers’ selling price (Department of Veterinary and Livestock Services, 2011-2018). However, the focus group adjusted farmers’ prices to capture some dynamics in some channels. Channe1 accounted for the gain in farmers’ bargaining power by adjusting the price to E30.30 per kg. Feedlot prices were based on the gazetted price per unit as projected by the Ministry of Agriculture (Ministry of Agriculture, 2015).
Channel 1 awards 100% producers’ share, ranked 1st since farmers sell cattle direct to
consumer for home slaughters. Figure 6 reveals that home slaughters represent the major beef channels compared to beef municipal abattoirs and processors. In 2018, home slaughters accounted for 50% (4,730.40 tonnes) of the domestically produced beef at a value of E92,242,800
Licensed under Creative Common Page 446 Table 2. Beef marketing channels and gross marketing margin analysis
Activity Actor Measure Beef market channels (total domestic beef flow - 8,714.88 tonnes)
Production side
Ch1 Ch2 Ch3 Ch4 Ch5 Ch6 Ch7 Ch8 Ch9 Ch10 Ch11 Ch12 Ch13 Farmers E/kg 30.3 19.5 19.5 19.5 19.5 19.5 19.5 19.5 19.5
GM/kg
Ranchers E/kg 33.5 39.7 33.5 33.5
GM/kg
Feedlotters E/kg 35 35 35 35
GM/kg 15.5 15.5 15.5
Processing and marketing sides
Processors E/kg 72.5 72.5 72.5 69.4 66 66 69.4 71 71 GM/kg 39 53 37.5 35.9 46.5 46.5 35.9 36 36
Butchers E/kg 80.5 87.5 85 89.9 87.5 93
GM/kg 61 47.8 19 54.9 18.1 21
Supermarkets E/Kg 98.9 98.9 98.9
GM/kg 29.5 32.9 27.9
Total GMM 0 61 39 53 47.8 53 65.4 79.4 65.5 54.9 54 79.4 72.5 Producers’ share (%) 100 24.2 46.2 26.9 45.4 26.9 33.9 19.7 22.9 21.7 38.3 19.7 21 Rank by producers’
share
1 8 2 6 3 6 5 12 9 10 4 12 11
Licensed under Creative Common Page 447 Figure 6: Graphical comparison of the proportion of domestically produced beef. Source: Adapted from Department of Veterinary and Livestock Services (2011-2018).
In Channels 2 to 5, the butchers and processors absorb the retail function, thus shortening the market channels. The differences in prices is induced by the value addition function through ranching in Channels 3 and 5. These channels yield higher producers’ share (46.2% and 45.4%) and are ranked 2nd and 3rd, respectively. Ranching is a market-oriented value addition practice applied through fattening, group, “sisa” and TDL ranches. Here selected cattle are conditioned through pasture feeding to improved market value. The unit price mark-up provides sufficient evidence for the economic benefit associated with market-oriented production, compared to Channels 3 and 5. The results also reveal that the ranching function increases the farmer’s share even in longer channels, Channels 7 and 11 (ranked 5th and 4th, respectively). The relatively higher price in Channel 5 (E39.70) is attributed to the higher bargaining power gained by ranchers over butcheries, who often purchase fewer cattle, at a time, compared to processors who usually purchase cattle in larger quantities in Channels 3, 7 and 11.
In addition, feedlotting is found to be another value addition practice on the production side that improves cattle market value in Channels 6, 10, 12 and 13. However, the lowered producers’ share is imposed by the involvement of the butcher and the processor. Feedlotting produces high-quality cattle, for high-quality beef, thereby attracting the involvement of several intermediaries. This increases the retail price, thus increasing the TGMM and lowering producers’ share.
Licensed under Creative Common Page 448 functions. This reveals the “retail power” in commodity pricing under the auspices of commodity branding and franchising. Different franchise supermarkets sell the same commodity at different prices and benefit based on customer brand preference. This further alludes to the importance of retail image in value chain performance and marketing.
Generally, the majority of the beef marketing channels involve three or more economic agents, indicating that longer channels yield producers’ share less than 45%, except Channels 3 and 5. Although this is reflective of more beef value that is not apportioned to the farmer, such channels ensure high standards of food security as meat inspections are conducted before sale. Such channels are also critical for initiatives in value addition and processing of meat into other usable products such as sausages, minced-meat, etc.
CONCLUSIONS
The identified economic agents include farmers, input suppliers, ranchers, feedlotters, processors/wholesalers, butcheries, supermarkets and consumers. The identified bottlenecks are summarised as:
-Low farmers’ bargaining power due to market information asymmetry.
-Poor pasture and breeding management that reduce livestock quality and market value. -Lack of pro-poor market structure that ensures inclusivity through win-win relationships between economic agents in the value chain.
-Cheaper inorganic carcass imports from South Africa. -Lack of investment funds for SNL smallholder farmers.
-Poor adoption of intensive and highly productive systems such as feedlotting. -Low capacity and funds for maintaining government ranches.
-Poor sanitation and standards of food security in home slaughters. -Dwindling rangelands due to human settlement and invasive weeds, and -Recurrent droughts
The results further indicate that longer marketing channels yield lower producers’ share and higher total gross marketing margins. More beef flows through the direct marketing channel of home slaughters.
RECOMMENDATIONS AND IMPLICATIONS
Recommendations FOR FARMERS
Licensed under Creative Common Page 449 Cooperativism enhances resource mobilization required for supporting production and value addition initiatives that increase bargaining power, productivity and economic benefit.
Recommendations For Further Research
The baseline findings of this study unearth several bottlenecks that require further empirical analysis. Addressing these bottleneck is key in empowering farmers to compete well in the value chain, thereby building a vigorous and effective beef market. Effective markets provide incentives for market-oriented production and market participation, which directly improve farmers’ income, rural livelihoods, and national economic growth. Evaluation of the existing feedlotter-processor contractual linkages, especially the 2003 program between feedlotters and the major beef processor, should be awarded research preference to identify and resolve the hurdles to establish win-win linkage relationships.
Policy Implications
Given the general global paradigm shift from horizontal to vertical integration and the centrality of the livestock sector in the economy, the establishment of an organized pro-poor production and marketing structure is critically vital for rural economic growth. Further legislative control and monitoring measures are necessary to exonerate market incentives for farmers. This is imperative for the establishment of functional linkages within farmers and other economic agents to ensure win-win relationships.
Furthermore, a business unusual approach should be considered to re-address cooperativism as a mechanism to advances value addition activities, processing initiatives, and wholesale and retail functions. This is a salient capacitation strategy that can empower farmers to compete successfully in the value chain, thus ameliorating economic benefit and rural livelihoods. Moreover, sufficient human resource for meat inspections during home slaughters should be provided to eliminate the health risk embedded in the high volume of uninspected beef consumed through home slaughters.
REFERENCES
Abafita, J., Atkinson, J., & Kim, C. S. (2016). Smallholder commercialization in Ethiopia: Market orientation and participation. International Food Research Journal, 23(4), 1797-1807. doi:https://search.proquest.com/docview/1805759879?accountid=13204.
Ambe, I. M. (2012). Determining an optimal supply chain strategy. Journal of Transport and Supply Chain Management, 6(1), 126-147.
Behzadi, G., O’Sullivan, M. J., Olsen, T. L., & Zhang, A. (2018). Agribusiness supply chain risk management: A review of quantitative decision models. Omega, 79, 21-42.
Licensed under Creative Common Page 450 Cacciolatti, L., & Lee, S. H. (2016). Revisiting the relationship between marketing capabilities and firm performance: The moderating role of market orientation, marketing strategy and organisational power. Journal of Business Research, 69(12), 5597-5610.
Carrer, M. J., Souza Filho, H. M. d., & Vinholis, M. d. M. B. (2013). Determinants of feedlot adoption by beef cattle farmers in the state of São Paulo. Revista Brasileira de Zootecnia, 42(11), 824-830.
Central Bank of Eswatini. 2016/2017. Annual Report. Mbabane. Ministry of Finance, Government of Eswatini.
Central Bank of Eswatini. 2018/2019. Integrated Annual Report. Mbabane. Ministry of Finance, Government of Eswatini.
Central Intelligence Agency. (2019). The World Factbook. Retrieved December 3, 2019, from https://www.cia.gov/library/publications/the-world-factbook/geos/wz.html
Central Statistics Office. 2010. Swaziland Household Income and Expenditure Survey. Mbabane. Ministry of Economic Planning and Development, Government of Eswatini.
Central Statistics Office. 2018. National Accounts Estimates. Mbabane. Ministry of Economic Planning and Development, Government of Eswatini.
Cox, K. K., Higginbotham, J. B., & Burton, J. (1976). Applications of focus group interviews in marketing. Journal of Marketing, 40(1), 77-80.
De Ruyter, K. (1996). Focus versus nominal group interviews: A comparative analysis. Marketing Intelligence & Planning, 14(6), 44-50.
Department of Veterinary and Livestock Services. (2011). Animal Production Annual Report. Mbabane. Ministry of Agriculture, Government of Eswatini.
Department of Veterinary and Livestock Services. (2012). Animal Production Annual Report. Mbabane. Ministry of Agriculture, Government of Eswatini.
Department of Veterinary and Livestock Services. (2013). Animal Production Annual Report. Mbabane. Ministry of Agriculture, Government of Eswatini.
Department of Veterinary and Livestock Services. (2014). Animal Production Annual Report. Mbabane. Ministry of Agriculture, Government of Eswatini.
Department of Veterinary and Livestock Services. (2015). Animal Production Annual Report. Mbabane. Ministry of Agriculture, Government of Eswatini.
Department of Veterinary and Livestock Services. (2016). Animal Production Annual Report. Mbabane. Ministry of Agriculture, Government of Eswatini.
Department of Veterinary and Livestock Services. (2017). Animal Production Annual Report. Mbabane. Ministry of Agriculture, Government of Eswatini.
Department of Veterinary and Livestock Services. (2018). Animal Production Annual Report. Mbabane. Ministry of Agriculture, Government of Eswatini.
Department of Veterinary and Livestock Services. (2018). Annual Livestock Census. Mbabane. Ministry of Agriculture, Government of Eswatini.
Dizyee, K., Baker, D., & Rich, K. M. (2017). A quantitative value chain analysis of policy options for the beef sector in Botswana. Agricultural Systems, 156, 13-24.
Dlamini, S. I., & Huang, W.-C. (2019). A double hurdle estimation of sales decisions by smallholder beef cattle farmers in Eswatini. Sustainability, 11(19), 5185.
Donovan, J., Franzel, S., Cunha, M., Gyau, A., & Mithöfer, D. (2015). Guides for value chain development: A comparative review. Journal of Agribusiness in Developing and Emerging Economies, 5(1), 2-23.
Duguma, G., Degefa, K., Jembere, T., Temesgen, W., Haile, A., Duncan, A., & Legese, G. (2013). Analysis of sheep value chains in Horro District, Oromia region, Ethiopia. International Livestock Research Institute, 1-46
Dzanja, J., Kapondamgaga, P., & Tchale, H. (2013). Value chain analysis of beef in central and southern Malawi: Case studies of Lilongwe and Chikhwawa Districts. International Journal of Business and Social Science, 4(6), 92-102.
Licensed under Creative Common Page 451 Gainer, B., & Padanyi, P. (2005). The relationship between market-oriented activities and market-oriented culture: Implications for the development of market orientation in non-profit service organizations. Journal of Business Research, 58(6), 854-862.
Gereffi, G., Humphrey, J., & Kaplinsky, R. (2001). Introduction: Globalisation, value chains and development. IDS bulletin, 32(3), 1-8.
Gessesse, A. (2009). Analysis of fruit and vegetable market chains in Alamata, Southern Zone of Tigray: The case of onion, tomato and papaya. Unpublished M.Sc. Thesis. Haramaya Unversity.
Ghorbani, M. (2008). The efficiency of saffron’s marketing channel in Iran. World Applied Sciences Journal, 4(4), 523-527.
Gilbert, C. L. (2006). Value chain analysis and market power in commodity processing with application to the cocoa and coffee sectors. Discussion Paper No. 5. FAO workshop on governance, coordination and distribution along commodity value chains: 4-6 April, Rome, Italy.
Han, J. K., Kim, N., & Srivastava, R. K. (1998). Market orientation and organizational performance: Is innovation a missing link? Journal of Marketing, 62(4), 30-45.
Hellin, J., Lundy, M., & Meijer, M. (2009). Farmer organization, collective action and market access in Meso-America. Food policy, 34(1), 16-22.
Howard, P. (2006). Consolidation in food and agriculture: Implications for farmers & consumers. The Natural Farmer, 2(68), 17-20.
Irvine, R. M. (2015). A conceptual study of value chain analysis as a tool for assessing a veterinary surveillance system for poultry in Great Britain. Agricultural Systems, 135, 143-158.
Keown, C. (1983). Focus group research: Tool for the retailer. Journal of Small Business Management, 21(2), 59. Khoza, E., & Vilane, P. S. (2013). Modern Agriculture (3rd ed.). Oxford University Press. Cape Town, South Africa. Kidanu, E. (2010). Analysis of butter supply chain: The case of Atsbi-Wenberta and Alamata Woredas, Tigray, Ethiopia. Unpublished M.Sc. Thesis. Haramaya University.
Krueger, R. A., & Casey, M. A. (2001). Designing and conducting focus group interviews. Social Development Papers. Paper No. 36. Social Development Family of the World Bank, Washington, D.C, USA.
Lambert, D. M., & Cooper, M. C. (2000). Issues in supply chain management. Industrial Marketing Management, 29(1), 65-83.
Legese, G., & Fadiga, M. (2014). Small ruminant value chain development in Ethiopia: Situation analysis and trends. ICARDA/ILRI Project Report. Nairobi, Kenya: International Center for Agricultural Research in the Dry Areas/International Livestock Research Institute.
Lie, H., Rich, K. M., van der Hoek, R., & Dizyee, K. (2018). An empirical evaluation of policy options for inclusive dairy value chain development in Nicaragua: A system dynamics approach. Agricultural Systems, 164, 193-222.
Liu, S. S., Luo, X., & Shi, Y.-Z. (2003). Market-oriented organizations in an emerging economy: A study of missing links. Journal of Business Research, 56(6), 481-491.
Mabuza, M., Sithole, M., Wale, E., Ortmann, G., & Darroch, M. (2013). Factors influencing the use of alternative land cultivation technologies in Swaziland: Implications for smallholder farming on customary Swazi Nation Land. Land Use Policy, 33, 71-80.
Macfadyen, G., Nasr-Alla, A. M., Al‐Kenawy, D., Fathi, M., Hebicha, H., Diab, A. M., Hussein, S. M., Abou-Zeid, R. M. & El-Naggar, G. (2012). Value-chain analysis: An assessment methodology to estimate Egyptian aquaculture sector performance. Aquaculture, 362, 18-27.
Masuku, M. B. (2011). An analysis of the broiler supply chain in Swaziland: A case study of the Manzini Region. Asian Journal of Agricultural Sciences, 3(6), 492-499.
Masuku, M. B., & Sihlongonyane, M. D. (2015). Economic analysis of the milk supply chain in Swaziland. Food Science and Quality Management, 45(1), 9-17.
Ministry of Agriculture. (2015). Gross Margin for Feedlot in Swaziland. Mbabane. Government of Swaziland.
Ministry of Labour and Social Security. (2013/14). The Swaziland Integrated Labour Force Survey. Mbabane. Government of Swaziland.
Licensed under Creative Common Page 452 Puente-Rodríguez, D., Bos, A. B., & Koerkamp, P. W. G. (2019). Rethinking livestock production systems on the Galápagos Islands: Organizing knowledge-practice interfaces through reflexive interactive design. Environmental Science & Policy, 101, 166-174.
Purcell, S. W., Crona, B. I., Lalavanua, W., & Eriksson, H. (2017). Distribution of economic returns in small-scale fisheries for international markets: A value-chain analysis. Marine Policy, 86, 9-16.
Purnomo, H., Guizol, P., & Muhtaman, D. R. (2009). Governing the teak furniture business: A global value chain system dynamic modelling approach. Environmental Modelling & Software, 24(12), 1391-1401.
Quible, Z. K. (1998). A focus on focus groups. Business Communication Quarterly, 61(2), 28-38.
Rangasamy, N., & Dhaka, J. (2008). Marketing efficiency of dairy products for co-operative and private dairy plants in Tamil Nadu: A comparative analysis. Agricultural Economics Research Review, 21(2), 235-242.
Rich, K. M., Ross, R. B., Baker, A. D., & Negassa, A. (2011). Quantifying value chain analysis in the context of livestock systems in developing countries. Food Policy, 36(2), 214-222.
Rieple, A., & Singh, R. (2010). A value chain analysis of the organic cotton industry: The case of UK retailers and Indian suppliers. Ecological Economics, 69(11), 2292-2302.
Rosales, R. M., Pomeroy, R., Calabio, I. J., Batong, M., Cedo, K., Escara, N., Facunla, V., Gulayan, A., Narvadez, M., Sarahadil, M. (2017). Value chain analysis and small-scale fisheries management. Marine Policy, 83, 11-21. Ruekert, R. W. (1992). Developing a market orientation: An organizational strategy perspective. International Journal of Research in Marketing, 9(3), 225-245.
Şerbănel, C. I. (2015). Romania and its position on the global value chain. An introductive analysis. Procedia Economics and Finance, 27, 136-143.
Stoian, D., Donovan, J., Fisk, J., & Muldoon, M. (2012). Value chain development for rural poverty reduction: A reality check and a warning. Enterprise Development and Microfinance, 23(1), 54-60.
Tate, W. L., Ellram, L. M., & Kirchoff, J. F. (2010). Corporate social responsibility reports: A thematic analysis related to supply chain management. Journal of Supply Chain Management, 46(1), 19-44.
Tefera, S. (2013). Rangeland degradation in semi-arid Swaziland: Effects of dip-tanks on herbaceous vegetation and soil properties. African Journal of Range & Forage Science, 30(3), 127-140.
Tfwala, S. S., Manyatsi, A. M., & Wang, Y.-M. (2012). Assessment of land degradation at Velezizweni, Swaziland. Research Journal of Environmental and Earth Sciences, 4(10), 878-883.
Thwala, M. S. (2011). Analysing the value chain of the family poultry subsector in the Lower Usuthu Project area in Swaziland. Associate Poultry Advisor assignment, for the IFAD. FAO, Rome, Italy.
Tong, Y.-S. (2017). Vertical specialisation or linkage development for agro-commodity value chain upgrading? The case of Malaysian palm oil. Land Use policy, 68, 585-596. doi:https://doi.org/10.1016/j.landusepol.2017.08.020. Wood, B. A., Blair, H. T., Gray, D. I., Kemp, P. D., Kenyon, P. R., Morris, S. T., & Sewell, A. M. (2014). Agricultural science in the wild: A social network analysis of farmer knowledge exchange. PLOS One, 9(8), e105203.doi:10.1371/journal.pone.0105203
World Bank. (2019). World Bank in Eswatini; Overview. Retrieved November 8, from https://www.worldbank.org/en/country/eswatini/overview