Thesis by Don Walker
In Partial Fulfillment of the Requirements for the degree of
Doctor of Philosophy
California Institute of Technology Pasadena, California
2011
Acknowledgements
Mayo. Libby took the time to teach this young guy from a small town how to do research at Caltech. I never felt judged by Libby for being a guy who wasn’t from one the big Ivy league or Tech schools. I always felt like she was confident in my ability. She made feel comfortable in the lab. She always encouraged me and acknowledged my accomplishments.
Next I would like to specifically thank Brian S. Leigh. He was the first person that I felt really welcomed me to Caltech. Brian has been an extremely dedicated friend and colleague. Although our projects never overlapped, he worked on a project similar to mine while pursuing his master’s degree. Brian had a knack for explaining things to me in a way that was easy for me to understand. I cannot thank him enough for taking the time to explain things to me. I also learned a lot from Brian that I dare not put in this thesis, but I want Brian to know that I am extremely thankful for his friendship and scientific advice. I can publicly thank you for one thing and that is introducing me to Team Justice!
I would also like the thank Jay Winkler and Bruce Brunschwig for all their encouragement and guidance. Both Jay and Bruce’s doors were always open. I must admit that when I first met Jay I was extremely intimidated. Lets be honest, Jay’s a big guy and he doesn’t smile. Throughout my graduate career I learned a lot from Jay. I never felt like he doubted my scientific ability and I felt like he respected me as a scientist. From Jay I learned that it’s not all about how smart you are, but how hard you work. For that advice Jay, I thank you. Bruce has always had open ear to my personal troubles as well as my scientific troubles. I must admit that I have never felt like I fit in at Caltech, but Bruce and Jay always made feel like I was part of the team. Whether when they were kind to me or just plain mean, I always knew it was to push me to be a better scientist.
get me wrong, this old guy was hilarious, but I do remember thinking,g “Maybe no one tells this guy to shut up because he is old, or maybe he is crazy.” Later the next day I was on the fourth floor of the BI making copies and I saw this old guy sitting in an office. I looked at the name placard and it said “Harry Gray.” I was shocked. I never thought such a prolific scientist could be such an awesome guy! Through Harry’s personality and scientific wisdom I feel as if I have all the tools necessary to pursue scientific interests outside of Caltech. Harry encouraged me to pursue my doctorate at Caltech while I was doing research with Libby. From the bottom of my heart I would like to thank Harry Gray for believing in me and being there for me through some of the best and worst times of my life. Harry has been extremely understanding and supportive throughout my graduate career.
comic relief for me and I think of them as my own little brothers and I want them to excel at whatever they choose.
pursuing a master’s degree in therapeutic recreation. She did all of this while having a full time job. My little sister is amazing and she inspires.
Abstract
The performance of dye sensitized solar cells (DSSC) was investigated as a
function of electrolyte composition and dye sensitizer. Electrolytes consisting of
increasing concentrations of bromide and tri-bromide effectively increased the current of
DSSCs while conserving an increase in open circuit voltage. Corroles were used to
investigate their efficacy as light absorbers for DSSCs. Electronic spectroscopy of
corroles demonstrated that the spectra of corroles could be red shifted through
β-substitution. Also, the changes in the electronic spectra of corroles was not affected by adsorption to TiO2. Electrochemical data concluded that the functionalization of the
β-positions of the corroles did not significantly affect the corrole’s redox potentials. FTIR spectroscopy confirmed that the corroles were chemically adsorbed onto TiO2.
Photoelectrochemical measurements concluded that the corroles are efficient sensitizers
for DSSCs. A highly efficient corrole utilizing sulfonic acid binding groups was
discovered. Also, a corrole with a malonic acid binding group was 70% as efficient as
Table of Contents
Acknowledgments iii
Abstract x
Table of Contents xi
List of Figures xiii
List of Tables xvii
Chapter I: Introduction 1
Chapter II: Bromide/Tri-Bromide Electrolytes 17
Introduction 18
Experimental 23
Materials 23
Dye Coated Electrodes 26
Electrolyte 27
Photoelectrochemistry 27
Results and Discussion 29
[Os(H2L’)L2]2+ and [Ru(H2L’)2(CN)2]2+ DSSC with a
Bromide/tri-Bromide Electrolyte
29
[Os(H2L’)L2]2+ and [Ru(H2L’)2(CN)2]2+ DSSC Equilibration 37
Bromide vs. Iodide Electrolytes 42
Effect of Lithium Concentration 45
Conclusion 46
Chapter III: Characterization of Corroles 48
Introduction 49
Experimental 53
Synthesis 53
Electronic Spectroscopy 53
IR Spectroscopy 53
Electrochemistry 54
Results and Discussion 56
IR Spectroscopy 71
Electrochemistry 79
Conclusions 91
Chapter IV: Photoelectrochemistry of Corroles 93
Introduction 94
Experimental 98
Materials 98
Dye Coated Electrodes 98
Photoelectrochemistry 99
Spectral Response 100
Results and Discussion 101
Photoelectrochemistry 101
Spectral Response 108
Conclusions 110
Chapter V: Thesis Summary and Future Work 118
List of Figures
Figure 1.1. Spectral irradiance on the surface of Earth at air mass AM 1.5 conditions, which is the amount of solar radiation that strikes the Earth after passing through one and a half atmospheres. This corresponds to a solar zenith angle of 48.2o.
5
Figure 1.2. Schematic of a typical dye sensitized solar cell and its step-by-step operation.
8
Figure 1.3. Absorption spectrum of N3 dye overlapped with the AM 1.5 solar spectrum.
11
Figure 1.4. Diagram illustrating the rate constants involved in electron transport in DSSCs. The solid lines are favorable processes and the dashed lines are deleterious processes. S is any dye sensitizer. TiO2, dye HOMO/LUMO gap, and I-/I3- energy
levels are all positioned in relative potentials to one another in a working DSSC.
12
Figure 1.5. Incident photon to current efficiency of N3 [RuL2(NCS)2] and Black
Dye [RuL’(NCS)3].
13
Figure 1.6. The effects of various nitrogen containing heterocycles on the Voc, Jsc,
ff, and η. The Black Dye was used in these studies.
15
Figure 2.1. Energy diagram demonstrating the theoretical increase in Voc due to using a redox couple that is significantly more positive in potential than I-/I
3- and is
still capable of thermodynamically reducing the oxidized sensitizer (S).
24
Figure 2.2. Custom three-electrode photoelectrochemical cell used to test I-V behavior in DSSCs.
28
Figure 2.3. Current versus potential characteristics of [Os(H2L’)L2]2+ in the
presence of increasing Br-/Br3- concentrations under AM 1.5 solar simulated conditions. All electrolytes contained 1.0M Li+, 20mM pyridine, and 20mM pyridinium trifluoroacetate.
31
Figure 2.4. Current versus potential characteristics of [Os(H2L’)L2]2+ in the
presence of increasing Br-/Br3- concentrations under AM 1.5 solar simulated conditions. All electrolytes contained 1.0M Li+, 20mM pyridine, and 20mM pyridinium trifluoroacetate.
Figure 2.5. Current versus potential curves of [Os(H2L’)L2]2+ taken over time until
the cell equilibrated. The electrolyte used was 0.5M LiBr, 0.04M Br2, 0.5M
LiClO4, 20mM pyridine, and 20mM pyridinium trifluoroacetate in acetonitrile.
38
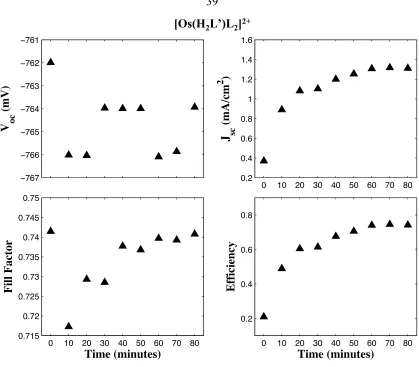
Figure 2.6. Plot of short circuit current, open circuit voltage, fill factor, and efficiency versus time for [Os(H2L’)L2]2+. The electrolyte used was 0.5M LiBr,
0.04M Br2, 0.5M LiClO4, 20mM pyridine, and 20mM pyridinium trifluoroacetate
in acetonitrile.
39
Figure 2.7. Current versus potential curves of [Ru(H2L’)2(CN)2]2+ taken over time
until the cell equilibrated. The electrolyte used was 0.5M LiBr, 0.04M Br2, 0.5M
LiClO4, 20mM pyridine, and 20mM pyridinium trifluoroacetate in acetonitrile.
40
Figure 2.8. Plot of short circuit current, open circuit voltage, fill factor, and efficiency versus time for [Ru(H2L’)2(CN)2]2+. The electrolyte used was 0.5M
LiBr, 0.04M Br2, 0.5M LiClO4, 20mM pyridine, and 20mM pyridinium
trifluoroacetate in acetonitrile.
41
Figure 3.1. Analysis of corrole publication history since the first corrole synthesis publication in 1965. In 1999 Gross and Paolesse developed a more facile corrole synthesis, which is the reason behind the boom in corrole publications after 1999.
52
Figure 3.2. Structures of all corroles used in this study. 55 Figure 3.3. Absorbance spectra of sulfonated corroles in acetonitrile. Spectra
were normalized at the Soret band.
59
Figure 3.4. Absorbance spectra of gallium corroles in acetonitrile. Spectra were normalized at the Soret band.
60
Figure 3.5. Absorbance spectra of aluminum corroles in acetonitrile. Spectra were normalized at the Soret band.
61
Figure 3.6. Absorbance spectra comparing the effect of aluminum and gallium for mono-COOH substituted tpfc. Spectra were taken in acetonitrile and normalized at the Soret band.
62
Figure 3.7. Absorbance spectra comparing the effect of aluminum and gallium for mono-CN COOH substituted tpfc. Spectra were taken in acetonitrile and
normalized at the Soret band.
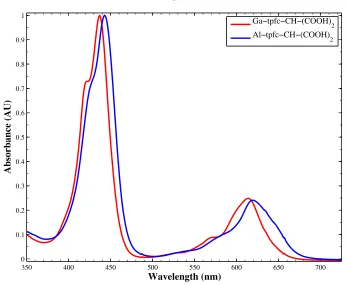
Figure 3.8. Absorbance spectra comparing the effect of aluminum and gallium for mono-CH-(COOH)2 substituted tpfc. Spectra were taken in acetonitrile and
normalized at the Soret band.
64
Figure 3.9. Absorbance spectra of sulfonated corroles adsorbed on TiO2. Spectra
were in air and normalized at the Soret band.
65
Figure 3.10. Absorbance spectra of gallium corroles adsorbed on TiO2. Spectra
were in air and normalized at the Soret band.
66
Figure 3.11. Absorbance spectra of aluminum corroles adsorbed on TiO2. Spectra
were in air and normalized at the Soret band.
67
Figure 3.12. Absorbance spectra comparing the effect of aluminum and gallium for mono-COOH substituted tpfc. Spectra were taken in air and normalized at the Soret band.
68
Figure 3.13. Absorbance spectra comparing the effect of aluminum and gallium for mono-CN-COOH substituted tpfc. Spectra were taken in air and normalized at the Soret band.
69
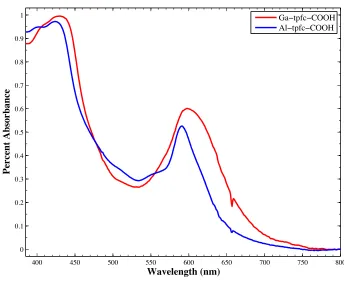
Figure 3.14. Absorbance spectra comparing the effect of aluminum and gallium for mono-CH-(COOH)2 substituted tpfc. Spectra were taken in acetonitrile and
normalized at the Soret band.
70
Figure 3.15. FT-IR spectra of N3 dye a.) in dry, powdered form, and b.) adsorbed onto TiO2.
73
Figure 3.16. FT-IR spectra of Ga-CN-COOH dye a.) in dry, powdered form, and b.) adsorbed onto TiO2.
74
Figure 3.17. FT-IR spectra of Ga-tpfc-COOH a.) in dry, powdered form, and b.) adsorbed onto TiO2.
75
Figure 3.18. FT-IR spectra of Ga-tpfc-(COOH)2 a.) in dry, powdered form, and b.)
adsorbed onto TiO2.
76
Figure 3.19. FT-IR spectra of Ga-tpfc-CH-(COOH)2 a.) in dry, powdered form,
and b.) adsorbed onto TiO2.
77
Figure 3.20. FT-IR spectra of Ga-tpfc-(SO3H)2 a.) in dry, powdered form, and b.)
adsorbed onto TiO2.
Figure 3.21. Cyclic voltammetry (red) and differential pulse voltammetry (blue) of Ga-tpfc-(SO3H)2.
82
Figure 3.22. Cyclic voltammetry (red) and differential pulse voltammetry (blue) of Ga-tpfc-COOH.
83
Figure 3.23. Cyclic voltammetry (red) and differential pulse voltammetry (blue) of Ga-tpfc-(COOH)2.
84
Figure 3.24. Cyclic voltammetry (red) and differential pulse voltammetry (blue) of Ga-tpfc-CN-COOH.
85
Figure 3.25. Cyclic voltammetry (red) and differential pulse voltammetry (blue) of Ga-tpfc-CH-(COOH)2.
86
Figure 3.26. Cyclic voltammetry (red) and differential pulse voltammetry (blue) of Ga-tpfc-(SO3H)2.
87
Figure 3.27. Cyclic voltammetry (red) and differential pulse voltammetry (blue) of Al-tpfc-COOH.
88
Figure 3.28. Cyclic voltammetry (red) and differential pulse voltammetry (blue) of Al-tpfc-CN-COOH.
89
Figure 3.29. Cyclic voltammetry (red) and differential pulse voltammetry (blue) of Al-tpfc-CH-COOH.
90
Figure 4.1. Current versus potential characteristics of corroles with sulfonic acid moieties.
105
Figure 4.2. Current versus potential characteristics of gallium corroles. 106 Figure 4.3. Current versus potential characteristics of aluminum corroles. 107 Figure 4.4. Incident photon to current conversion efficiency of corroles containing sulfonic acid moieties.
112
Figure 4.5. Incident photon to current conversion efficiency of gallium corroles. 113 Figure 4.6. Incident photon to current conversion efficiency of aluminum corroles. 114 Figure 4.7. Absorbed photon to current efficient of corroles with sulfonic acid
moieties.
115
Figure 4.8. Absorbed photon to current conversion efficiency of gallium corroles. 116 Figure 4.9. Absorbed photon to current conversion efficiency of aluminum
corroles.
List of Tables
Table 2.1. Compiled results comparing I-/I3- and Br-/Br3- electrolytes for a series
of dyes. L’ = 4,4’-dicarboxylic acid-2,2’-bipyridine, and L = 2,2’-bypridine.
25
Table 2.2. All electrolytes contained 1.0M Li+, 20mM pyridine, and 20mM pyridinium trifluoroacetate.
32
Table 2.3. All electrolytes contained 1.0M Li+, 20mM pyridine, and 20mM pyridinium trifluoroacetate.
36
Table 2.4. All electrolytes contained 20mM pyridine and 20mM pyridinium triflouroacetate. The I-/I3- electrolyte contained 0.5M LiI and 0.04M I2 and the
Br-/Br3- electrolyte contained 0.5M LiBr and 0.04Br2.
44
Table 3.1. Tabulated 1st, 2nd, and 3rd oxidation peaks as determined by differential pulse voltammetry. All potentials are referenced to a standard calomel electrode.
81
Table 4.1. Short circuit currents estimated by using the absorptions spectra of corroles absorbed to TiO2 and Equation 4.1.
96
Table 4.2. Jsc, Voc, fill factors, and efficiency of corroles. 103
Chapter 1
The need for inexpensive, clean energy is increasing everyday. As more and
more countries develop and the world’s population increases, the need to power the world
increases. One of the most promising sources of energy for powering the planet is solar
energy. Approximately 120,000 terawatts (TW) of solar energy strike the earth everyday.
Considering that as of 2008 the current world energy consumption is approximately 15
TW, the sun is a huge, untapped resource. Currently, only 0.05% of the world’s energy
production is from solar energy.1 This brings us to the question, “Why are we not using
the sun to power the planet?” The basic fundamental answer to the question as to why
the world isn’t using solar energy is cost. Solar energy is relatively more expensive than
conventional means of energy, such as coal and fossil fuels. According to the California
levelized energy costs, in 2007 the cost of electricity produced by coal was 0.074-0.088
cents per kilowatt hour, and the cost of solar electricity was 0.116 – 0.312 cents per
kilowatt hour.2 Although these costs are for electricity production in California, the high
cost of solar energy explains why 80 to 90 percent of the world’s energy comes from
fossil fuels.3
In order to overcome such high costs, solar cells must either be made from
cheaper materials, or become more efficient. In order to be as efficient as possible a solar
cell must be able to make efficient use of the solar spectrum (Figure 1.1). The region
between 400 and 1100 has the highest photon density in the AM 1.5 solar spectrum. A
material that can absorb sunlight between 400 and 1000nm would be the ideal absorber.
Silicon solar cells accomplish this task, because silicon’s bandgap is 1.1 eV. Silicon
solar cells’ small bandgap allows it to absorb light up to 1100nm. The most efficient
different semiconductors that absorb three overlapping regions of the visible solar
spectrum. Silicon solar cells have achieved efficiencies of ≈20%, and multijunction solar
cells have achieved efficiencies of up to ≈40%.4, 5 Although silicon and multijunction
solar cells are very efficient at converting sunlight to electricity, their energy conversion
efficiency doesn’t reduce cost of the materials and construction in a such a way that they
are competitive in price to fossil fuels.
Solar energy is expensive because the most promising and efficient devices are
constructed from extremely pure materials. The most commonly available, efficient solar
cells are based on silicon. Silicon is very abundant, making up 25.7 percent of the earth’s
crust by mass. Even though the element silicon is very abundant, a significant amount of
refining is required for solar cell grade silicon. For silicon to be effectively used in solar
cells it needs to be pure to parts per billion. To produce monocyrstalline silicon, raw
silicon must be refined to metallurgical grade silicon, then refined to semiconductor
grade silicon, and further refined by the Czochralski process, creating a large single
crystal of silicon. Each process requires the silicon be heated to between 1000oC and
1900oC, depending on the process. Finally, once the silicon ingots are made they are cut
into wafers and polished which destroys approximately 50% of the silicon. All these
processes increase the cost of silicon solar cells. Multijunction solar cells can cost up to
eight times as much as silicon solar cells. Multijunction solar cells’ increased costs are
due to their use of rare and hard to process materials such as gallium, indium, and
germanium. They suffer from the same expensive processing as do silicon solar cells and
cells. In order to make solar energy more economically viable, efficient alternatives must
be investigated.
A promising alternative to silicon and multijunction solar cells are dye sensitized
solar cells (DSSC). DSSCs have the potential to be as efficient as silicon solar cells, but
at a fraction of the cost of silicon and multijunction solar cells. Currently, the most
efficient DSSC is 11.1% with a theoretical efficiency ≈31%.6-8 DSSCs have the potential
to be far cheaper than crystalline silicon and multijunction solar cells, primarily due to
their abundant use of inexpensive materials. DSSCs are typically constructed with a glass
counter electrode that is coated with a thin layer of platinum, a working electrode that is
composed of anatase, nanocrystalline TiO2 deposited on a fluorine doped SnO (F:SnO)
glass slide, and a dye sensitizer (Figure 1.2). Because TiO2 is a wide band gap
semiconductor (Ebg≈3.2eV), TiO2 cannot efficiently absorb the solar spectrum.9, 10 Dyes
are attached to the surface of TiO2 and serve as the light absorbers. The most efficient
dyes are based on ruthenium polypyridyl compounds, but dyes ranging from porphyrins,
organic, and other metal-based polypyridyl compounds have been used.11-20 Dyes are
chemisorbed to TiO2 through the use of carboxylic, sulfonic, and phosphonic acid
groups.21-23 Because films of anatase nanocrystalline TiO2 are used, an approximate 1000
fold increase in surface area is achieved when compared to a planar single crystal. Such
an increase in surface area allows for a considerable amount of dye to be loaded onto a
cell, which in turn makes for a thin and efficient solar cell. The basic principle of
operation of DSSCs can be seen in Figure 1.2. In step 1 the dye molecule is excited by
light. The electron in the ground state is excited to a higher energy state that is more
Figure 1.1. Spectral irradiance on the surface of Earth at air mass AM 1.5 conditions,
which is the amount of solar radiation that strikes the Earth after passing through one and
a half atmospheres. This corresponds to a solar zenith angle of 48.2o.
0
500
1000
1500
2000
2500
0
0.5
1
1.5
Spectral Irradiance W m
2
nm
!
1
excited electron is then transferred to the semiconductor nanoparticle in step 2. Step 2 is
known as electron injection, and the rate of injection typically occurs on the order of
femtoseconds to picoseconds.24-26 In dye sensitized solar cells there is also a redox
couple that reduces the oxidized form of the dye after electron transfer to the TiO2
nanoparticle. This process is known as regeneration and is step 3. Regeneration occurs
on the order of nanoseconds. The rate is limited to the order of <10-9s because redox
couples in dye sensitized solar cells are in solution; therefore, the regeneration rate is
diffusion limited at 10-9s.27,28 By reducing the dye in the regeneration step after injection,
the positive charge, or hole, is now moved to the redox couple, which creates greater
charge separation between the hole and electron. The counter electrode then reduces the
redox couple in step 4. Finally, in step 5, the electron will travel through the nanoparticle
interface to a conducting electrode, along the way doing work, and end is up on the
counter electrode where the process repeats itself.
As the photogenerated electron travels through the DSSC, it can recombine with
the photogenerated hole at several places along its path (Figure 1.3). The careful balance
of forward, advantageous electron transfer processes with the reverse, deleterious
electron transfer processes prevents the electron from recombining with the hole. The
initial rate of light absorption (k1) is extremely fast. After absorption the electron can
deactivate (k-1). The k-1 process is determined by the radiative and non-radiative decay of
the excited electron. After k1, electron injection (k2) occurs on the order of femtoseconds
to picoseconds. It has been determined in the highly efficient DSSC containing
Ru(4,4’-dicarboxy-2,2’-bipyridine)2(NCS)2 or N3 dye that injection occurs from the excited,
when the electron is in the conduction band of TiO2, the electron can recombine with the
chemisorbed dye sensitizer (k3). In efficient DSSCs, the k3 process is typically >10-6s.29,
30 The k
3 process is in direct competition with the regeneration (k5) process, which
occurs at the diffusion limit of 10-9s in the case of using I- as the reducing agent. The
electron can also recombine with redox species in solution (k4). In the presence of the
commonly used I-/I3- electrolyte k4 occurs on the order of ≈10-3s.31 The careful control
of these rates is one of the factors that leads to efficient dye sensitized solar cells.
Optimization of the kinetic factors ultimately leads to the increased currents in
DSSCs. The efficiency (η) of a DSSC is determined by the ratio of the power of the
DSSC (PDSSC) to the power of the incident light (Pin) (Equation 1.1). The power of the
DSSC is determined by the short circuit current density (Jsc), open circuit voltage (Voc),
and fill factor (ff). The short circuit current density is given by the current measured at
short circuit conditions, or the current measured when there is zero applied voltage. The
open circuit voltage is the voltage measured when the cell is at open circuit, or the
voltage that is applied to produce zero current. The fill factor is simply the ratio of the
measured power of the solar cell from the current-voltage curves to the maximal
theoretical power of the solar cell. An ideal fill factor, or the measure of how similar the
solar cell is to this theoretical maximum, would be 1. The fill factor is mostly determined
by the kinetic factors of the solar cell. If recombination is high then the fill factor will be
low, and if there is little to no recombination the ff will be near unity, but in efficient
solar cells the ff is ≈0.6-0.8. Therefore, in kinetically optimized solar cells there is not
kinetics of the solar cell are favorable. It can be concluded that by increasing the Jsc, Voc,
or ff one can increase the η.
€
η= PDSSC Pin =
JscVocff
Pin Eq. 1.1
Short circuit current density is dependent on a given dye’s efficiency to convert
photons to electrons in DSSCs as well as the overlap of the dye sensitizer’s absorption
spectrum with the solar spectrum (Figure 1.3). In order for a dye to efficiently convert
light to electricity in DSSCs, several thermodynamic and kinetic requirements must be
met (Figure 1.4). First, the excited state potential, or lowest unoccupied molecular orbital
(LUMO), must be more negative in potential than the conduction band edge (Ecb) of
TiO2. This makes the injection process thermodynamically favorable. Also, the dye
must be in good electrical and chemical contact with the TiO2 to allow for efficient
injection of photogenerated electrons. In addition to proper matching of the LUMO of a
dye with Ecb of TiO2, the ground state potential, or highest occupied molecular orbital
(HOMO), of the dye sensitized must be more positive than the potential of the redox
species. This allows regeneration of the oxidized dye to be thermodynamically favorable.
Finally, the band gap of the dye, or HOMO-LUMO gap, must be as small as possible,
while still maintaining a LUMO that is more negative than the Ecb and HOMO that is
more positive than the redox species. When the thermodynamics are well balanced to
allow for favorable kinetics, optimal current can be obtained. The HOMO-LUMO gap of
the dye sensitizer determines spectral range of light that it can absorb. By decreasing the
HOMO-LUMO gap, the dye can absorb more red photons, thus increasing its spectral
overlap. One example of demonstrating increased current and efficiency in DSSCs
[tris(isothiocyanato)-ruthenium(II)-2,2':6',2"-terpyridine-4,4',4"-tricarboxylic acid]. The photocurrent action
spectra, or external quantum yield, displayed in Figure 1.5 demonstrates that both the N3
and Black Dye have close to ≈80% efficient conversion of incident light from 420nm to
about 650nm, but the Black Dye has significantly higher light conversion affiances above
650nm than the N3 dye. Because of the increased spectral overlap of the Black Dye, the
efficiency increased from 10% in the N3 sample to 10.4% in the Black Dye. The
increased efficiency is attributed to the Black Dye having 3mA/cm2 more short circuit
current than the N3. Although the increase in efficiency and current is small, the Black
Dye demonstrates that increasing the spectral overlap of a dye molecule with the solar
spectrum can increase efficiency of DSSCs.
The open circuit voltage (Voc) of DSSCs is determined by the difference in
potential between the redox couple and the conduction band edge of TiO2. The
theoretical maximum between Voc is ≈1.1V, but in the most efficient DSSCs the most
photovoltage that has been obtained is ≈0.72V.32,33 There are two methods for increasing
the open circuit voltage: 1.) Make the conduction band edge of TiO2 more negative, and
2.) use alternative redox couples with more positive potentials. In order to move the
conduction band edge of TiO2 more negative, one must be careful not to make the
conduction band edge more negative than the excited state potential of the adsorbed dye
as this would prevent injection of photoexcited electrons. One method that can be used to
move the conduction band edge of TiO2 to more negative potentials is by
using the Nernstian dependence of the conduction band edge potential on the electrolyte
proton concentration in aqueous solutions.34-36 Since most DSSCs are in non-aqueous
Figure 1.4. Diagram illustrating the rate constants involved in electron transport in
DSSCs. The solid lines are favorable processes and the dashed lines are deleterious
processes. S is any dye sensitizer. TiO2, dye HOMO/LUMO gap, and I-/I3- energy levels
are all positioned in relative potentials to one another in a working DSSC.
S/S
+Figure 1.5. Incident photon to current efficiency of N3 [RuL2(NCS)2] and Black Dye
energy of the TiO2 conduction band edge . A variety of nitrogen containing heterocycles,
of varying pKa, have been used in DSSCs to varying success in DSSCs to increase open
circuit voltages. The most significant improvements in Voc have been made by the use of
the nitrogen containing heterocycle 4-tert-butlypyridine (TBP). TBP has improved the
efficiency of the N3 and coumarin dyes in DSSCs by increasing the Voc without any
significant decreases in the Jsc.11, 37 By using IMVS, Frank et al. were able to determine
that TBP makes the conduction band of TiO2 more negative, which results in a larger
photovoltage.38 Since the discovery of the effect that nitrogen containing heterocycles
have on the Voc of DSSCs, several studies have been conducted to compare the effects of
several nitrogen containing heterocycles on the Voc, Jsc, ff, and η (Figure 1.6).39 Even
though these studies show that nitrogen containing heterocycles affect the Voc, Jsc, ff, and
η, it is still not completely clear if the changes in the Voc, Jsc, ff, and η are due to the
nitrogen containing heterocycles adsorbing to the surface, which could affect the
recombination and escape rates, or if the increases and decreases in the Voc, Jsc, ff, and η
are simply due to moving the conduction band edge. Also, because the system is in a
non-aqueous environment, it makes it even more difficult to predict the effects of these
additives on the conduction band energy of TiO2.
Changing the redox couple to one that is more positive in potential can also
modify open circuit voltage. There have been many unsuccessful attempts at using
alternative redox couples of varying potentials.40-43 It is not enough to have a redox
couple that is more positive in potential to increase the open circuit voltage. The redox
couple cannot be more positive than the ground state redox potential of the adsorbed dye.
Figure 1.6. The effects of various nitrogen containing heterocycles on the Voc, Jsc, ff, and
thermodynamically favorable and efficient regeneration of the oxidized will not occur.
Also, in order for the redox to operate efficiently, the electron transfer kinetics must be
favorable. The redox couple must have slow electron transfer rates with TiO2 surface and
fast electron transfer rates with the oxidized dye. In I-/I3- electrolytes the electron transfer
between the TiO2 surface and the redox couple is slow, but for a redox couple such as
ferrocene/ferrocennium the electron transfer with the TiO2 surface is much faster.41 Also,
the regeneration rate must be at or near the diffusion limit to prevent recombination. An
efficient redox couple must effectively kill two birds with one stone.
Since the development of an efficient dye sensitized TiO2 solar cell pioneered by
O'Regan and Grätzel, the most efficient dyes have been the well-known N3 dye, which
obtained an efficiency of 10% in 1993.11, 27 There has only been a 1.1% improvement in
the efficiency of dye sensitized solar cells. In order to further improve DSSCs, a greater
understanding of the fundamental parameters are needed to improve the performance of
DSSCs. Careful experimentation and demonstration of the factors that can improve solar
cell performance, such as alternate redox couples and spectral overlap, are the central
focus of this thesis. Through optimization of alternative redox couples greater currents
and open circuit voltages can be obtained. Also, by using a different class of dye
molecules spectral overlap can be increased to improve currents and ultimately
Chapter 2
Introduction
The most efficient DSSCs to date operate in a liquid electrolyte containing I-/I3
-redox couple. The I-/I
3- redox couple is extremely important in DSSCs as can be seen in
Figure 1.2. The I-/I3- redox couple is directly involved in several processes, such as
regeneration, recombination, escape, and shuttling the hole to the counter electrode. The
I-/I3- redox couple is used in the most efficient DSSCs, because it provides a unique
platform to control four separate processes. The I-/I3- redox couple provides a key kinetic
and thermodynamic balance to DSSCs. There have been many efforts to try and better
optimize the regeneration, recombination, escape, and hole transport to the counter
electrode through the use of several organic and inorganic redox couples.42-47 When
outer sphere redox couples, such as ferrocene/ferricinium, are used, low photovoltages
and photocurrents are observed. This is due to an increase in the recombination rate.
When k4 approaches k5, photovoltages and photocurrents decrease, because the injected
electrons now start to recombine from the TiO2 to the redox couple, instead of
perchalating to the back F:SnO contact and performing work.
The I-/I3- redox couple works efficiently in DSSCs for several reasons. For one,
two electrons are required to reduce I3- to I-. The reduction can happen at the TiO2
surface and the back platinum counter electrode. The I-/I
3- redox couple works so well in
TiO2 systems because the two-electron reduction at TiO2 surface is orders of magnitude
slower than the same two-electron reduction of tri-iodide at the back platinum counter
electrode. The fast kinetics of tri-iodide with the back counter electrode is believed to be
due to electrocatalysis via dissociative chemisorption of I2. Also, the strong adsorption of
contaminant.48 Fast outer sphere redox couples and the many other organic and inorganic
redox couples may not adsorb as well to platinum as the I-/I3- redox couple, which
reduces the rate of reduction of the redox couple. Also, the rate of reduction of redox
couples other than the I-/I3- redox couple may have been faster with the TiO2 than
platinum. In order for a redox couple to properly mediate the electron transfer processes
in DSSCs, the redox couple must sufficiently retard the escape process, but still facilitate
fast electron transfer between the platinum counter electrode and the adsorbed dye
sensitizer.
Only two redox couples over almost 20 years of research have showed any results
close to the I-/I3- redox couple: A 5-mercapto-1-methyltetrazole ion with the dimmer of
5-mercapto-1-methyltetrazole ion (T-/T2) and a
tris(4,4‘-di-tert-butyl-2,2‘-dipyridyl)cobalt(II/III) perchlorate (CoII/CoIII).48, 49 These two redox couples have
yielded efficient DSSCs. Both of the redox couples essentially accomplish this by
retarding the k4 better than the I-/I3- redox couple. Due to the reduction in k4 an increase
in current was observed in DSSCs containing these electrolytes electrolyte.
Improvements were minimal and at best the redox couples only matched the efficiency of
DSSCs with an I-/I3- redox couple. Although the currents were increased the
photovoltages were generally lower for the CoII/CoIII redox couple. The CoII/CoIII redox
couple is 0.331V vs. NHE and is close to the redox potential of the I-/I3- redox couple,
which is approximately 0.350V vs. NHE.40, 50 Although the redox potential of the
CoII/CoIII redox couple and the I-/I3- redox couple are close, there is a 200mV difference
in the Voc produced in DSSCs. Such a difference implies that the kinetics of the
compared to DSSCs with an I-/I3- redox couple. The Voc of the T-/T2 redox couple was
similar to that of the I-/I3- redox couple. The Jsc in the T-/T2 redox couple was about 20%
higher but the ff was 25% lower when compared to the control cell containing an I-/I 3
-redox couple. The differences in the Jsc can possibly be attributed more to the electrolyte
composition than the redox couple. In the DSSC with a T-/T2 redox couple lithium was
used and in the control cell with I-/I3- redox couple, 1,3-dimethylimidazolium iodide
(DMII) was used with no lithium. The addition of lithium is known have significant
effects on the performance of DSSCs. Such a difference in the electrolyte composition
could explain the increased photocurrent in T-/T2 redox couple. The decreased fill factor
is most likely due to increased recombination of electrons in the TiO2 with the T-/T2
redox couple. The CoII/CoIII and T-/T2 redox couple have provided the field of DSSCs
with potential alternative redox couples but no significant increases in efficiencies have
been noted due the use of these redox couples.
Most alternative redox couples fail because they do not possess the unique
electron transfer properties as observed in the I-/I3- redox couple. The reduction of the
dye by iodide is extremely fast in DSSCs and approaches the solution diffusion limit of
10-9s, but this regeneration process is in competition with the reduction of tri-iodide by
the electrons in the conduction band. Reduction of the tri-iodide is generally accepted to
occur according to Equation 2. The net reaction in Equation 2.1 can occur either by a
second or
€
2e−
+I3−
→3I− Eq. 2.1
first order mechanism in respect to I2. The second order mechanism is believed to
iodide and iodine with a rate constant of ≈ 10-7 mol dm-3.52 Iodine then can accept an
electron from the conduction band of TiO2 or from the platinum electron to form
€
I2−•. If
Eq. 2.3 is in equilibrium the net reaction will be first or second order in I2 depending on if
5a or 5b is dominant. If Eq. 4 is the rate-determining step then the net reaction is first
order in the electron and first order in I2.
€
I3
−
⇔I2+I
− Eq. 2.2
€
I2+e
− ⇔I2
−• Eq. 2.3
€
I2−•
→I3−
+I− Eq. 2.4a
€
I2
−•
+e−
→2I− Eq. 2.4b
Equations 2.5 and 2.6 express another possible first order mechanism by which
the reduction of tri-iodide can occur. In Eq. 2.5 the electron for either the conduction
band or platinum counter electrode causes the I2 to dissociate, which leaves an adsorbed
iodide (Iads) on either the platinum or TiO2. This Iads can then rapidly accept an electron
to produce another I-. The two pathways on which tri-iodide can proceed have been
investigated rigorously in the literature and there is still much debate on the specific
pathway that the net reaction in Eq. 2.1 proceeds upon. But it can be concluded that the
pathway that the reduction of tri-iodide takes is very slow, due to its two-electron
reduction, and this is one of the reasons why the I-/I3- redox couple is the gold standard in
efficient DSSCs.
€
I3−
⇔I2+I− Eq. 2.2
€
I2+e
−
⇔Iads+I
− Eq. 2.5
€
I2+e−
→I− Eq. 2.6
The low photovoltages produced in DSSCs has been attributed to the I-/I3- redox couple.
couple to one that has the same two-electron reduction pathway and equilibrium constant
would be a reasonable place to start. One such redox couple is the bromide/tri-bromide
redox couple. The Br-/Br
3- redox couple should have the same kinetics as the I-/I3- redox
couple, but with a much larger redox potential (≈0.420V). Such a large redox potential
should increase the Voc considerably while still maintaining excellent regeneration
kinetics and retarded k4 rates (Figure 2.1). The Br-/Br3- redox couple has been shown to
increase the Voc of an eosin Y and several ruthenium polypyridyl dyes significantly
enough to increase the efficiency of these cells when compared to similar cells in the
presence of an I-/I3- redox couple.53, 54 The results of a series of dyes tested by Elizabeth
Mayo are summarized in Table 2.1. For the DSSCs in a Br-/Br3- electrolyte with
[Os(H2L’)2(CN)2]2+ and [Os(H2L’)L2]2+ (L’ = 4,4’-dicarboxylic acid-2,2’-bipyridine, and
L = 2,2’-bypridine) dyes, the efficiencies were less than the comparable I-/I3- electrolyte.
The DSSCs with [Ru(H2L’)2(CN)2]2+ as the adsorbed sensitizer demonstrated the same
efficiency as comparable cells with I-/I3- electrolyte. The dyes
[Os(H2L’)2(CN)2]2+,[Os(H2L’)L2]2+, and [Ru(H2L’)2(CN)2]2+ all had increased
photovoltages, but they all had reduced photocurrents. The data for N3 in a Br-/Br3
-electrolyte is not reported because it did not produce any photocurrent or photovoltage.
The reason for this is that the N3 ground state redox potential (0.68V) is too close in
potential to the redox potential of the Br-/Br3- redox couple (0.44V). Although there is a
0.240V over-potential it is not enough to drive the reduction of the oxidized N3. The
amount of over-potential may explain the reduced photocurrents seen in the
[Os(H2L’)2(CN)2]2+,[Os(H2L’)L2]2+, and [Ru(H2L’)2(CN)2]2+ dyes, because their ground
The two dyes [Ru(H2L’)L2]2+ and [Ru(H2L’)3]2+ demonstrated increased
efficiencies, 24hrs under vacuum. Iodine (Sigma-Aldrich, ≥99.8%, solid, ACS reagent)
was sublimed because not only was the Voc significantly increased but also the Jsc was
maintained at or near the same levels as in comparable DSSCs with an I-/I3- electrolyte.
The decreased currents in [Os(H2L’)2(CN)2]2+,[Os(H2L’)L2]2+, and [Ru(H2L’)2(CN)2]2+
can possibly be increased with the introduction of more bromide. Because the rate of
reduction of oxidized dye is first order, increasing the concentration of bromide will
increase the rate of reduction of oxidized dye. Also, if the ratio of bromide to tri-bromide
is maintained, the Voc should remain constant. The experiments conducted in this chapter
seek to improve photocurrents in DSSCs containing a Br-/Br3- electrolyte.
Experimental
Materials
Acetonitrile (Sigma-Aldrich, 99.8% anhydrous), ethanol (Decon Laboratories,
Inc., 200 proof), lithium bromide (Sigma-Aldrich, 99.9% anhydrous beads), bromine
(Aldrich, 99.99%), titanium tetrachloride (Fluka, ≥99.8%), lithium iodide (99.9%
anhydrous beads), and pyridine (Sigma-Aldrich, 99.8% anhydrous) were all used as
received. Lithium perchlorate (Sigma-Aldrich, ≥95.0%) was dried by fusing at 240oC
over a sand bath and under vacuum. Pyridinium trifluoroacetate (Sigma-Aldrich, 98%)
was purified by dissolving and supersaturating it in acetonitrile. The pyridinium
trifluoroacetate salt was precipitated by addition diethyl ether. The precipitate was then
filtered through a medium-porosity glass frit, rinsed with diethyl ether, and dried at 40oC.
Os(H2L’)L2(PF6)2 was synthesized as reported in the literature.20 Ru(H2L’)2(CN)2 was
Figure 2.1. Energy diagram demonstrating the theoretical increase in Voc due to using a
redox couple that is significantly more positive in potential than I-/I3- and is still capable
of thermodynamically reducing the oxidized sensitizer (S).
T
iO
2
S
+
/S
*
Br
3
-
/Br
-V
oc
0.04V
0.44V
I
3
-
/I
Table 2.1. Compiled results comparing I-/I3- and Br-/Br3- electrolytes for a series of dyes.
as received. All materials were stored under a nitrogen atmosphere in a dry box with the
exception of I2, ethanol, Os(H2L’)L2(PF6)2 and Ru(H2L’)2(CN)2. TiO2 screen-printing
paste was purchased from Solaronix under the product name Ti-Nanoxide HT/SP (≈9nm
sized particles) and used as received. Fluorine doped SnO glass slides (4in x 1in) with a
resistivity of 15 Ω cm-2 were purchased from Hartford Glass Co., Inc.
Dye Coated Electrodes
Fluorine doped SnO glass slides were first cleaned in soapy water and rinsed with
18 MΩ water. The slides were subsequently rinsed with acetone, 200 proof absolute
ethanol, and dried under nitrogen. Special care was taken to assure no residue was left on
the slides in the form or spotting or other blemishes. TiO2 screen printing paste was
deposited on the F:SnO slides by screen printing with an AMI Inc. HC-53 screen printer
with a 156 mesh polyester screen and 10.2 µm of MX emulsion (Sefar Printing). The
printed films were covered to prevent dust from settling on top of the slides and left at
room temperature for 1hr. The slides were then dried in a furnace at 80oC for 1hr before
being sintered at 450oC for 30 minutes in air. The thickness of the TiO2 layer on F:SnO
was measured by a Dektak 3030 profilometer and determined to be ≈5 µm thick.
TiO2 slides for photoelectrochemical experiments were prepared by cutting the
4in x 1in slides into 0.5in x 1in electrodes. TiO2 electrodes were cleaned by rinsing with
18 MΩ water and 200 proof absolute ethanol. The TiO2 electrodes were then dried under
nitrogen and the surface of the TiO2 of the electrodes was covered with 3-4 drops of
0.2M TiCl4and allowed to soak for eight hours. 0.2M TiCl4 is not very air stable as it
was prepared from a stable stock solution of 2M TiCl4.55 After soaking for eight hours in
then dried under nitrogen. The slides were sintered at 450oC for thirty minutes and
allowed to cool to 120oC over two hours. The 120oC TiO2 electrodes were immersed in
200 proof absolute ethanolic solutions of approximately 1 x 10⁻⁴M Os(H
2L’)L2(PF6)2 or
Ru(H2L’)2(CN)2. The slides were immersed while still hot and allowed to soak in the dye
solution for 12-24 hours in the dark.
Electrolyte
Electrolyte solutions of 1.0M LiBr/ 0.08M Br2, 0.75M LiBr/ 0.06M Br2, 0.5M
LiBr/ 0.04M Br2, and 0.25M LiBr/ 0.02M Br2, 0.5M LiI/ 0.04M I2 were all prepared with
a 20mM pyridine and 20mM pyridinium trifluoroacetate buffer. The 20mM pyridine and
20mM pyridinium trifluoroacetate buffer was used to prevent dye desorption and buffer
the proton activity of the TiO2 to stabilize the conduction band edge of the TiO2. LiClO4
was added to electrolyte solutions of 0.75M LiBr/ 0.06M Br2, 0.05M LiBr/ 0.04M Br2,
and 0.25M LiBr/ 0.2M Br2 to maintain a 1.0M concentration of lithium in all the
electrolyte solutions used for increasing concentration studies. All solutions were
prepared and stored in a nitrogen atmosphere. Electrolyte solutions were either prepared
the day before or day of experimentation and used within three days of the experiment.
Special care was taken to assure that all powdered reagents were completely dissolved in
the electrolyte.
Photoelectrochemistry
A custom, three electrode, electrochemical cell was used in all
photoelectrochemistry experiments (Figure 2.2). The three electrodes were a platinum
gauze counter electrode, platinum wire reference electrode (referenced to the solution
Figure 2.2. Custom three-electrode photoelectrochemical cell used to test I-V behavior in
DSSCs.
To Reference Pt Wire
To Counter Pt gauze
Electrolyte:
0.50 M LiI 0.04 M I2 Acetonitrile 20 mM Pyridine 20 mM Pyridinium
Triflate
the working and counter electrodes was 2mm, which was determined by a silicon rubber
spacer. Light from a 150 Xe lamp in an Oriel Lamp Research housing was used to
illuminate the photoelectrochemical cell from the backside of the TiO2. Light first passed
through the glass, then the F:SnO2, and finally illuminated the dye coated TiO2. The light
from the xenon lamp was filtered with a long pass 385nm filter to prevent direct
excitation of TiO2. An AM 1.5 and AM 0 filter were used to perfectly match the solar
spectrum at AM 1.5. A Solarex, Inc. diode was used to calibrate the light intensity to
100mW/cm2. The photoelectrochemical cell was placed an appropriate distance from the
lamp that allowed for measurements to be taken at a light intensity of 100mW/cm2.
Electrolyte was introduced into the custom photoelectrochemical cell from the lower port.
Special care was taken to remove any air bubbles in the cell by tapping and flushing the
cell while monitoring the top exit port for bubbles. During experimentation the least
concentrated electrolyte was first added and the following electrolytes were added in
order of increasing concentration. A BAS 100B potentiostat was used to apply a
scanning potential of 20mV s-1. Scans were performed from 200mV to 600mV or
-800mV depending on the dye and electrolyte used. Current was measured every 2mV.
Scans always began at 0V. Cell resistances were measured with the BAS 100B
potentiostat and were determined to be 50Ω. The final current potential (I-V) curves
were corrected for cell resistance.
Results and Discussion
[Os(H2L’)L2]2+ and [Ru(H2L’)2(CN)2]2+ DSSC with a Bromide/tri-Bromide Electrolyte
The dyes, [Os(H2L’)L2]2+ and [Ru(H2L’)2(CN)2]2+, were studied in four Br-/Br3
chosen as the dyes to study, because [Os(H2L’)L2]2+ and [Ru(H2L’)2(CN)2]2+ both
exhibited low photocurrents as seen in Table 2.1. By increasing the electrolyte
concentration, an increase in photocurrent can be achieved while still maintaining the
increased photovoltage for the [Os(H2L’)L2]2+ as seen in Figure 2.3 and Table 2.2. The
open circuit voltage of DSSCs with [Os(H2L’)L2]2+ and the electrolytes 0.25M LiBr/
0.2M Br2, 0.5M LiBr/ 0.4M Br2, 0.75M LiBr/ 0.6M Br2, and 1.0M LiBr/ 0.8M Br2 all had
open circuit voltages within 3% of each electrolyte. The open circuit voltages were
-782mV, 763mV, 770mv, and 760mV in order of increasing electrolyte concentration.
The open circuit voltages remained relatively constant. The short circuit currents showed
a remarkable increase with increasing electrolyte concentration. The short circuit current
increased from 1.12 mA cm-2 for [Os(H2L’)L2]2+ in the electrolyte 0.25M LiBr/ 0.2M
Br2, to 1.91 mA cm-2 for the electrolyte containing 0.75M LiBr/ 0.6M Br2. This
correlates to a 70.5% increase in short circuit current density. The short circuit current
density also increased when increasing the electrolyte concentration from 0.25M LiBr/
0.2M Br2 to 0.5M LiBr/ 0.4M Br2. The increase in current from 0.25M LiBr/ 0.2M Br2 to
0.5M LiBr/ 0.4M Br2 was only 17% which was not as great an increase in current from
the electrolyte 0.5M LiBr/ 0.4M Br2 to the electrolyte 0.75M LiBr/ 0.6M Br2. The
increase in short circuit current from the 0.5M LiBr/ 0.4M Br2 electrolyte to the 0.75M
LiBr/ 0.6M Br2 electrolyte was 46%. The short circuit current density for [Os(H2L’)L2]2+
in the 0.75M LiBr/ 0.6M Br2 electrolyte decreased by 9% when going to the 1.0M LiBr/
0.8M Br2 electrolyte. The decrease in current is most likely due to the insolubility of
such a high concentration of LiBr. Over time, the 1.0M LiBr would eventually
Figure 2.3. Current versus potential characteristics of [Os(H2L’)L2]2+ in the presence of
increasing Br/Br3- concentrations under AM 1.5 solar simulated conditions. All
electrolytes contained 1.0M Li+, 20mM pyridine, and 20mM pyridinium trifluoroacetate.
!1000 !800 !600 !400 !200 0 200!10
!8
!6
!4
!2
0 2
Voc (mV)
J sc
(mA/cm
2 )
0.25M Br/0.02M Br
2
0.50M Br/0.04M Br2 0.75M Br/0.06M Br2 1.00M Br/0.08M Br
2
[Os(H2L’)L2]2+ 0.25M Br
/0.02M Br3-
0.50M Br/
0.04M Br3
-0.75M Br/
0.06M Br3
-1.00M Br/
0.08M Br3
-Voc (mV) -782 -764 -770 -760
Jsc (mA) 1.12 1.31 1.91 1.75
ff 0.71 0.74 0.68 0.66
Efficiency (η%) 0.62 0.74 1.00 0.88
Table 2.2. All electrolytes contained 1.0M Li+, 20mM pyridine, and 20mM pyridinium
remain in solution and not crystallize out of solution. Such behavior could be due to
changes in ambient temperature in the laboratory, seeding points on the inside of the
Schlenk vessel, or slight variations in electrolyte solution. Because LiBr would only
recrystallize some of the time, the electrolyte 1.0M LiBr/ 0.8M Br2 was believed to be
supersaturated. The supersaturated nature of the electrolyte could have contributed to the
9% decrease in short circuit current density seen in the [Os(H2L’)L2]2+ DSSC with a
1.0M LiBr/ 0.8M Br2 electrolyte. Fill factors for the [Os(H2L’)L2]2+ DSSCs remained
relatively constant for increasing Br-/Br
3- electrolyte concentrations. The fill factors were
at most within 10% of each other. The efficiencies of the [Os(H2L’)L2]2+ DSSCs showed
a 70% percent increase from the 0.25M LiBr/ 0.2M Br2 electrolyte to the 0.75M LiBr/
0.6M Br2 electrolyte. There was also a 17% increase in efficiency from the electrolyte
concentration of 0.25M LiBr/ 0.2M Br2 to 0.5M LiBr/ 0.4M Br2. A 12% decrease in
efficiency occurred when going from the 0.75M LiBr/ 0.6M Br2 to the 1.0M LiBr/ 0.8M
Br2. The increase and decrease in efficiency is due to the changes seen in the
photocurrent as a function of electrolyte concentration. As seen in Equation 1.1, a
change in short circuit current would generate a proportional change in the efficiency.
The changes in efficiency follow the changes in current with a significant increase in
efficiency from the 0.25M LiBr/ 0.2M Br2 electrolyte to the 0.75M LiBr/ 0.6M Br2
electrolyte, which directly correlates to the large increase in photocurrent from the
different electrolyte concentrations. Also, a decrease in efficiency from the 0.75M LiBr/
0.6M Br2 electrolyte to the 1.0M LiBr/ 0.8M Br2 electrolyte was observed. This trend
also followed the trend in short circuit current. The increase in short circuit current was
Because the fill factors and open circuit voltages remained relatively constant for all
concentrations of Br-/Br3- electrolyte and the short circuit currents increased with
increasing concentrations of Br-/Br
3- electrolyte, the efficiency of the [Os(H2L’)L2]2+
DSSCs increased.
[Ru(H2L’)2(CN)2]2+ exhibited similar trends as [Os(H2L’)L2]2+, but the changes in
short circuit current and efficiency were not as significant (Figure 2.4 and Table 2.3).
The open circuit voltages of [Ru(H2L’)2(CN)2]2+ DSSCs in Br-/Br3- electrolytes were
within 7% percent of each other and did not show any trends in the slight increases and
decreases in open circuit voltages for the Br-/Br3- electrolytes. The fill factors of
[Ru(H2L’)2(CN)2]2+ DSSCs exhibited values that were within 6% of each other. The
increasing concentrations of Br-/Br3- electrolytes did not affect the fill factor
characteristics of [Ru(H2L’)2(CN)2]2+ DSSCs. The short circuit currents of
[Ru(H2L’)2(CN)2]2+ DSSCs increased with increasing concentrations of Br-/Br3
-electrolyte. The increase in short circuit current from the 0.25M LiBr/ 0.2M Br2
electrolyte to the 0.75M LiBr/ 0.6M Br2 electrolyte increased by 66%, which is a similar
increase to that in the [Os(H2L’)L2]2+ DSSCs of 70%. The increase in current from the
0.25M LiBr/ 0.2M Br2 electrolyte to the 0.50M LiBr/ 0.4M Br2 electrolyte in
[Ru(H2L’)2(CN)2]2+ DSSCs was 38%. The increase in current from 0.25M LiBr/ 0.2M
Br2 electrolyte to the 0.50M LiBr/ 0.4M Br2 electrolyte for [Os(H2L’)L2]2+ DSSCs was
significantly less at 17% when compared to [Ru(H2L’)2(CN)2]2+ DSSCs. A similar
decrease in current was observed when going from the 0.75M LiBr/ 0.6M Br2 electrolyte
to the 1.0M LiBr/ 0.8M Br2 electrolyte in [Ru(H2L’)2(CN)2]2+ DSSCs. The decrease in
Figure 2.4. Current versus potential characteristics of [Os(H2L’)L2]2+ in the presence of
increasing Br/Br3- concentrations under AM 1.5 solar simulated conditions. All
electrolytes contained 1.0M Li+, 20mM pyridine, and 20mM pyridinium trifluoroacetate.
!800 !700 !600 !500 !400 !300 !200 !100 0 100 200
!4
!3.5
!3
!2.5
!2
!1.5
!1
!0.5 0 0.5
Voc (mV)
J sc
(mA/cm
2 )
0.25M Br/0.02M Br2 0.50M Br/0.04M Br2 0.75M Br/0.06M Br2 1.00M Br/0.08M Br2
[Ru(H2L’)
[Ru(H2L’)2(CN)2]2+ 0.25M Br
/0.02M Br3-
0.50M Br/
0.04M Br3
-0.75M Br/
0.06M Br3
-1.00M Br/
0.08M Br3
-Voc (mV) 702 664 654 674
Jsc (mA) 0.36 0.50 0.60 0.55
ff 0.54 0.54 0.51 0.51
Efficiency (η%) 0.14 0.18 0.20 0.19
Table 2.3. All electrolytes contained 1.0M Li+, 20mM pyridine, and 20mM pyridinium
0.8M Br2 electrolyte was 9% which is the same percent change seen in [Os(H2L’)L2]2+
DSSCs of the same electrolytes.
[Os(H2L’)L2]2+ and [Ru(H2L’)2(CN)2]2+ DSSC Equilibration
The [Os(H2L’)L2]2+ and [Ru(H2L’)2(CN)2]2+ DSSCs both required a certain
amount of time to equilibrate to their maximum values. In the case of DSSCs with the
dye [Os(H2L’)L2]2+ and a 0.5M LiBr/ 0.4M Br2 electrolyte it took 80 minutes before the
dye reached its maximal values (Figures 2.5 and 2.6). Over the 80-minute duration of the
experiment the open circuit voltages and fill factors did not vary significantly and they
did not increase over time. The open circuit voltages stayed within 4mV of each other
and the fill factors were within 4 percent of each other. The short circuit currents in
[Os(H2L’)L2]2+ DSSCs increased significantly from the beginning of the experiment to
the end. The current approximately quadrupled from time zero to 80 minutes, going from
0.37 mA cm-2 to 1.31 mA cm-2. This increase in current also increased the efficiency of
the cells significantly from 0.21% to 0.74%. The increase in efficiency was
approximately the same as the increase in current. Similar results were seen in the
[Ru(H2L’)2(CN)2]2+ DSSCs in the same electrolyte of 0.5M LiBr/ 0.4M Br2, but the
increases in current and efficiency were not as significant (Figures 2.7 and 2.8). Also, the
time needed to reach maximal values was less for [Ru(H2L’)2(CN)2]2+ DSSCs than for
[Os(H2L’)L2]2+ DSSCs. It took 50 minutes to reach maximal values as opposed to 80
minutes for [Os(H2L’)L2]2+ DSSCs. The open circuit voltages in [Ru(H2L’)2(CN)2]2+
DSSCs were more varied when compared to [Os(H2L’)L2]2+ DSSCs. The open circuit
voltage decreased 32mV over 50 minutes, but this was only a 5% change and can be
Figure 2.5. Current versus potential curves of [Os(H2L’)L2]2+ taken over time until the
cell equilibrated. The electrolyte used was 0.5M LiBr, 0.04M Br2, 0.5M LiClO4, 20mM
pyridine, and 20mM pyridinium trifluoroacetate in acetonitrile.
!900 !800 !700 !600 !500 !400 !300 !200 !100 0 100 200!6
!5
!4
!3
!2
!1 0 1
V
oc (mV)
J sc
(mA/cm
2 )
0 min 10 min 20 min 30 min 40 min 50 min 60 min 70 min 80 min
Figure 2.6. Plot of short circuit current, open circuit voltage, fill factor, and efficiency
versus time for [Os(H2L’)L2]2+. The electrolyte used was 0.5M LiBr, 0.04M Br2, 0.5M
LiClO4, 20mM pyridine, and 20mM pyridinium trifluoroacetate in acetonitrile.
[Os(H2L’)L2]2+
−767 −766 −765 −764 −763 −762 −761 V oc (mV)
0 10 20 30 40 50 60 70 80 0.2 0.4 0.6 0.8 1 1.2 1.4 1.6 J sc (mA/cm 2 )
0 10 20 30 40 50 60 70 80 0.715 0.72 0.725 0.73 0.735 0.74 0.745 0.75 Fill Factor Time (minutes)
Figure 2.7. Current versus potential curves of [Ru(H2L’)2(CN)2]2+ taken over time until
the cell equilibrated. The electrolyte used was 0.5M LiBr, 0.04M Br2, 0.5M LiClO4,
20mM pyridine, and 20mM pyridinium trifluoroacetate in acetonitrile.
!800 !700 !600 !500 !400 !300 !200 !100 0 100 200
!4
!3.5
!3
!2.5
!2
!1.5
!1
!0.5 0 0.5
V
oc (mV)
J sc
(mA/cm
2 )
0 min 10 min 20 min 30 min 40 min 50 min
[Ru(H
2L
’)
Figure 2.8. Plot of short circuit current, open circuit voltage, fill factor, and efficiency
versus time for [Ru(H2L’)2(CN)2]2+. The electrolyte used was 0.5M LiBr, 0.04M Br2,
0.5M LiClO4, 20mM pyridine, and 20mM pyridinium trifluoroacetate in acetonitrile.
0 10 20 30 40 50
0.15 0.16 0.17 0.18 0.19 Fill Factor Time (minutes)
0 10 20 30 40 50
0.505 0.51 0.515 0.52 0.525 0.53 0.535 0.54 Efficiency Time (minutes)
0 10 20 30 40 50
−700 −690 −680 −670 −660 V oc (mV)
0 10 20 30 40 50
0.4 0.42 0.44 0.46 0.48 0.5 0.52 0.54 J sc (mA/cm 2 ) [Ru(H2L’)
negligible as well. The short circuit current increased by 19% over the 50-minute
experiment. While this increase was not as significant as that seen in the [Os(H2L’)L2]2+
DSSCs it is still considerable. The increase in current and negligible changes in fill
factors and open circuit voltages led to a similar ≈20% increase in efficiency over 50
minutes. Similar increases in currents and efficiencies were observed in all electrolytes
to varying degrees. The most significant changes over time observed for the two test
dyes in the 0.5M LiBr/ 0.4M Br2 electrolyte was in the short circuit current. Such
changes over time indicate that an equilibrium must be achieved in order to achieve
maximal values. It is possible that intercalation and adsorption of the lithium cations as
well as the subsequent adsorption of the bromide anion require a certain amount of time
to equilibrate and facilitate efficient operation of DSSCs. There are no reports in the
literature of such equilibration, but reports as to the effect of cations on the regeneration
and recombination of oxidized dye with iodide indicate that cation intercalation and
adsorption facilitate faster regeneration rates and slower recombination.56,57
Bromide vs. Iodide Electrolytes
When comparing [Os(H2L’)L2]2+ and [Ru(H2L’)2(CN)2]2+DSSCs in the presence
of 0.5M Li+/0.5M I-/0.04M I2 and 0.5M Li+/0.5M Br-/0.04M Br2 some notable
differences are observed (Table 2.4). In [Os(H2L’)L2]2+ DSSCs the short circuit current,
fill factor, and efficiency are significantly decreased, but the open circuit voltage
increased by 80mV from 400mV when going from a 0.5M Li+/0.5M I-/0.04M I2
electrolyte to a 0.5M Li+/0.5M Br-/0.04M Br2 electrolyte. DSSCs containing
[Ru(H2L’)2(CN)2]2+ as the light absorber showed a significant decrease in current and


![Figure 1.5. Incident photon to current efficiency of N3 [RuL2(NCS)2] and Black Dye](https://thumb-us.123doks.com/thumbv2/123dok_us/8616870.1406578/31.612.153.500.54.316/figure-incident-photon-current-efficiency-rul-ncs-black.webp)