OncoTargets and Therapy 2017:10 3225–3232
OncoTargets and Therapy
Dove
press
submit your manuscript | www.dovepress.com 3225
O r i g i n a l r e s e a r c h
open access to scientific and medical research
Open access Full Text article
exploration of the molecular mechanism of
prostate cancer based on mrna and
miRNA expression profiles
Xing Zhang1
YuYan sun1
Peng Wang1
changfu Yang1
shengwei li2
1Department of Urology, 2surgery
of chinese Medicine, Yangzhou TcM hospital, nanjing University of chinese Medicine, Yangzhou, People’s republic of china
Abstract: Prostate cancer, the second most common cancer in men, has been rarely explored by integrating mRNA and miRNA expression profiles. In this study, we combined two mRNA expression datasets and six documented miRNAs to uncover the comprehensive molecular mech-anism of prostate cancer. Results showed that a total of 30 genes were significantly differentially expressed in 49 tumor samples by comparing with 22 normal samples. Importantly, all samples from the two datasets can be clearly classified into two groups, tumor group and normal group, based on the selected differentially expressed genes (DEGs). The miRNA–mRNA regulation network indicated that 4 out of 30 DEGs can be regulated by three miRNAs. In addition, prog-nostic performance validation using in silico databases showed that the DEGs can significantly differentiate between low-risk and high-risk prostate cancer. In summary, multiple biological processes are probably involved in the development and progression of prostate cancer. First, dysregulation of SV2 can regulate transporter and transmembrane transporter activity and then provide the necessary nutrients for tumor cell proliferation. Second, HOXD10 can induce cell proliferation via TCF-4. Finally, dysregulation of CACNA1D can further suppress tumor apop-tosis in prostate cancer. The identification of critical genes and valuable biological processes can be useful for the understanding of the molecular mechanism of prostate cancer.
Keywords: mRNA, DEGs, miRNA, prognostic
Introduction
Prostate cancer, as the second most common cancer in men and fourth most common tumor type worldwide, is estimated to be diagnosed in 220,800 men in the USA, and
almost 12% (27,540) died of their disease.1,2 The World Health Organization (WHO)’s
report in 2012 shows that the incidence rates were estimated to be 10.5% and 4.5%
in east and south-central Asia, respectively.3 In recent years, however, the incidence
and mortality rate of prostate cancer have experienced a steady increase in some Asian
countries.3 The primary prostate cancer has a 5-year survival rate of nearly 100%, and
the distant metastasis has a 5-year survival rate of 28%.4 Various factors contribute to
the incidence of prostate cancer including genetic, age, lifestyle and race.5
In the current era, several prostate cancer biomarkers have been approved by the US Food and Drug Administration (FDA). One of these is PCa antigen 3 (PCA3) which
is specifically upregulated in tumor tissues.6 Another one is PSA isoform (ProPSA)
which can distinguish tumor tissues from normal tissues.7 In recent years, molecular
and genetic profiles have been widely used for the screening of therapeutic targets. The fusion of androgen-regulated promoters with ERG and E26 transformation-specific (ETS) family members has been identified as the most common alteration
correspondence: shengwei li surgery of chinese Medicine, Yangzhou TcM hospital, nanjing University of chinese Medicine, 577 Middle road, Wenchang, Yangzhou, Jiangsu, 225002, People’s republic of china
Tel +86 514 8793 7086 Fax +86 514 8793 7070 email [email protected]
Journal name: OncoTargets and Therapy Article Designation: Original Research Year: 2017
Volume: 10
Running head verso: Zhang et al
Running head recto: Exploration of the molecular mechanism of prostate cancer DOI: http://dx.doi.org/10.2147/OTT.S135764
OncoTargets and Therapy downloaded from https://www.dovepress.com/ by 118.70.13.36 on 25-Aug-2020
For personal use only.
Number of times this article has been viewed
This article was published in the following Dove Press journal: OncoTargets and Therapy
Dovepress Zhang et al
in prostate cancer genome.8 Tomlins et al’s8 study shows
that approximately 40%–50% of prostate cancers have TMPRSS2-ERG fusion. MALAT-1 fragment named as MD-miniRNA has been reported to differentiate prostate tumor and normal samples with the sensitivity of 56.6% and
specificity of 84.8%.9 Somatic point mutations such as SPOP,
TP53, FOXA1 and PTEN also have been frequently identified
in prostate cancer.10 In addition, gene expression signatures
of prostate cancer have been widely revealed based on oli-gonucleotide or cDNA microarray technology. One gene that encodes the serine protease hepsin was identified to be
upregulated in malignant prostate tumor samples.11 The
pro-tein level of two genes, hepsin and pim-1, was significantly
correlated with clinical outcome based on tissue microarray.12
In addition, the overexpression of genes that participated in multiple signal pathways especially cell cycle regulation, DNA replication and DNA repair was significantly related to proliferation rate of metastatic prostate cancer.13 Although
various studies have been carried out based on microarray or next-generation sequencing (NGS) technologies, studies by integrating mRNA and miRNA expression profiles are rare in prostate cancer. More and more publicly available datasets were submitted to Gene Expression Omnibus (GEO) database with the development of technologies. In this study, to gain further insight into the molecular mechanism of prostate can-cer, we comprehensively characterized the expression profiles of 49 prostate tumor samples. First, the significant common differentially expressed genes (DEGs) from two datasets were identified using advanced bioinformatic algorithms. Then, the common DEGs were subject to gene ontology (GO) and Kyoto Encyclopedia of Genes and Genomes (KEGG) path-way enrichment analysis. Further, the regulation network between mRNA and six reported miRNAs was constructed. Finally, prognostic performance of the common DEGs was validated in silico using SurvExpress online database.
Materials and methods
mRNA and miRNA expression profiles
download
A lot of publicly available gene expression profiles have been submitted to GEO or ArrayExpress database in recent years. In this study, we carefully searched the GEO database and down-loaded two representative mRNA expression profiles of prostate cancer. One dataset, with GEO accession number GSE46602,
was deposited by Mortensen et al,14 and this dataset consisted
of 36 tumor tissues and 14 normal tissues. Another dataset
named GSE55945 was submitted by Arredouani et al15 which
contains 13 tumor tissues and eight normal tissues. The two datasets were obtained from Affymetrix Human Genome U133
Plus 2.0 Array. Detailed sample information and experiment design can be obtained from previous published papers.
Identification of DEGs
To explore the significant DEGs in prostate cancer, two datasets were carefully analyzed with in-house pipeline based on R language and public annotation databases. Briefly, mRNA expression values from the two datasets were subject to background correction to reduce noise. Then, normaliza-tion and log2 transformanormaliza-tion of the expression values were carried out using GeneChip Robust Multi-array Analysis
(GC-RMA) algorithm.16 In addition, control probe sets
or uninformative probe sets were removed, and the mean expression value was calculated for the genes with multiple probes. Finally, DEGs between tumor and normal tissues were screened out using algorithm within Limma (linear
models for microarray analysis) package.17 Criteria for DEG
selection were set to adjust P-value #0.05 and absolute log2
fold change $2 which can significantly reduce false positive.
In addition, common DEGs between the two datasets were figured out based on Venn diagram, and the expression pat-tern of the common DEGs in all samples was constructed by
using heatmap.2 method within ggplot package.18
gO and Kegg pathway annotation
To explore biological functions of the DEGs, the identi-fied common DEGs were further subject to GO and KEGG pathway enrichment using online tool of DAVID (Database
for Annotation, Visualization and Integrated Discovery).19
All parameters were set as default, and the GO terms con-sisted of biological process (BP), cellular component (CC) and molecular function (MF).
mrna–mirna regulation network
construction
More and more investigations have shown that miRNA can regulate tumor-related mRNA expression and play an
important role in the whole process of tumor.20 In the study
by Alhasan et al,21 six miRNAs, including miR-605-5p,
miR-135a-3p, miR-495-5p, miR-433-5p, miR-371a-3p and miR-106a-5p, were demonstrated to be significantly up/down-expressed in prostate cancer. Blind studies also validated that the six miRNAs can differentiate prostate cancer patients from
healthy people with 89% accuracy.21 Based on the six miRNAs,
we constructed the regulation network using CyTargetLinker plugin in Cytoscape.22 In brief, target genes for the six miRNAs
were predicted using microCosm, mirTarbase and TargetScan databases. Then, intersection between the common DEGs and target genes were selected and subject to Cytoscape.
OncoTargets and Therapy downloaded from https://www.dovepress.com/ by 118.70.13.36 on 25-Aug-2020
Dovepress exploration of the molecular mechanism of prostate cancer
Prognostic performance of the
common Degs
It is critical to validate the clinical outcomes of identified common DEGs for the diagnosis or treatment of prostate cancer. In this study, in silico validation was conducted using SurvExpress online tool that is based on publicly available
mRNA expression profiles with clinical outcomes.23 Two
datasets, GSE16560 and GSE40272, were used, and param-eters were carefully selected with the instruction from the developer. In brief, we need to input our list of genes, select tissues, datasets, and set survival analysis options. The cen-sored parameter was set to survival_month. All the samples
were used as train set and test set for the estimation of beta coefficient using Cox model and the estimation of prognos-tic index. The optional weight parameter was estimated as the beta coefficient from the Cox model. Other parameters were left as default. Detailed sample information for the two
datasets can be obtained from previous reports.24,25
Results
Identification of DEGs in prostate cancer
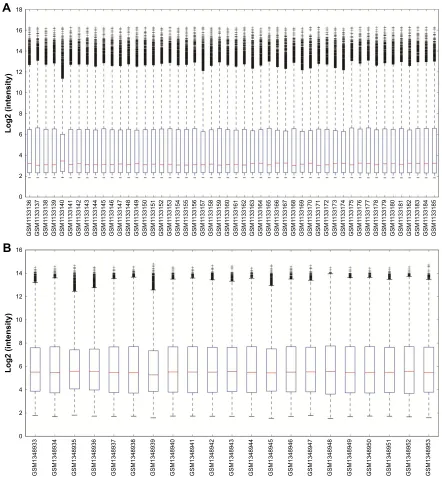
To identify significant DEGs, the gene expression values were subject to preprocessing first. Figure 1 shows that the values are almost at the same level for the two datasets after
Figure 1 Boxplots for gene expression of each sample in gse46602 (A) and gse55945 (B).
*60 *60 *60 *60 *60 *60 *60 *60 *60 *60 *60 *60 *60 *60 *60 *60 *60 *60 *60 *60 *60 /RJLQWHQVLW\ *60 *60 *60 *60 *60 *60 *60 *60 *60 *60 *60 *60 *60 *60 *60 *60 *60 *60 *60 *60 *60 *60 *60 *60 *60 *60 *60 *60 *60 *60 *60 *60 *60 *60 *60 *60 *60 *60 *60 *60 *60 *60 *60 *60 *60 *60 *60 *60 *60 *60 /RJLQWHQVLW\
$
%
OncoTargets and Therapy downloaded from https://www.dovepress.com/ by 118.70.13.36 on 25-Aug-2020
Dovepress Zhang et al
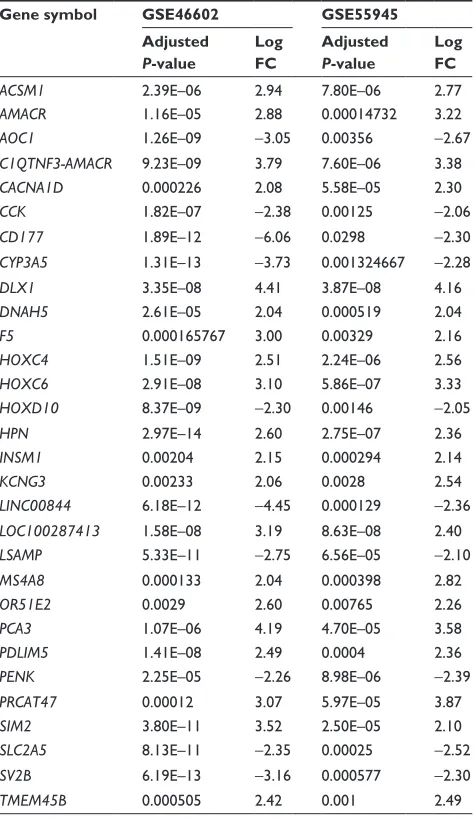
normalization. Then, significant DEGs were figured out by applying robust empirical Bayesian method. Results showed that a total of 286 and 51 genes in GSE46602 and GSE55945, respectively, were significantly dysregulated in tumor sam-ples. In GSE46602, 90 genes (31.5%) were upregulated and 196 genes were downregulated (68.5%), and in GSE55945, 32 genes (62.7%) were upregulated and 19 genes were down-regulated (37.3%). In addition, 30 genes were found to be simultaneously differentially expressed in both GSE46602 and GSE55945 (Figure 2A), and the fold change and adjusted
P-value are listed in Table 1. In addition, fold change
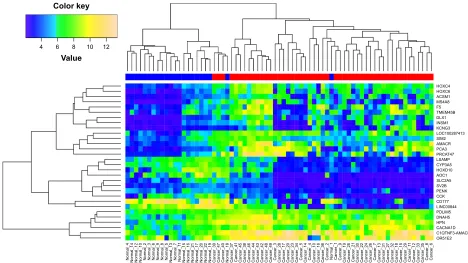
cor-relation of the common DEGs was 0.78 (Figure 2B), which indicates that the expression level of the common DEGs was consistent between the two datasets. Further, the expression pattern of the common DEGs in all samples was constructed and subject to hierarchical clustering. Figure 3 shows that tumor (red) and normal (blue) samples can be clearly classified into two different subgroups except for Normal_18 and Normal_1. Error assignment for these two samples was probably due to tumor heterogeneity or variation in expression values.
gO and Kegg pathway annotation
To obtain the corresponding biological functions of the com-mon DEGs, functional annotations were carried out using DAVID online tool that is based on GO and KEGG pathway database. As listed in Table 2, SLC2A5 and CACNA1D can be enriched into carbohydrate digestion and absorption KEGG pathway. GO annotation results indicated that the common DEGs were mainly related to the BP of xenobiotic metabolic process, anterior/posterior pattern specification, locomotory exploration behavior, proximal/distal pattern formation and behavioral fear response with P-value
*6(
*6(
± ± ± ±
*6(
*6(
± ±
5
$
%
Figure 2 Venn diagram of the Degs in gse46602 and gse55945 (A) and fold change correlation between the two datasets (B).
Abbreviation: Degs, differentially expressed genes.
Table 1 The identified 30 common DEGs in GSE46602 and gse55945
Gene symbol GSE46602 GSE55945 Adjusted
P-value
Log FC
Adjusted
P-value
Log FC
ACSM1 2.39e–06 2.94 7.80e–06 2.77
AMACR 1.16e–05 2.88 0.00014732 3.22
AOC1 1.26e–09 -3.05 0.00356 -2.67
C1QTNF3-AMACR 9.23e–09 3.79 7.60e–06 3.38
CACNA1D 0.000226 2.08 5.58e–05 2.30
CCK 1.82e–07 -2.38 0.00125 -2.06
CD177 1.89e–12 -6.06 0.0298 -2.30
CYP3A5 1.31e–13 -3.73 0.001324667 -2.28
DLX1 3.35e–08 4.41 3.87e–08 4.16
DNAH5 2.61e–05 2.04 0.000519 2.04
F5 0.000165767 3.00 0.00329 2.16
HOXC4 1.51e–09 2.51 2.24e–06 2.56
HOXC6 2.91e–08 3.10 5.86e–07 3.33
HOXD10 8.37e–09 -2.30 0.00146 -2.05
HPN 2.97e–14 2.60 2.75e–07 2.36
INSM1 0.00204 2.15 0.000294 2.14
KCNG3 0.00233 2.06 0.0028 2.54
LINC00844 6.18e–12 -4.45 0.000129 -2.36
LOC100287413 1.58e–08 3.19 8.63e–08 2.40
LSAMP 5.33e–11 -2.75 6.56e–05 -2.10
MS4A8 0.000133 2.04 0.000398 2.82
OR51E2 0.0029 2.60 0.00765 2.26
PCA3 1.07e–06 4.19 4.70e–05 3.58
PDLIM5 1.41e–08 2.49 0.0004 2.36
PENK 2.25e–05 -2.26 8.98e–06 -2.39
PRCAT47 0.00012 3.07 5.97e–05 3.87
SIM2 3.80e–11 3.52 2.50e–05 2.10
SLC2A5 8.13e–11 -2.35 0.00025 -2.52
SV2B 6.19e–13 -3.16 0.000577 -2.30
TMEM45B 0.000505 2.42 0.001 2.49
Abbreviations: Degs, differentially expressed genes; Fc, fold change.
OncoTargets and Therapy downloaded from https://www.dovepress.com/ by 118.70.13.36 on 25-Aug-2020
Dovepress exploration of the molecular mechanism of prostate cancer
1RUPDOB 1RUPDOB 1RUPDOB 1RUPDOB 1RUPDOB 1RUPDOB 1RUPDOB 1RUPDOB 1RUPDOB 1RUPDOB 1RUPDOB 1RUPDOB 1RUPDOB
1RUPDOB 1RUPDOB 1RUPDOB 1RUPDOB 1RUPDOB 1RUPDOB 1RUPDOB &DQFHUB &DQFHUB &DQFHUB &DQFHUB &DQFHUB &DQFHUB &DQFHUB &DQFHUB &DQFHUB &DQFHUB &DQFHUB &DQFHUB &DQFHUB &DQFHUB &DQFHUB &DQFHUB &DQFHUB &DQFHUB &DQFHUB &DQFHUB &DQFHUB &DQFHUB &DQFHUB &DQFHUB &DQFHUB &DQFHUB 1RUPDOB &DQFHUB &DQFHUB &DQFHUB &DQFHUB &DQFHUB &DQFHUB &DQFHUB &DQFHUB &DQFHUB &DQFHUB &DQFHUB &DQFHUB &DQFHUB &DQFHUB &DQFHUB &DQFHUB &DQFHUB &DQFHUB
&DQFHUB &DQFHUB &DQFHUB &DQFHUB &DQFHUB
1RUPDOB
25( &471)$0$&5 &$&1$' +31 '1$+ 3'/,0 /,1& &' &&. 3(1. 69% 6/&$ $2& +2;' &<3$ /6$03 35&$7 3&$ $0$&5 6,0 /2& .&1* ,160 '/; 70(0% ) 06$ $&60 +2;& +2;&
9DOXH &RORUNH\
Figure 3 heat map showing the expression pattern of 30 common Degs in all tumor and normal samples.
Notes: The x-axis represents samples and y-axis represents genes. The bar on the top indicates the type of sample using red (tumor) and blue (normal).
Abbreviation: Degs, differentially expressed genes.
Table 2 Kegg pathway and gO enrichment results for the common Degs
Type ID Term Genes P-value
Kegg hsa04973 carbohydrate digestion and absorption SLC2A5, CACNA1D 0.0649
BP gO:0006805 Xenobiotic metabolic process CYP3A5, ACSM1, AOC1 0.0046
gO:0009952 Anterior/posterior pattern specification HOXC6, HOXC4, HOXD10 0.0049
gO:0035641 locomotory exploration behavior PENK, LSAMP 0.0156
gO:0009954 Proximal/distal pattern formation DLX1, HOXD10 0.0310
gO:0001662 Behavioral fear response CCK, PENK 0.0373
cc gO:0005886 Plasma membrane HPN, SLC2A5, F5, PENK, CD177, LSAMP,
SV2B, KCNG3, OR51E2, CACNA1D, AOC1
0.0387
MF gO:0043565 Sequence-specific DNA binding HOXC6, DLX1, HOXC4, HOXD10 0.0287
gO:0003700 Transcription factor activity, sequence-specific Dna binding
HOXC6, INSM1, HOXC4, HOXD10, SIM2
0.0336
gO:0005184 neuropeptide hormone activity CCK, PENK 0.0384
Abbreviations: BP, biological process; cc, cellular component; Degs, differentially expressed genes; geO, gene expression Omnibus; gO, gene ontology; Kegg, Kyoto encyclopedia of genes and genomes; MF, molecular function.
MicroCosm databases, respectively. In addition, four out of the predicted target genes can be identified in the common DEGs. Based on the miRNA–mRNA pairings constructed using Cytoscape, we can find that miR-106a-5p can regulate the expression of PDLIM5 and SV2B (Figure 4). Also, miR-135a-3p and miR-371a-3p can regulate the expression of HOXD10 and CACNA1D, respectively (Figure 4).
Prognostic performance of the
common Degs
Clinical outcome validation is critical for the identification of biomarker in cancer research. In this study, two independent
of ,0.05 (Table 2). In addition, four MF terms including
sequence-specific DNA binding, transcription factor activity, sequence-specific DNA binding and neuropeptide hormone
activity were enriched with P-value of ,0.05 (Table 2).
CC annotation showed that HPN, SLC2A5, F5, etc mainly located on plasma membrane (Table 2).
mirna–mrna regulation network
Further dysregulation mechanism of the common DEGs was explored by constructing miRNA–mRNA regulation network. Prediction results showed that the six miRNAs can target 15, 1,252 and 2,046 genes in miRTarBase, TargetScan and
OncoTargets and Therapy downloaded from https://www.dovepress.com/ by 118.70.13.36 on 25-Aug-2020
Dovepress Zhang et al
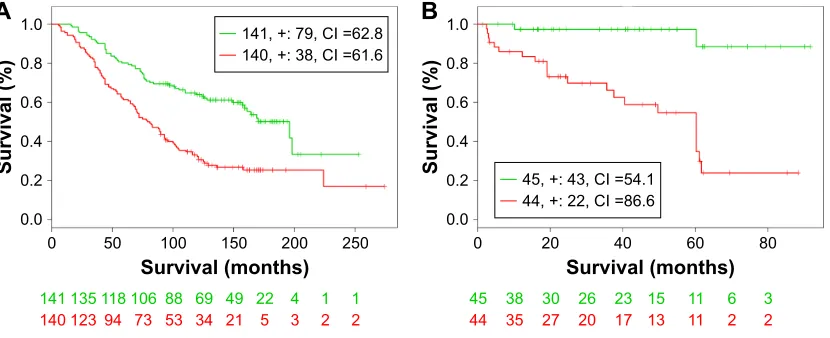
publicly available datasets, GSE16560 and GSE40272, were used to validate the prognostic performance of the identified common DEGs. Survival analysis based on clinical informa-tion from the two datasets showed that high-/low-risk pros-tate cancer group can be significantly differentiated in the two datasets with P-value 1.9E–7 and 1.0E–5, respectively (Figure 5). In addition, higher concordance index (CI) indi-cated that the common DEGs can be used for the prediction of prognostic performance (Table 3).
Discussion
The comprehensive analysis based on mRNA and miRNA expression profiles advanced the understanding of the molecu-lar mechanism of prostate cancer. A total of 30 DEGs were
identified in 49 tumor samples by comparing with normal samples. Importantly, all tumor and normal samples can be clearly classified into two groups based on the identified DEGs.
KEGG pathway annotation showed that SLC2A5 and
CACNA1D participated in the carbohydrate digestion and
absorption pathway. The protein encoded by SLC2A5 is a fruc-tose transporter responsible for frucfruc-tose uptake,26 and the
pro-tein encoded by CACNA1D is the alpha-1D subunit of calcium
channel.27 Enhanced growth and proliferation of tumor cells
place increased demand for nutrients for the synthesis of DNA
and protein.28 The dysregulation of transporter and calcium
channel probably increase the availability of nutrients.29
The complex molecular mechanism of prostate cancer was further unveiled by miRNA–mRNA regulation network. The regulation network showed that miR-106a-5p can regu-late the expression of SV2B (Figure 4). This gene encodes a member of the synaptic vesicle protein 2 family which partic-ipates in the regulation of vesicle trafficking and exocytosis.30
Expressed sequence tag (EST) analysis results showed that
SV2B was differentially expressed in prostate cancer.31 GO
annotations related to this gene included transporter activity and transmembrane transporter activity. Report also showed that SV2 can recruit glucose-evoked granules to the plasma
membrane.32 Due to high demand of nutrient for tumor
gen-eration and metastasis, the dysregulation of SV2 in prostate cancer can provide necessary nutrient.
Another critical gene is HOXD10 which is the target of miR-135a-3p (Figure 4). This gene belongs to homeobox (Hox) superfamily and encodes transcription factors that control cell differentiation and morphogenesis during
development.33,34 Documents showed that tumor growth
&$&1$'
3'/,0 69%
KVDPL5 DS
+2;'
KVDPL5 DS KVDPL5
DS
Figure 4 Regulation network between the identified common DEGs and reported mirnas.
Note: Pink hexagons represent Degs and green circles represent mirnas.
Abbreviation: Degs, differentially expressed genes.
6XUYLYDO
&,
&,
6XUYLYDO
&, &,
$
%
6XUYLYDOPRQWKV 6XUYLYDOPRQWKV
Figure 5 Kaplan–Meier curves of gse16560 dataset (A) and gse40272 (B).
Notes: censoring samples are marked with “+”. The x-axis represents time to event and y-axis represents percentage. The number of samples, censored number, and ci are shown in the insets. high- and low-risk groups are labeled with red and green curves, respectively. The red data represent high-risk patients, and the green data represent low-risk patients.
Abbreviation: ci, concordance index.
OncoTargets and Therapy downloaded from https://www.dovepress.com/ by 118.70.13.36 on 25-Aug-2020
Dovepress exploration of the molecular mechanism of prostate cancer
Table 3 Virtual validation results of prognostic performance
Dataset Samples Genes found
Risk groups (P-value)
DEGs between risk groups CI DEGs (n) DEGs
gse16560 281 19 1.90e–07 66.6 9 CACNA1D, CCK, F5, HOXC4, HOXC6, LSAMP,
MS4A7, PENK, SLC2A5
gse40272 98 26 1.00e–05 89 6 CYP3A5, HOXC4, HOXC6, KCNG3, LSAMP, PENK
Abbreviations: ci, concordance index; Degs, differentially expressed genes.
can be suppressed with ectopic expression of HOXB13 via
downregulation of β-catenin–TCF pathway.35 Jung et al’s34
study also demonstrated that HOXB13 can negatively regu-late the expression of TCF-4 and then suppress cell prolif-eration in prostate cancer. Expression study also shows that
HOXD10 is commonly downregulated in gastric tumor tissue
compared with normal stomach tissue. Functional analysis revealed that HOXD10 can upregulate IGFBP3, which can activate caspase-3 and caspase-8 and subsequently induce cell apoptosis. All the results suggest that HOXD10 probably functions as a tumor suppressor in prostate cancer.
In addition, CACNA1D was significantly dysregulated and can be regulated by miR-371a-3p (Figure 4). This gene encodes the alpha-1D subunit of calcium channel. Calcium channel has been demonstrated to contribute to cell pro-liferation, differentiation and apoptosis. Calcium channel blocker has an important regulatory role and can affect malignant transformation in prostate cancer.36 It has also been
documented that Ca2+ signaling participated in
androgen-induced PSA secretion. Prostate cancer cell proliferation and androgen receptor-mediated gene expression are significantly
suppressed with the addition of nifedipine and tetrandrine.37
In addition, knocking down of CACNA1D by siRNA can
abrogate androgen receptor transactivation.37
Apart from the abovementioned genes, several novel or rarely reported genes such as PDLIM5, HOXC4 and PENK were also identified in prostate cancer.
Conclusion
Multiple biological processes probably involved in the development and progression of prostate cancer. First, the dysregulation of SV2 can regulate transporter and transmem-brane transporter activity and then provide necessary nutrient for tumor cell proliferation. Then, HOXD10 can induce cell proliferation via TCF-4. Finally, the dysregulation of
CACNA1D can further suppress tumor apoptosis.
Acknowledgments
This work was supported by grants from the Natural Science Foundation of Jiangsu Province (BK20160481),
the Project for Medical Young Talents of Jiangsu Province (QNRC2016360) and the Natural Science Foundation of Yangzhou (YZ2015111).
Author contributions
All authors contributed toward data analysis, drafting and critically revising the paper, gave final approval of the version to be published, and agree to be accountable for all aspects of the work.
Disclosure
The authors report no conflicts of interest in this work.
References
1. Siegel RL, Miller KD, Jemal A. Cancer statistics, 2015. CA Cancer J Clin. 2015;65(1):5–29.
2. Cancer Genome Atlas Research Network. The molecular taxonomy of primary prostate cancer. Cell. 2015;163(4):1011–1025.
3. Chen R, Ren S, Yiu MK, et al. Prostate cancer in Asia: a collaborative report. Asian J Urol. 2014;1(1):15–29.
4. Edwards BK, Noone AM, Mariotto AB, et al. Annual Report to the Nation on the status of cancer, 1975–2010, featuring prevalence of comorbidity and impact on survival among persons with lung, colorec-tal, breast, or prostate cancer. Cancer. 2014;120(9):1290–1314. 5. Al Olama AA, Kote-Jarai Z, Berndt SI, et al. A meta-analysis of 87,040
individuals identifies 23 new susceptibility loci for prostate cancer. Nat Genet. 2014;46(10):1103–1109.
6. Haese A, de la Taille A, van Poppel H, et al. Clinical utility of the PCA3 urine assay in European men scheduled for repeat biopsy. Eur Urol. 2008;54(5):1081–1088.
7. Guazzoni G, Nava L, Lazzeri M, et al. Prostate-specific antigen (PSA) isoform p2PSA significantly improves the prediction of prostate cancer at initial extended prostate biopsies in patients with total PSA between 2.0 and 10 ng/ml: results of a prospective study in a clinical setting. Eur Urol. 2011;60(2):214–222.
8. Tomlins SA, Rhodes DR, Perner S, et al. Recurrent fusion of TMPRSS2 and ETS transcription factor genes in prostate cancer. Science. 2005; 310(5748):644–648.
9. Ren S, Wang F, Shen J, et al. Long non-coding RNA metastasis associ-ated in lung adenocarcinoma transcript 1 derived miniRNA as a novel plasma-based biomarker for diagnosing prostate cancer. Eur J Cancer. 2013;49(13):2949–2959.
10. Barbieri CE, Baca SC, Lawrence MS, et al. Exome sequencing identi-fies recurrent SPOP, FOXA1 and MED12 mutations in prostate cancer. Nat Genet. 2012;44(6):685–689.
11. Magee JA, Araki T, Patil S, et al. Expression profiling reveals hepsin over-expression in prostate cancer. Cancer Res. 2001;61(15):5692–5696. 12. Dhanasekaran SM, Barrette TR, Ghosh D, et al. Delineation of
prognostic biomarkers in prostate cancer. Nature. 2001;412(6849): 822–826.
OncoTargets and Therapy downloaded from https://www.dovepress.com/ by 118.70.13.36 on 25-Aug-2020
OncoTargets and Therapy
Publish your work in this journal
Submit your manuscript here: http://www.dovepress.com/oncotargets-and-therapy-journal
OncoTargets and Therapy is an international, peer-reviewed, open access journal focusing on the pathological basis of all cancers, potential targets for therapy and treatment protocols employed to improve the management of cancer patients. The journal also focuses on the impact of management programs and new therapeutic agents and protocols on
patient perspectives such as quality of life, adherence and satisfaction. The manuscript management system is completely online and includes a very quick and fair peer-review system, which is all easy to use. Visit http://www.dovepress.com/testimonials.php to read real quotes from published authors.
Dovepress
Dove
press
Zhang et al
13. LaTulippe E, Satagopan J, Smith A, et al. Comprehensive gene expression analysis of prostate cancer reveals distinct transcriptional programs associated with metastatic disease. Cancer Res. 2002;62(15): 4499–4506.
14. Mortensen MM, Hoyer S, Lynnerup AS, et al. Expression profiling of prostate cancer tissue delineates genes associated with recurrence after prostatectomy. Sci Rep. 2015;5:16018.
15. Arredouani MS, Lu B, Bhasin M, et al. Identification of the transcrip-tion factor single-minded homologue 2 as a potential biomarker and immunotherapy target in prostate cancer. Clin Cancer Res. 2009;15(18): 5794–5802.
16. Gentleman RC, Carey VJ, Bates DM, et al. Bioconductor: open software development for computational biology and bioinformatics. Genome Biol. 2004;5(10):R80.
17. Kerr MK. Linear models for microarray data analysis: hidden similari-ties and differences. J Comput Biol. 2003;10(6):891–901.
18. Hadley W. Ggplot2: Elegant Graphics for Data Analysis. Switzerland: Springer; 2016.
19. Dennis G Jr, Sherman BT, Hosack DA, et al. DAVID: database for annotation, visualization, and integrated discovery. Genome Biol. 2003;4(5):3.
20. Acunzo M, Croce CM. MicroRNA in cancer and cachexia – a mini-review. J Infect Dis. 2015;212(suppl 1):S74–S77.
21. Alhasan AH, Scott AW, Wu JJ, et al. Circulating microRNA signature for the diagnosis of very high-risk prostate cancer. Proc Natl Acad Sci U S A. 2016;113(38):10655–10660.
22. Shannon P, Markiel A, Ozier O, et al. Cytoscape: a software environ-ment for integrated models of biomolecular interaction networks. Genome Res. 2003;13(11):2498–2504.
23. Aguirre-Gamboa R, Gomez-Rueda H, Martinez-Ledesma E, et al. SurvExpress: an online biomarker validation tool and database for cancer gene expression data using survival analysis. PLoS One. 2013;8(9):e74250.
24. Sboner A, Demichelis F, Calza S, et al. Molecular sampling of pros-tate cancer: a dilemma for predicting disease progression. BMC Med Genomics. 2010;3:8.
25. Gulzar ZG, McKenney JK, Brooks JD. Increased expression of NuSAP in recurrent prostate cancer is mediated by E2F1. Oncogene. 2013; 32(1):70–77.
26. You J, Wang L, Huang J, et al. Low glucose transporter SLC2A5-inhibited human normal adjacent lung adenocarcinoma cytoplasmic pro-B cell development mechanism network. Mol Cell Biochem. 2015; 399(1–2):71–76.
27. Pinggera A, Lieb A, Benedetti B, et al. CACNA1D de novo mutations in autism spectrum disorders activate Cav1.3 L-type calcium channels. Biol Psychiatry. 2015;77(9):816–822.
28. Ganapathy V, Thangaraju M, Prasad PD. Nutrient transporters in cancer: relevance to Warburg hypothesis and beyond. Pharmacol Ther. 2009;121(1):29–40.
29. Moscat J, Richardson A, Diaz-Meco MT. Nutrient stress revamps cancer cell metabolism. Cell Res. 2015;25(5):537–538.
30. Fukusumi Y, Wakamatsu A, Takashima N, et al. SV2B is essential for the integrity of the glomerular filtration barrier. Lab Invest. 2015;95(5): 534–545.
31. Clegg N, Ferguson C, True LD, et al. Molecular characterization of prostatic small-cell neuroendocrine carcinoma. Prostate. 2003;55(1): 55–64.
32. Iezzi M, Theander S, Janz R, Loze C, Wollheim CB. SV2A and SV2C are not vesicular Ca2+ transporters but control glucose-evoked granule recruitment. J Cell Sci. 2005;118(pt 23):5647–5660.
33. Samuel S, Naora H. Homeobox gene expression in cancer: insights from developmental regulation and deregulation. Eur J Cancer. 2005; 41(16):2428–2437.
34. Jung C, Kim RS, Lee SJ, Wang C, Jeng MH. HOXB13 homeodomain protein suppresses the growth of prostate cancer cells by the negative regulation of T-cell factor 4. Cancer Res. 2004;64(9):3046–3051. 35. Jung C, Kim RS, Zhang H, et al. HOXB13 is downregulated in
col-orectal cancer to confer TCF4-mediated transactivation. Br J Cancer. 2005;92(12):2233–2239.
36. Shapovalov G, Skryma R, Prevarskaya N. Calcium channels and pros-tate cancer. Recent Pat Anticancer Drug Discov. 2013;8(1):18–26. 37. Graham SM, Holzbeierlein JM, Thrasher JB, Li B. Calcium channel
blocker modulates androgen receptor-mediated gene expression and induces cytotoxicity in prostate cancer cells. J Urol. 2012;187(4):e94.
OncoTargets and Therapy downloaded from https://www.dovepress.com/ by 118.70.13.36 on 25-Aug-2020