1
Microbial population dynamics and the role of sulfur reducing bacteria genes in stabilizing
1
Pb, Zn and Cd in the terrestrial subsurface
2 3
Ranju R. Karna,† Ganga M. Hettiarachchi†#, Joy D. Van Nostrand,‡ Tong Yuan,‡
4
Charles W. Rice, § Y. M. Assefa,† and Jizhong Zhou ‡ 5
6
†Soil and Environmental Chemistry, Department of Agronomy, Kansas State University,
7
Manhattan, Kansas 66506, United States. 8
9
§ Soil and Environmental Microbiology, Department of Agronomy, Kansas State University,
10
Manhattan, Kansas 66506, United States. 11
12
‡ Institute of Environmental Genomics and Department of Microbiology and Plant Biology,
13
University of Oklahoma, Norman, OK- 73019, United States. 14
Earth Sciences Division, Lawrence Berkeley National Laboratory, Berkeley, CA 94720, United 15
States. 16
School of Environment, Tsinghua University, Beijing 100084, China. 17
18 19
#Corresponding Author ([email protected]) 20
21
Contribution no. 15-212-J from the Kansas Agric. Exp. Stn 22
23 24 25
2
Abstract
26 27
Milling and mining metal ores are major sources of heavy metal contamination. The 28
Spring River and its tributaries in southeast Kansas are contaminated with Pb, Zn, and Cd as a 29
result of 120 years of mining activities. Trace metal transformations and cycling in mine waste 30
materials greatly influence their mobility and toxicity and affect plant productivity and human 31
health. It has been hypothesized that under reduced conditions in sulfate-rich environments, these 32
metals can be transformed into their sulfide forms, thus limiting mobility and toxicity. We 33
studied biogeochemical transformations of Pb, Zn and Cd in flooded subsurface mine waste 34
materials, natural or treated with organic carbon (OC) and/or sulfur (S), by combining advanced 35
microbiological and X-ray spectroscopic techniques to determine the effects of treatments on the 36
microbial community structure and identify the dominant functional genes involved in the 37
biogeochemical transformations, especially metal sulfide formation over time. Samples collected 38
from medium-, and long-term submerged columns were used for microarray analysis via 39
functional gene array (GeoChip 4.2). The total number of detected gene abundance decreased 40
under long-term submergence, but major functional genes abundance was enhanced with OC 41
plus S treatment. The microbial community exhibited a substantial change in structure in 42
response to OC and S addition. Sulfur-reducing bacteria genes dsrA/B were identified as key 43
players in metal sulfide formation via dissimilatory sulfate reduction. Uniqueness of this study is 44
that microbial analyses presented here in details are in agreements with molecular-scale 45
synchrotron-based X-ray data supporting that OC-plus-S treatment would be a promising 46
strategy for reducing metal toxicity in mine waste materials. 47
Keywords
483
1
Introduction
50
Generation of large amounts of mine waste containing several heavy metals is the main 51
environmental concern associated with milling and mining activities (Baker et al., 2003, 52
Bhattacharya et al., 2008). Heavy metals are dispersed via different pathways such as wind, 53
surface water runoff, and metal-laden sediments are transported to neighboring water bodies 54
(Almendras et al., 2009 and Johnson et al., 2005). The Tri-State mining district in parts of 55
southeast Kansas, southwest Missouri, and northeast Oklahoma was one of the largest Pb and Zn 56
ore-mining districts in the world for 120 years (until 1970). The movement of soluble 57
metalsand metal-laden sedimentsfrom the landscape into surfacewatersvia surface runoffare 58
the primary ecological concerns for both aquatic and terrestrial organisms (Pierzynski et al., 59
2006). The US Environmental Protection Agency (US EPA) has suggested wetland construction 60
as a remediation strategy for soils highly contaminated by abandoned mine waste materials with 61
the hypothesis that these metals could be transformed into their sulfide forms under reduced 62
conditions in sulfate-rich environments, thus limiting their mobility and toxicity. 63
Several challenges are associated with this strategy. Mine waste material with low 64
dissolved OC content could have significant effects on redox processes (Hayes et al., 2006, Stein 65
et al., 2007 and Zhang et al., 2005)because OC is the main driver of biogeochemical cycling of 66
major and trace elements (Borch et al., 2009 and Evans et al., 2006). Limited S in mine waste 67
could limit sulfide formation and promote carbonate precipitation, depending on pH and 68
carbonate concentration (Toevs et al., 2006). Therefore, the addition of OC and S could facilitate 69
these metals to be transformed back into their sulfide forms under reduced conditions, thereby 70
limiting their mobility and toxicity. A generalized sulfate reduction reaction using organic matter 71
4 SO42−+ 2CH2O + 2H+→ H2S+ 2H2O+ 2CO2 (pH<7.0): Stein (10)
73
At high metal concentrations, metals tend to precipitate as metal sulfides around circumneutral 74
pH because the rate of H2S formation increases at a pH of 7.0 to a maximum of 8.0 (Burton et
75
al., 2008 and Chen et al., 1997): 76
H2S+ M2+→MS + 2H+
77
The above-mentioned reaction is the result of dissimilatory sulfate metabolism that has 78
been tested and successfully removed contaminants via biostimulation. Of all the metal sulfide 79
minerals, iron sulfide mineralization is most often attributed to microbial activity (McLean et al., 80
2007), especially to the activity of dissimilatory sulfur-reducing bacteria (SRB). Environmentally 81
important activities displayed by SRBs are the result of metabolic production of high levels of 82
sulfides that are reactive and participate in subsequent mineral formation (Bazylinski et al., 2003 83
and Lovely et al., 1995). 84
Using a culture-dependent technique would not be feasible to study the complex 85
microbial community because 99% of microorganisms have not been cultured (Whiteman et al., 86
2004), therefore, culture-independent techniques such as functional gene arrays (FGA) are 87
required (He et al., 2007 and Van Nostrand et al., 2011). GeoChip 4.2 is a functional gene array 88
that contains 83,992 oligonucleotides (50-mer) probes targeting 152, 414 genes in 410 gene 89
categories from more than 5200 microbial strains including bacteria, archaea, fungi, and viruses. 90
These genes are involved in the biogeochemical processes and functional activities of microbial 91
communities important to human health, ecosystem management, agriculture, energy, global 92
climate change, and environmental cleanup and restoration, including N, C, S and P cycling; 93
metal reduction and resistance; and organic contaminant degradation (Tu et al., 2014). This 94
5 waste and links microbial diversity to ecosystem processes and functions (He et al., 2007 and 96
Loick et al., 2014). The approach has been used successfully to track the dynamics of metal-97
reducing bacteria and associated communities for an in situ bioremediation study (Lu et al., 98
2012, Wu et al., 2001, Van Nostrand et al., 2009 and Zhou et al., 2008). 99
Phospholipid fatty acid analysis (PLFA) is another rapid, inexpensive, and an efficient 100
way to determine the structure, and the effect of treatments on microbial community (Frostegård 101
et al., 2011). Certain PLFAs markers can serve as unique signatures for a particular group. 102
However, such biomarkers cannot detect individual microbial species due to overlapping PLFA 103
patterns; nevertheless, whole PLFA pattern is used to elucidate the shift in community 104
composition, and their relation to specific metabolic and environmental conditions (Olsson et al., 105
1999). 106
Few studies have combined microbial analysis with solution chemistry and microscopic 107
and X-ray spectroscopic techniques to develop a complete molecular-scale understanding of 108
complex biogeochemical processes affecting soil and water (Brantley et al., 2007 and Brown et 109
al., 1999). This study attempted to explore the interplay between geochemical and biological 110
processes in the transformation of Pb, Zn and Cd in natural subsurface environments 111
biostimulated by the addition of OC and S. Stimulating the systems with OC and S would favor 112
SRB growth and activities. We expect that OC-plus-S treatment would result in a higher 113
abundance of SRB genes compared with natural, OC alone, or S alone treatments. Study 114
objectives were to: a) characterize the microbial community playing a role in the biogeochemical 115
transformation of Pb, Zn and Cd under reduced conditions; b) measure the change in microbial 116
6 identify the most dominant genes and associated mechanisms involved in effective
118
immobilization of Pb, Zn and Cd. 119
2
Materials and Methods
1202.1Sample collection and characterization
121
Contaminated mine waste materials were collected from a secured repository area in Baxter 122
Springs, KS, a part of the Tri-State mining district that has a 120-year history of Pb- and Zn-ore 123
mining related activities. The material was sieved to 2-mm size, and 0.5-g sample was digested 124
in triplicate following the aqua-regia reflux tube soil-digestion method to determine the 125
concentrations of selected elements (Zarcinas et al., 1996). Total N, and C content was measured 126
using LECO TruSpec CN Carbon/Nitrogen combustion analyzer (LECO Corporation, St. Joseph, 127
MI). The pH of a water extract (water: mine waste ratio of 2:1) was determined using Orion 128
Ag/AgCl pH electrode. Particle-size distribution was determined using a modification of the 129
pipet method of Kilmer et al. (Kilmer et al., 1949), and method 3A1 from the Soil Survey 130
Laboratory Method Manual (1996). 131
2.2Treatment application and experimental setup
132
For S-treatment application, sodium sulfate (Na2SO4) solution was added to the mine waste
133
material to provide S at a ratio of 1:2 mM of sum of metals present in material: mM of S. The 134
metal concentrations used for the summation were Pb, Zn, Cd, Fe, and Mn. The treated materials 135
were equilibrated for 10 days at room temperature on a reciprocating shaker (6010, Eberbach 136
Corporation, Ann Arbor, MI) at 192 reciprocates/min for 3 days, and at 92 reciprocates/min for 137
the remaining 7 days. After equilibration, S-treated mine waste was leached with deionized (DI) 138
water to reduce salinity until a target electrical conductivity of <2 mS cm-1 was achieved, then
139
7 with 0.5 g 100g-1 of soil slurry (Ivan, Kennebec, and Kahola silt loams) collected from the North
141
Agronomy Farm at Kansas State University, Manhattan, KS. The serial dilution of soil slurry 142
was cultured on a Petri dish using Postgate’s medium and incubated overnight at 34 ºC in an 143
anaerobic jar (AG0025A used with oxygen absorber; OXAN0025A, Fisher Scientific, 144
Pittsburgh, PA). The black patches observed on the plate indirectly confirmed the presence of 145
SRB in the soil slurry. The method used for SRB culturing was adapted from Luptakova et al. 146
(Luptakova et al., 2005). The mine waste materials (non-treated or treated with S) were well 147
mixed with soil slurry and used to pack Plexiglas columns (20 cm length, 3.2 cm ID with 3 148
windows milled at 2.8 cm, 9.84 cm, and 16.94 cm) to achieve a bulk density of about 1.7 g cm-3.
149
The packed columns were saturated slowly with DI water using a Mariotte’s bottle that delivered 150
a constant flow rate before the eluent solution was supplied. The eluent consisted of a base of 151
simulated groundwater (1 mM NaCl, 1mM MgCl2, 1 mM KCl, 1 mM CaCl2 adjusted to pH 7.2)
152
with or without 10.7 mM Na-lactate (32 mM OC). This eluent provided four treatments for the 153
columns designated as C0S0, C1S0, C0S1, and C1S1, where C0 and C1 designated simulated 154
groundwater without OC and with OC, respectively; S0 designated simulated groundwater 155
applied to columns without added S; and S1 designated simulated groundwater applied to 156
columns with added S. Each treatment combination had two replicates due to limited space 157
available in the glovebox. The eluent solution was supplied using a syringe pump (KD Scientific 158
Inc., Holliston, MA) at the rate of 13 mm day-1 to simulate a slow groundwater discharge rate 159
(Wan et al., 2005).Three series of column experiments, short (32-day), medium (119-day), and 160
long-term (252-day), were conducted at room temperature ~25 °C at different times due to the 161
lack of space in the anaerobic chamber to conduct them all simultaneously. All three series of 162
8 experiment (factor 1: OC with two levels, 0 and 10.7 mM L-1; factor 2: S with two levels; 0 and
164
252.7 mg kg-1). Effluent samples were collected weekly for medium-term and biweekly for long-165
term submergence, and analyzed for pH, redox potential, total dissolved elements measurements 166
for Pb, Cd, Zn, Fe, S, Mn, K, Ca, Mg, Na, anions including sulfate, nitrate, nitrite, chloride, 167
phosphate, and dissolved organic carbon (DOC) measurements. At the end of each column 168
experiment, samples (about 20 g) were collected from three windows located on the columns and 169
frozen at -80 °C for DNA extraction, and x-ray absorption spectroscopy (XAS). More details on 170
solution chemistry data collection, and approaches used in synchrotron-based X-ray analysis, and 171
their outcomes can be found in Karna et al. (2016). 172
2.3Phospholipid fatty acid (PLFA) analysis
173
The PLFA analysis was performed as an initial measurement to determine the microbial 174
community changes with OC and S treatment prior to microarray analysis was performed. For 175
this, PLFA extraction was done on the original mine waste materials, and submerged C0S0, and 176
C1S1 treatments from medium term study only based on single phase extraction of lipids, which 177
was then methylated to give fatty acids methyl esters (FAME) and analyzed by gas 178
chromatograph. The PLFA extraction was performed by following the method of Bligh and Dyer 179
(1959) as modified by White and Ringlberg (1998). The resulting FAMES were analyzed using a 180
Thermo Scientific Trace GC-ISQ mass spectrometer (Thermo Scientific, Germany) with helium 181
as a carrier gas. Analysis was conducted in the electron impact (70 eV) mode. Peaks were 182
identified based on retention times of commercially available bacterial acid methyl esters 183
(BAME; Matreya 1114) standard mix. The methyl ester peaks that were not present in the 184
BAME mix were tentatively assigned through mass spectral interpretation by comparison with 185
9 on comparison of the abundance with an internal standard - nonadecanoic acid methyl ester 187
(19:0). The abundance was expressed as nmoles/gram. Fatty acids (FA) are designated a:b, 188
where ‘a’ represents total number of carbons and b the number of double bonds. An ‘ω’ indicates 189
the position of a double bond from the aliphatic end of the FA. The prefixes ‘a’ and ‘i’ refer to 190
anteiso and iso branching, while the suffixes ‘c’ and ‘t’ refers to cis and trans 33 isomers 191
(conformations). Presence of methyl groups are indicated by aMe, where ‘a’ indicates the 192
position of the methyl group. Fatty acids were grouped based on criteria by McKinley et al. 193
(2005) whereby Gram positive bacteria were branched monounsaturated cyclopropane (i-15:0, a-194
15:0, i-16:0, i-17:0 and a-17:0). Gram negative biomarkers are cyclopropane PLFAs (2-OH 12:0, 195
3-OH 12:0, 2-OH 14:0, 3-OH 14:0, 2-OH 16:0, C16_1_9_cis, C16_0_2-OH, 16:1ω7c, 18:1ω7c, 196
cy17:0, cy19:0), while actinomycetes is 10Me18:0. Fungi biomarkers are polyunsaturated 197
PLFAs (18:1ω5c, 18:2ω9, 12C, 18:2ω6,9,12), while arbuscular mycorrhizae fungi (AMF) is 198
16:1ω5c, and Desulfoviobrio biomarker is i_17_1 (McKinley et al., 2005). 199
2.4GeoChip analysis
200
Microarray analysis was performed on all the treatment combinations; C0S0, C0S1, C1S0, C1S1 201
from medium term study, whereas only C0S0 and C1S1 treatment combinations were used from 202
long-term study. The samples selection for long-term study was done based on the geochemical 203
and spectroscopic results obtained from medium-term study. Due to lack of space issue in the 204
glovebox chamber, we used two replicates for each treatment combination. Rather than running 205
microbial analysis for those two replicates, we did generate an additional replicate by mixing 206
equal portions materials of 1 and 2 column replicates and ran that as an independent 207
10
2.5 DNA extraction, labeling, hybridization, scanning, and data processing
209
About 5 g of soil was used for genomic DNA extraction using the PowerMaxsoil DNA isolation 210
kit (Mo Bio, Carlsbad, CA). Raw DNA extracts were purified using Wizard Plus SV Minipreps 211
purification system (Promega Biosciences, San Luis Obispo, CA). Purified DNA was quantified 212
using the Quant-iT PicoGreen dsDNA assay kit (Promega Biosciences, San Luis Obispo, CA). 213
DNA was labeled then hybridized at 42 °C on GeoChip 4.2 as described in Lu et al. (2012). The 214
hybridized arrays were scanned with a NimbleGen MS 200 Microarray Scanner, and scanned 215
images were extracted and quantified using Nimble Scan software (Roche NimbleGen, Madison, 216
WI), followed by data preprocessing (Lu et al., 2012). Positive and negative controls, including 217
(i) 8 degenerate probes targeting 16S rRNA sequences for positive controls, (ii) 563 strain-218
specific probes targeting 7 hyper-thermophile genomes for negative controls, and (iii) a common 219
oligonucleotide reference standard for data normalization and comparison was included for grid 220
alignment and data normalization and comparison (Liang et al., 2011). Statistical analyses were 221
performed using SAS for Windows version 9.2 (SAS Institute Inc., 2009). The data were 222
analyzed using PROC ANOVA. Tukey’s Honestly Significant Difference (HSD) test was used 223
for means separation (α = 0.05). Dissimilarity test was also conducted by using the software 224
available at Institute of Environmental genomics (IEG) website, OU, OK (Table S3). All 225
hybridization data are available at http://www.agronomy.k-state.edu/research/soil-and-226
environment/soil-environment-chem/Research%20Data.html. 227
3
Results
2283.1General characterization of mine waste materials
229
The mine waste material consisted of 85% sand (2000 to 50 µm), 11.3% silt (50 to 2 µm), and 230
3.4% clay (<2 µm). Total N and C were 0.03 g kg-1 and 1.56 g kg-1, respectively. The pH of the
11 water extract (DI water: geomaterial mass ratio, 2:1) was 7.2, and the electrical conductivity was 232
2.31 mS cm-1. Selected total elemental concentrations of Pb, Zn, and Cd in the material were 233
5048, 23,468, and 67 mg kg-1,respectively (Table S2). The standard reference material 2711a 234
(National Institute of Standards and Technology, Gaithersburg, MD) was digested along with the 235
geomaterial to ensure a recovery percentage of each element that ranged from 79 to 109%. 236
3.2. Preliminary microbial community characterization
237
The PLFA analysis results on starting original mine tailings, inoculum, non-amended control, 238
and amended soils submerged for 119-day indicated the presence of biomarkers for various 239
microbial groups (Gram-, Gram+, AMF, fungi, and Actinomycetes). Total PLFA in starting mine 240
waste materials was 2.42 nmole/g, whereas it was 6.18 nmole/g in the submerged sediment that 241
was used as inoculum (Table S1). Once the materials were inoculated and submerged, no 242
significant increase in summed abundance of PLFA biomarkers was observed in non-amended 243
control (C0S0), whereas it was significantly increased in the samples treated with both OC plus S 244
(C1S1). Specifically, Gram-, and Gram+ biomarkers abundance was significantly increased in 245
amended soil, with respect to starting mine waste materials, whereas there was no noticeable 246
difference in non-amended soil. Fungi biomarker abundance was decreased with varied amount 247
in both untreated and treated soils under submergence. AMF and Actinomycetes PLFA 248
biomarkers were also decreased, however remains same in both non-amended and amended 249
samples. More interestingly, total PLFA for Desulfovibrio biomarkers was significantly 250
increased in OC plus S treated soil only (Table S1). 251
3.3. X-ray absorption spectroscopy
252
Multiple synchrotron-based techniques have been used to enhance quantitative mineral species 253
12 XRD techniques were used to identify the minerals in the original mine waste materials in this 255
study. The results in agreement between µ-XRD and bulk XAFS techniques indicated presence 256
of carbonates, sulfates, silicates, and oxides minerals, which are supported by other studies 257
conducted on smelter-impacted soils (Manceau et al., 2000a, Nachtegaal et al., 2005 and 258
Scheinost et al., 2002). Bulk-XAFS speciation conducted for Pb, Zn and Cd in starting mine 259
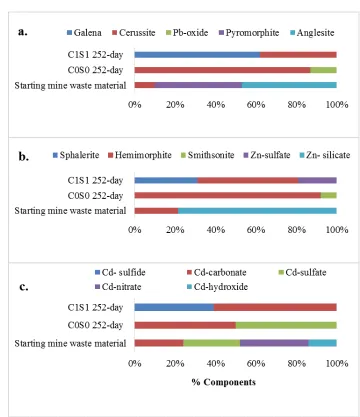
waste materials that was used in this study indicated none sulfide minerals, whereas it was 260
dominant with silicates, carbonates, sulfates, phosphates, nitrates and hydroxides minerals (Fig. 261
1a, 1b and 1c). Speciation changed after the mine waste material was treated with OC and/or S, 262
and submerged for different time period. Bulk XAS data indicated about 62% galena (PbS), 31% 263
sphalerite (ZnS) and 39% Cd-sulfide formation in C1S1 compared to none in C0S0 (Fig. 1a, 1b 264
and 1c), respectively under long-term incubation. Instead, more carbonates were formed in non-265
amended (C0S0) flooded materials (Karna et al., 2016). Functional gene diversity 266
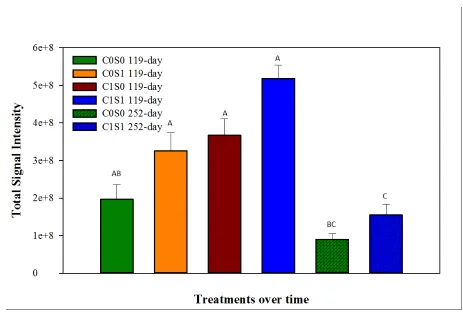
Functional gene richness, indicated by the total number of genes detected, was significantly 267
increased in C1S1 compared to C0S0 under medium-term submergence (Fig. 2). In contrast, 268
under long-term submergence, the total number of detected genes significantly decreased in both 269
C0S0, and C1S1 treatment (Fig. 2). 270
3.4. Relationships among microbial communities
271
Detrended correspondence analysis (DCA) was used to examine the overall functional structure 272
changes in microbial communities with the OC-plus-S treatment under medium- and long-term 273
submergence. In the DCA ordination plot, similar samples cluster closely (Ramette et al., 2007). 274
The overall DCA ordination plot obtained from all detected genes resulted in clear clustering of 275
13 277
When samples from medium- and long-term submergence were plotted individually, 278
separate clusters for each treatment were formed (Fig. S1), indicating an overall effect of OC 279
and/or S treatments and time on the community structure in relation to geochemistry dynamics 280
and enhanced reduction (Fig. 3). DCA analysis with metal resistance genes showed a separate 281
cluster for C1S1 but there was some overlap among the rest of the treatments under medium-282
term submergence (Fig. S2), however clearer clusters were formed for both C0S0 and C1S1 283
under long-term submergence. Interestingly, the DCA ordination plot of C-cycling genes 284
indicated clear cluster for C1S0 when only OC was added (Fig. S3). Similarly, the DCA plots of 285
S-cycling category, and S-genes such as dsrA and dsrB segregated much clearly for C0S1 and 286
C1S1 when S was added, whereas no overlapping was observed with rest of the other treatments 287
(Fig. S4, S5, S6). Under longer submergence, both treatments, C0S0 and C1S1 samples made 288
separate clusters under each category. Overall, DCA results for metal resistance and S-cycling 289
genes showed clear clusters for the treatments submerged for both medium and long term, but 290
the DCA ordination plot for C-cycling genes showed slight overlapping. The DCA of individual 291
S-cycling genes: dsrA, dsrB (Fig. S5, S6) revealed clearer clusters with dsrB compared with 292
dsrA genes. 293
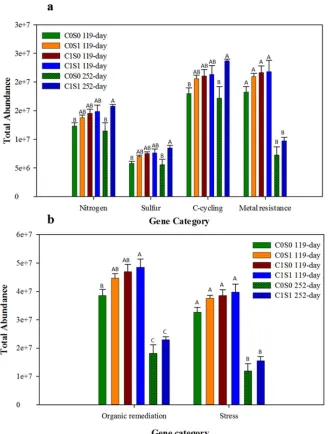
3.5. Total abundance of functional gene categories
294
The shifts that were observed in the DCA ordination plots were likely the result of changes in 295
total abundance of functional genes. Results from individual gene categories revealed that S- and 296
C-cycling functional gene abundance was enhanced by 35% and 27%respectively, in C1S1 297
14 remediation functional genes decreased by 26% (Fig. 4a) and 21% (Fig. 4b), respectively, in 299
C1S1 compared with C0S0. 300
Thus, significant enrichment of S- (ρ = 0.01) and C-cycling genes (ρ = 0.01) and a large 301
decrease in metal resistance (ρ = 0.001) and organic remediation genes by 50 to 60% (ρ = 0.001) 302
within both treated and untreated samples over time could have resulted in community structure 303
changes. Functional genes involved in S- and C-cycling were significantly enhanced in C1S1 304
despite the fact that the total number of detected genes decreased under long-term submergence, 305
indicating direct involvement of S- and C-cycling genes in biogeochemical transformation 306
processes. 307
3.6 Changes in S-, C-cycling, and metal resistance genes
308
To better understand the differences observed in the categories above, changes in individual 309
genes were examined. Sulfate-reducing bacteria mediate the direct and indirect reduction of 310
heavy metals and metalloids (Chen et al., 1997 and White et al., 2000), and have been considered 311
key players in anaerobic bioremediation for contaminated soils, waters, and subsurface (Janssen 312
et al., 2004 and Kirk et al., 2002). In SRB, the dsr gene encodes the dissimilatory sulfite 313
reductase enzyme with subunits, and A/B is a key enzyme in reducing sulfite to sulfide and is 314
required by all sulfate reducers (Klein et al., 2004). Thus, dsr genes provide insight into SRB 315
activities and their functional role in sulfate reduction. Under S-cycling, dsrA, dsrB, and csyJ 316
were more abundant by 31% (ρ = 0.01), 35% (ρ = 0.01), and 40% (ρ = 0.002), respectively, in 317
C1S1 compared with C0S0 under long-term submergence (Fig. 5a), indicating their major role in 318
dissimilatory sulfate reduction. Similarly, among C-cycling functional genes, phenol oxidase and 319
endochitinase were the most dominant genes and were 35% (ρ = 0.002) and 30% (ρ = 0.017) 320
15 and Pb were examined, and cadA (Cd resistance gene), czcA (Cd, Zn, and Co resistance gene), 322
and pbrA (Pb resistant gene) decreased by 29% (ρ=<0.001), 24% (ρ =0.002), and 15% (ρ = 323
0.002), respectively, in C1S1 compared with C0S0 over time (Fig. 5c). 324
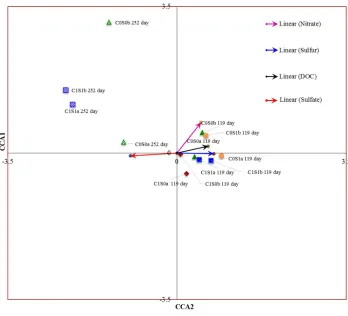
Canonical correspondence analysis (CCA) was performed to examine the relationship 325
between microbial community structure and geochemistry (Fig. 6) to correlate environmental 326
variables with the functional community structure and determine the most significant variable 327
causing the change in community structure. Environmental variables such as dissolved organic 328
carbon (DOC), SO42-, total S, and NO3- were used to perform CCA.
329
In CCA, environmental variables are represented as arrows starting at the origin and 330
pointing outward. Our CCA results show that DOC and S are closer, with a small angle 331
indicating these variables have a stronger correlation and have similar influence on microbial 332
communities. Dissolved organic carbon and NO3- had longer arrows with larger angles,
333
indicating these variables have a stronger influence on the microbial community but in a 334
different manner. The SO42- and total S vectors are in opposite directions, indicating that these
335
factors are negatively correlated. This could be explained as the total difference between total 336
sulfur and sulfate is sulfide indicating that under high S concentrations, sulfide formation has 337
been favored. 338
4.0. Discussions
3394.1. Preliminary microbial community characterization 340
The contaminants effects on in situ microbiota are generally continuous, and may trigger the loss 341
or emergence of a particular genera or species of microorganism (Smith et al., 1986). The higher 342
abundance of gram+, and fungi biomarkers were present in the starting materials as these 343
16 very less nutrients. On addition of inoculum followed by OC and S treatment, changes in PLFA 345
composition and biomass was detected compared to non-amended soil in medium-term 346
submergence. This suggests that the OC and S additions in this study favored microbial growth 347
pattern and composition resulting in change of microbial community structure. Specifically, 348
branched monounsaturated cyclopropane PLFAs, characteristic of Gram+ bacteria, and 349
cyclopropane PLFAs, characteristic of Gram- bacteria abundance, and branched fatty acid, i17:1, 350
characteristics of Desulfovibrio were increased on OC and S amendment indicating that these 351
PLFA biomarkers could be the main contributors in microbial community structure change in 352
amended soil. The increased abundance of those microbial communities could be due to added 353
OC and S, their prior presence, and their capability to survive in adverse situation, and difference 354
in substrate utilization (Bossio et al., 1998 and Ibekwe et al., 1998).Another reason could be due 355
to increased metal resistance genes. Several gram+, and gram- soil bacteria isolated from a Pb-356
contaminated sites have exhibited resistance to a range of metal ions such as Pb, Zn, Cu, Cd, Co, 357
and Hg (Trajanovska et al., 1997). The significant increase in Desulfovibrio biomarker could be 358
result of dissimilatory sulfate reduction happening in the system due to OC and S addition. 359
4.2. Relationships among microbial communities
360
Detrended correspondence analysis conducted based on time effect indicated that there was not 361
very clear clustering of microbial community based on OC and/or S treatments under medium-362
term submergence. Relatively more overlapping among the samples from C1S0, C0S1, and 363
C0S0 systems were observed compared to C1S1 (Fig. S2), and that suggests some closer 364
associated microorganisms from these treatments. The closely associated microbes could be due 365
to common, and flexible substrate utilization preference. Comparatively, lesser or no overlap was 366
17 among the clusters from these two treatments under different category increased with time 368
depending on their involvement in microbial community structure changes. This supports the 369
fact that time was another dominant factor in determining the microbial community structure. 370
The positive effect of OC, S, and N via increase in corresponding functional genes abundance 371
and the impact on change in microbial community structure has been observed by several studies 372
(Fuhrman et al., 2009, Kleikemper et al., 2002 and Tokunaga et al., 2003). Overall, DCA results 373
indicated that the decreases in metal resistance and organic remediation functional genes and 374
enrichment in S- and C-cycling functional genes were mainly involved in the observed 375
community shift. 376
4.3. Functional gene diversity
377
The significant increase in microbial community abundance in C1S1 followed by a significant 378
decline may indicate rapid oxidation of added OC coupled with a reduction in available terminal 379
electron acceptors (TEAs) and a subsequent decline as suitable TEAs were exhausted. This result 380
could be explained by the trend that was observed with DOC concentration in the current study. 381
Initial concentration of DOC in the eluent was 32 mM but was reduced to 30 mM in effluent at 382
7-day submergence and further decreased to <detection limit (DL) under long-term submergence 383
in OC-added treatments. On the other hand, non-OC-treated columns showed <3 mM DOC, with 384
no significant change during long-term submergence (Table 1). A similar result was reported by 385
Brodie et al. (2006), in which initial enrichment in total functional genes was observed with OC 386
addition and subsequently declined, but no such enhancement in functional gene richness was 387
observed without OC addition. Therefore, we speculate that this results could be owing to 388
18 Table 1. Chemical data for the effluent samples collected after medium- (119-day) and long- 390
(252-day) term submergence. The soil samples collected at these time points were used for 391
microarray analysis. 392
Previous studies revealed that the addition of OC stimulated biomass and microbial 393
activity in these typically nutrient-poor environments and had a significant effect on microbial 394
biomass, microbial community structure, and functional genes (Holmes et al., 2002, Martin et al., 395
2002 and Yergeau et al., 2007). Sufficient labile OC must be available for sulfate reduction and 396
is a key rate-limiting factor in metal sulfide formation (Ku et al., 2008 and Morse et al., 1999). 397
This process can be accelerated by the action of indigenous microorganisms fueled through the 398
addition of exogenous carbon (Khan et al., 2010). The change in microbial community structure 399
was observed because of direct and indirect involvement of certain functional genes that was also 400
reported in the study, bioremediation of U using the microarray conducted by Van Nostrand et 401
al. (2011). Several other studies conducted using other techniques, such as phospholipid fatty 402
acid analysis (PLFA) and polymerase chain reactions-denaturing gradient gel electrophoresis 403
(PCR-DGGE), reported changes in microbial community structure with the addition of OC as a 404
substrate (Calbrix et al., 2007, Griffiths et al., 1998 and Eiler et al., 2003). 405
As previously mentioned, some of these genes represent background populations, 406
whereas others may be directly involved in bio-reduction (Van Nostrand et al., 2011). For 407
example, if organic remediation genes are considered to represent background functional genes, 408
their significant decrease (Fig. 4b) is probably owing to an increase in genes directly involved in 409
bio-reduction (i.e., dsrA/B) rather than a true reduction in organic remediation genes, because 410
they are likely not involved in bio-reduction; the similar result was also reported by Van 411
19
4.4. Total abundance of functional gene categories
413
The abundance of stress-related functional genes and metal resistance genes decreased during 414
long-term submergence, with both C1S1 and C0S0 indicating that in addition to OC and S, 415
submergence time played a role in decreasing toxicity in these systems. Heavy metals are 416
predicted to represent a major stress on the microbial community, and adaptation to metal stress 417
may be of particular importance in shaping microbial community structure (Hemme et al., 2010). 418
Several studies have indicated the impact of heavy metals on microbial activities and their 419
community structure (Khan et al., 2010 and Hemme et al., 2010). A study conducted on the 420
effects of Pb and Cd on soil microbial activities and their community structure via denaturing 421
gradient gel electrophoresis (DGGE) indicated that Pb and Cd together decreased the number of 422
bacteria when no nutrients were supplied and revealed a significant impact on community 423
structure dynamics, particularly at high Pb and Cd concentrations (Khan et al., 2010). Increased 424
activity of S-cycling functional genes could be owing to readily available sulfate as TEA under 425
more reduced conditions, thereby favoring dissimilatory sulfate reduction as reported before by 426
Brodie et al. (2006) and Muyzer et al. (2008). In the current study, the relationship observed 427
between enhanced dissimilatory sulfate reduction and increased S-cycling functional genes can 428
be further supported by the decreased sulfate-S concentration in effluent samples (Table 1) and 429
the increased metal sulfide formation (Fig. 1a, 1b and 1c). Direct involvement of C-cycling and 430
S-cycling genes in dissimilatory S reduction via rapid consumption of OC followed by sulfate 431
reduction were also reported before by Huerta-Diaz et al. (1998).The changes in microbial 432
communities’ result in changes in functional gene abundances. 433
Metal precipitation is one of the most significant processes involved in the long-term retention of 434
20 reductive metal precipitation (such as redox transformation), including dissimilatory sulfate 436
reduction and the subsequent precipitation of metal sulfides (Huerta-Diaz et al., 1998). As 437
reported in Karna et al. (2016), our results also suggest that appropriate microbial communities 438
were stimulated by OC- and/or S- treatments and resulted in rapid immobilization of Pb, Zn, and 439
Cd in both C1S0 and C1S1 under medium- and long-term submergence. The reduction of metals 440
concentration in solution were most likely due to biogeochemical transformations of Pb, Zn and 441
Cd under reduced conditions. This was supported by bulk XAS, indicating increasing galena 442
(PbS), sphalerite (ZnS), and cadmium sulfide formations in C1S1over time (Karna et al., 2016). 443
Similar amount of galena formation was also observed in C1S0. Limited S concentration and 444
enhanced pH in C1S0 treatment, however, could lead metal carbonates to be more stable in long 445
run, which are not as stable as sulfide minerals, and controlling metal solubility. Therefore, 446
treatment with both OC and S will be more promising as metal sulfides are more resistant to 447
oxidation, and less sulfide formation is needed to maintain permissibly low metal concentrations 448
in water for a longer period of time. 449
A handful of studies have examined non-redox-sensitive element removal via constructed 450
wetland treatment systems (Almendras et al., 2009 and White et al., 2000). Earlier studies by 451
Almendras et al. (6) tested Pb, Cu, and Zn stability via sulfide formations and showed that 452
biostimulation plays a vital role in stabilizing Pb, Zn and Cd in the subsurface environment. The 453
results from our study also suggest that wetland construction can be a better alternative for 454
stabilizing non-redox-sensitive elements such as Pb, Zn and Cd in mine waste materials or 455
similar geomaterial. Uniqueness of this study is that microbial analyses presented here in details 456
are in agreements with molecular-scale synchrotron-based X-ray data (Karna et al., 2016). 457
21 our understanding of the biogeochemical processes involved in Pb and Zn removal via
459
dissimilatory sulfate reductions under reduced conditions. The results obtained from the current 460
study indicate that OC and S addition stimulated microbial growth and activities, causing 461
changes in the functional microbial community structure via enhancement or reduction of 462
functional genes in saturated mine waste materials enriched with Pb and Zn. The decrease in 463
metal resistance genes indicated reduced toxicity over time. Correspondingly, enrichment in S- 464
and C-cycling genes in OC- and/or -S-treated samples corroborated that these members made 465
significant contributions to the metal stability in the highly contaminated mine waste in a 466
subsurface environment. Sulfur-reducing bacteria gene dsrA/B appeared to be a key player in 467
forming metal sulfides and was significantly enhanced in C1S1 during long-term submergence. 468
On the other hand, no significant difference was detected in functional gene richness in any 469
C0S0 treatment category over time. The information obtained from this study help us conclude 470
that biostimulation would be beneficial for inducing metal sulfide formations in mine waste 471
materials and that SRBs can be used as key players in in situ bioremediation of Pb and Zn in 472
subsurface treatment wetlands. 473
Supplementary Materials
474There are six supplementary figures and three supplementary tables provided in this document. 475
Acknowledgements
476We acknowledge the funding support of this study by the Kansas Agricultural 477
Experimental Station, and the USDA National Institute of Food and Agriculture, Hatch Project 478
NC-1187. We thank Drs. Gary M. Pierzynski, Gerard Kluitenberg, and Saugata Datta, for their 479
helpful suggestions and insightful discussions. We also acknowledge Ye Deng for his help with 480
22 for providing lab space to conduct initial procedure in DNA extraction and purification
482
procedures. We are also thankful to Dorothy Menefee for her help during experimental set up, 483
and Pavithra P. Arachchige for help during data collection. 484
Author’s contributions
485R.R.K. conceived, designed, and performed the experiments with the support of G.M.H., and 486
wrote the paper with input from G.M.H. T.Y. assisted in collecting the microarray data at the 487
institute of Environmental Genomics. J.D.V., C.W.R., and J.Z. assisted in data analysis and data 488
interpretation. Y.M.A. assisted in statistical analysis. 489
Conflicts of Interest
4901
References
492
Almendras M., Wiertz, J., & Chamy R. (2009). Heavy metals immobilization in contaminated 493
smelter soils using microbial sulfate reduction. Advanced Materials Research, 71, 577-580. 494
Bazylinski, D. A., & Frankel, R. B. (2003). Biologically controlled mineralization in 495
prokaryotes. Reviews in Mineralogy and Geochemistry, 54, 217-247. 496
Bhattacharya, J., Ji, S. W., Lee, H. S., Cheong, Y. W., Yim, G. J., & Min, J. S. (2008). Treatment 497
of acidic coal mine drainage: Design and operational challenges of successive alkalinity 498
producing systems. Mine Water and the Environment, 27, 12-19. 499
Bligh, E. G., & Dyer, W. J. (1959). A rapid method of total lipid extraction and purification. 500
Canadian Journal of Biochemistry and Physiology, 37, 911-917. 501
Borch, T., Kretzschmar, R., Kappler, A., Cappellen, P. V., Ginder-Vogel, M., & Voegelin, A. 502
(2009). Biogeochemical redox processes and their impact on contaminant dynamics. 503
Environmental Science and Technology, 44, 15-23. 504
Bossio, D. A., & Scow, K. M. (1998). Impacts of carbon and flooding on soil microbial 505
communities: phospholipid fatty acid profiles and substrate utilization patterns. Microbial 506
Ecology, 35, 265-278. 507
Brantley, S. L., Goldhaber, M. B., & Ragnarsdottir, K. V. (2007). Crossing disciplines and scales 508
to understand the critical zone. Elements, 3, 307-314. 509
Brodie, E. L., Desantis, T. Z., Joyner, D. C., Baek, S. M., Larsen, J. T., & Andersen, G. L. 510
(2006). Application of a high-density oligonucleotide microarray approach to study bacterial 511
population dynamics during uranium reduction and reoxidation. Applied Environmental and 512
2 Brown, G. E., Foster, A. L., & Ostergen, J. D. (1999). Mineral surfaces and bioavailability of 514
heavy metals: A molecular perspective. Current Issue, 96, 3388-3395. 515
Burton, E. D., Bush, R. T., Sullivan, L. A., & Mitchell, D. R. (2008). Schwertmannite 516
transformation to goethite via the Fe (II) pathway: Reaction rates and implications for iron– 517
sulfide formation. Geochimica et Cosmochimica Acta, 72, 4551-4564. 518
Calbrix, R., Barray, S., Chabrerie, O., Fourrie, L., & Laval, K. (2007). Impact of organic 519
amendments on the dynamics of soil microbial biomass and bacterial communities in cultivated 520
land. Appllied Soil Ecology, 35, 511-522. 521
Chen, X., Wright, J. V, Conca, J. L., & Peurrung, L. M. (1997). Effects of pH on heavy metal 522
sorption on mineral apatite. Environmental Science and Technology, 31, 624-631. 523
Eiler, A., Langenheder, S., Bertilsson, S., & Tranvik, L. J. (2003). Heterotrophic bacterial growth 524
efficiency and community structure at different natural organic carbon concentrations. Applied 525
and Environmental Microbiology, 69, 3701-3709. 526
Evans, M., Warburton, J., & Yang, J. (2006). Eroding blanket peat catchments: Global and local 527
implications of upland organic sediment budgets. Geomorphology, 79, 45-57. 528
Frostegård, Å., Tunlid, A., & Bååth, E. (2011). Use and misuse of PLFA measurements in 529
soils. Soil Biology and Biochemistry, 43, 1621-1625. 530
Fuhrman, J. A. (2009). Microbial community structure and its functional implications. Nature, 531
459, 193-199. 532
Griffiths B, Ritz K, Ebblewhite N, & Dobson G. (1998). Soil microbial community structure: 533
Effects of substrate loading rates. Soil Biology and Biochemistry, 31, 145-153. 534
Hayes, J. M., & Waldbauer, J. R. (2006). The carbon cycle and associated redox processes 535
3 He, Z., Gentry, T. J., Schadt, C. W., Wu, L., Liebich, J., & Chong, S. C. (2007). GeoChip: A 537
comprehensive microarray for investigating biogeochemical, ecological and environmental 538
processes. International Society of Microbial Ecology Journal, 1, 67-77. 539
Heald, S. M., J. O. Cross, D. L. Brewe, & R. A. Gordon. (2007). Nuclear instruments and 540
methods in physics research section a: accelerators, spectrometers, detectors and associated 541
equipment. Proceedings of the National Conference of Synchrotron Radiation Research, 582, 542
215-217. 543
Hemme, C. L., Deng, Y., Gentry, T. J., Fields, M. W., Wu, L., & Barua, S. (2010). Metagenomic 544
insights into evolution of a heavy metal-contaminated groundwater microbial community. 545
International Society of Microbial Ecology Journal, 4, 660-672. 546
Holmes, D. E., Finneran, K. T., O'Neil, R. A., & Lovley, D. R. (2002). Enrichment of members 547
of the family Geobacteraceae associated with stimulation of dissimilatory metal reduction in 548
uranium-contaminated aquifer sediments. Applied and Environmental Microbiology, 68, 2300-549
2306. 550
Huerta-Diaz, M. A., Tessier, A., & Carignan, R. (1998). Geochemistry of trace metals associated 551
with reduced sulfur in freshwater sediments. Applied Geochemistry, 13, 213-233. 552
Ibekwe, A. M., & Kennedy, A. C. (1998). Phospholipid fatty acid profiles and carbon utilization 553
patterns for analysis of microbial community structure under field conditions. FEMS Microbiol 554
Ecology, 26, 151-163. 555
Janssen, G. M., & Temminghoff, E. J. (2004). In situ metal precipitation in a zinc- contaminated, 556
aerobic sandy aquifer by means of biological sulfate. Environmental Science and Technology, 557
4 Johnson, D. B., & Hallberg, K. B. (2005). Acid mine drainage remediation options: A review. 559
Science of the Total Environment, 338, 3-14. 560
Karna, R. R., Hettiarachchi, G. M., Newville, M., Sun, C. J. & Ma, Q. (2016). Synchrotron-561
Based X-Ray Spectroscopy Studies for Redox-Based Remediation of Lead, Zinc, and Cadmium 562
in Mine Waste Materials. Journal of Environmental Quality, 45,1883-1893. 563
Khan, S., Hesham, A. E., Qiao, M., Rehman, S., & He, J. (2010). Effects of Cd and Pb on soil 564
microbial community structure and activities. Environmental Science and Pollution Research, 565
17, 288-296. 566
Kilmer, V. J., & Alexander, L. T. (1949). Methods of making mechanical analyses of soils. Soil 567
Science Society of America Journal, 68, 15-24. 568
Kirk, M. F., Holm, T. R., Park, J., Jin, Q. S., Sanford, R. A., Fouke, B. W., & Bethke, C. M. 569
(2002). Bacterial sulfate reduction limits natural arsenic contamination in groundwater. Geology. 570
32, 953–956. 571
Kleikemper, J., Schroth, M. H., Sigler, W. V., Schmucki, M., Bernasconi, S. M., & Zeyer, J. 572
(2002). Activity and diversity of sulfate-reducing bacteria in a petroleum hydrocarbon-573
contaminated aquifer. Applied and Environmental Microbiology, 68, 1516-1523. 574
Klein, M., Friedrich, M., Roger, A. J, Hugenholtz, P., Fishbain, S., Abicht, H., Blackall, L. L., 575
Stahl, D. A., & Wagner, M. (2004). Multiple lateral transfers of dissimilatory sulfite reductase 576
genes between major lineages of sulfate-reducing prokaryotes. Journal of Bacteriology, 183, 577
6028-6035. 578
Ku, T. C. W., Kay, J., Browne, E., Martini, A. M., Peters, S. C., & Chen, M. D. (2008). 579
5 sulfur, and carbon diagenetic properties, Saint Lucia, Lesser Antilles. Mar. Geology, 249, 184-581
205. 582
Liang, Y. T., Van Nostrand, J. D., Deng, Y., He, Z. H., Wu, L. Y., Zhang, X., Li, G. H., & Zhou, 583
J. Z. (2011). Functional gene diversity of soil microbial communities from five oil-contaminated 584
fields in China. International Society of Microbial Ecology Journal, 5, 403-413. 585
Loick, N., & Weisener, C. (2014). Novel molecular tools to assess microbial activity in 586
contaminated environments. Geomicrobiology and Biogeochemistry, pp. 17-35. 587
Lovley, D. R. (1995). Bioremediation of organic and metal contaminants with dissimilatory 588
metal reduction. Journal of Industrial Microbiology and Biotechnology, 14, 85-93. 589
Lu, Z., Deng, Y., Van Nostrand, J. D., He, Z., Voordeckers, J., & Zhou, A. (2012). Microbial 590
gene functions enriched in the deep water horizon deep-sea oil plume. International Society of 591
Microbial Ecology Journal, 6, 451-460. 592
Luptakova, A., & Kusnierova, M. (2005). Bioremediation of acid mine drainage contaminated by 593
SRB. Hydrometallurgy, 77, 97-102. 594
Manceau, A., Marcus, M. A., & Tamura, N. (2002). Quantitative speciation of heavy metals in 595
soils and sediments by synchrotron x-ray techniques. In: P.A. Fenter et al., editors, Applications 596
of synchrotron radiation in low-temperature geochemistry and environmental sciences. Reviews 597
in Mineralogy and Geochemistry, 49, 341-428. 598
Manceau, A. B., Lanson, B., Schlegel, M. L., Harge, J. C., Musso, M., Eybert-Berard, L., 599
Hazemann, J. L., Chateigner, D., & Lamble, G. M. (2000a). Quantitative Zn speciation in 600
smelter-contaminated soils by EXAFS spectroscopy. American Journal of Science, 300, 289-601
6 Martin, T., Oswald, O., & Graham, I. A. (2002). Arabidopsis seedling growth, storage lipid 603
mobilization, and photosynthetic gene expression are regulated by carbon: Nitrogen availability. 604
Plant Physiology, 128, 472-481. 605
McKinley, V. L., Peacock, A. D., & White, D. C. (2005). Microbial community PLFA and PHB 606
responses to ecosystem restoration in tallgrass prairie soils. Soil Biology and Biochemistry, 37, 607
1946-195. 608
McLean, L., Pray, T., Onstott, T., Brodie, E., Hazen, T., & Southam, G. (2007). Mineralogical, 609
chemical and biological characterization of an anaerobic biofilm collected from a borehole in a 610
deep gold mine in South Africa. Geomicrobiology Journal, 24, 491-504. 611
Morse, J., & Luther, I. G. (1999). Chemical influences on trace metal-sulfide interactions in 612
anoxic sediments. Geochimica et Cosmochimica Acta, 63, 3373-3378. 613
Muyzer, G., & Stams, A. J. (2008). The ecology and biotechnology of sulfate-reducing bacteria. 614
Natural Reviews Microbiology, 6, 441-454. 615
Nachtegaal, M., Marcus, M. A., Sonke, J. E., Vangronsveld, J., & Van Der Lelie, D. (2005). 616
Effects of in situ remediation on the speciation and bioavailability of zinc in a smelter-617
contaminated soil. Geochimica et Cosmochimica Acta, 69, 4649-4664. 618
Olsson, P. A. (1999). Signature fatty acids provide tools for determination of the distribution and 619
interactions of mycorrhizal fungi in soils. FEMS Microbiol Ecology, 29, 303-310. 620
Pierzynski, G. M., & Vaillant, G. C. (2006). Remediation to reduce ecological risk from trace 621
element contamination: A decision case study. Journal of Natural Resources and Life Sciences 622
Education, 35, 85-94. 623
Ramette, A. (2007). Multivariate analyses in microbial ecology. FEMS Microbiol Ecology, 62, 624
7 Scheinost, A. C., Kretzschmar, R., Pfister, S., & Roberts, D. R. (2002). Combining selective 626
sequential extractions, x-ray absorption spectroscopy, and principal component analysis for 627
quantitative zinc speciation in soil. Environmental Science and Technology, 36, 5021-5028. 628
Smith, G. A., Nickels, J. S., Kerger, B. D., Davis, J. D., & Collins, S. P. (1986). Quantitative 629
characterization of microbial biomass and community structure in subsurface material: a 630
prokaryotic consortium responsive to organic contamination. Canadian Journal of Microbiology, 631
32, 104-111. 632
Soil Survey Laboratory Staff, 1996. Soil survey laboratory manual. Soil Survey Investigation 633
Report no. 42. USDA-NRCS. U.S. Gov. Printing Office, Washington, D.C. 634
Stein, O. R., Borden-Stewart, D. J., Hook, P. B., & Jones, W. L. (2007). Seasonal influence on 635
sulfate reduction and zinc sequestration in subsurface treatment wetlands. Water Research, 41, 636
3440-3448. 637
Toevs, G. R., Morra, M. J., Polizzotto, M. L., Strawn, D. G., Bostick, B. C., & Fendorf, S. 638
(2006). Metal (loid) diagenesis in mine-impacted sediments of Lake Coeur d’Alene, Idaho. 639
Environmental Science and Technology, 40, 2537-2543. 640
Tokunaga, T. K., Wan, J., Firestone, M. K., Hazen, T. C., Olson, K. R., & Herman, D. J. (2003). 641
In situ reduction of chromium (VI) in heavily contaminated soils through organic carbon 642
amendment. Journal of Environmental Quality, 32, 1641-1649. 643
Trajanovska, M. L., & Britz, M. B. (1997). Detection of heavy metals ion resistance in Gram-644
positive and Gram-negative bacteria isolated from lead contaminated sites. Biodegradation, 8, 645
8 Tu, Q., Yu, H., He, Z., Deng, Y., Wu, L., & Nostrand, J. D. (2014). GeoChip 4: A functional 647
gene‐array‐based high‐throughput environmental technology for microbial community analysis. 648
Molecular Ecology Resources, 14, 914-928. 649
Van Nostrand, J. D., Wu, L., Wu, W. M., Huang, Z., Gentry, T. J., & Deng, Y. (2011). Dynamics 650
of microbial community composition and function during in situ bioremediation of a uranium-651
contaminated aquifer. Applied and Environmental Microbiology, 77, 3860-3869. 652
Van Nostrand, J. D., Wu, W., Wu, L., Deng, Y., Carley, J., & Carroll, S. (2009). GeoChip‐based 653
analysis of functional microbial communities during the reoxidation of a bioreduced uranium‐
654
contaminated aquifer. Environmental Microbiology, 11, 2611-2626. 655
Wan, J., Tokunaga, T. K., Brodie, E., Wang, Z., Zheng, Z., & Herman, D. (2005). Reoxidation of 656
bioreduced uranium under reducing conditions. Environmental Science and Technology, 39, 657
6162-6169. 658
White, C., & Gadd, G. (2000). Copper accumulation by sulfate‐reducing bacterial biofilms. 659
FEMS Microbiology Letters, 183, 313-318. 660
White, D. C., & Ringlberg, D. B. (1998). Signature lipid biomarker analysis. pp. 255-272, IN: R. 661
S. Bulage et al. (Eds.), Techniques in microbial ecology, Oxford University Press, New York. 662
Whiteman, M., Armstrong, J. S., Chu, S. H., Jia‐Ling, S., Wong, B., & Cheung, N. S. (2004). 663
The novel neuromodulator hydrogen sulfide: An endogenous peroxynitrite ‘scavenger’? Journal 664
of Neurochemistry, 90, 765-768. 665
Wu. L. (2001). Development and evaluation of functional gene arrays for detection of selected 666
9 Yergeau, E., Kang, S., He, Z., Zhou, J., & Kowalchuk, G.A. (2007). Functional microarray 668
analysis of nitrogen and carbon cycling genes across an Antarctic latitudinal transect. 669
International Society of Microbial Ecology Journal, 1, 163-179. 670
Zarcinas, B. A., McLaughlin, M. J., & Smart, M. K. (1996). The effect of acid digestion 671
technique on the performance of nebulization systems used in inductively coupled plasma 672
spectrometry. Communications in Soil Science and Plant Analysis, 27, 1331-1354. 673
Zhang, S., Xue, X., Liu, R., & Jin, Z. (2005). Current situation and prospect of the 674
comprehensive utilization of mining tailings. Journal of Mining and Metallurgy, 3, 44-48. 675
Zhou, J., Kang, S., Schadt, C., & Garten, Jr. C. (2008). Spatial scaling of functional Gene 676
diversity across various microbial taxa. Proceedings of the National Academy of Sciences of the 677
United States of America, 105, 7768-7773. 678
List of Tables
679Table 1. Chemical data for the effluent samples collected after medium- (119-day) and long- 680
(252-day) term submergence. The soil samples collected at these time points were used for 681
microarray analysis. 682
10 684
685
(µg/L) (mg/L)
Sample Zn Cd Pb pH DOC Sulfate-S Nitrate-N
C0S0 119-day 723±40.9 432±10.9 <DL 7.57±0.02 5±0.03 474±10.25 2.0±0.1 C0S0 252-day 517±30.9 28±0.9 <DL 8.41±0.03 62±2.6 571±5.64 2.0±0.2 C0S1 119-day 30±1.7 2±0.01 <DL 8.00±0.02 4±0.1 468±6.78 1.8±0.5
C0S1 252-day <DL 1±0.006 36±1.6 6.39±0.005 65±0.8 ¶ 2.2±0.02
C1S0 119-day <DL 1±0.001 <DL 8.18±0.012 5±0.02 503±7.34 1.9±0.01 C1S0 252-day <DL <DL <DL 7.58±0.015 <DL 474±3.95 2.0±0.05 C1S1 119-day <DL 1±0.004 <DL 7.40±0.01 4±0.1 437±10.02 1.8±0.04 C1S1 252-day <DL <DL <DL 7.02±0.01 <DL 288±8.64 1.9±0.14 ⃰⃰DL corresponds to detection limit. Detection limit of 0.6 for Cd, and 0.7 µgL-1 for Pb was determined.
11
List of Figures:
686
687
Figure 1: X-ray absorption fine structure spectroscopy results showing % components for a) 688
Lead, b) zinc and c) cadmium in starting mine waste material, control (C0S0) and OC-plus-S-689
treated sample (C1S1) under long-term (252-day) submergence. The phase identified as less than 690
12 692
Figure 2: Functional Gene richness under medium- (119-day), and long-term (252-day) 693
submergence. All the treatments; C0S0, C0S1, C1S0, and C1S1 (solid filled bars) from medium-694
term submergence, and only C0S0, and C1S1 (pattern filled bars) from long-term submergence 695
are plotted. Vertical bars represent the mean of three replicates; 2 replicates from individual 696
column, and 1 replicate from the mixture of two columns. Bars with the same letters are not 697
significantly different. Different letters within a category indicate significance difference 698
13 700
Figure 3: Detrended correspondence analysis (DCA) for the total number of detected genes 701
under medium- (119-day) and long-term (252-day) submergence, indicating community structure 702
changes. All the treatments; C0S0, C0S1, C1S0, and C1S1 (solid filled markers) from medium-703
term submergence, and only C0S0, and C1S1 (pattern filled markers) from long-term 704
14 706
Figure 4: Total abundance of function genes in selected categories for the samples submerged 707
for both medium- (119-day) and long-term (252-day) submergence. All the treatments; C0S0, 708
C0S1, C1S0, and C1S1 (solid filled bars) from medium-term submergence, and only C0S0, and 709
C1S1 (pattern filled bars) from long-term submergence are plotted. Vertical bars represent the 710
mean of three replicates; 2 replicates from individual column, and 1 replicate from the mixture of 711
two columns. Bars with the same letter are not significantly different. Different letters within a 712
16
Figure 5: Total abundance of a) dsrA/dsrB, and csyJ in the sulfur category, b) pulA, 715
Phenol_oxidase, Endochitinase under the C-cycling category, and c) Cd resistance gene (CadA), 716
Zn resistance gene (czcA), and Pb resistance gene (pbrA). Vertical bars represent the mean of 717
three replicates. All the treatments; C0S0, C0S1, C1S0, and C1S1 (solid filled bars) from 718
medium-term submergence, and only C0S0, and C1S1 (pattern filled bars) from long-term 719
submergence are plotted. Vertical bars represent the mean of three replicates; 2 replicates from 720
individual column, and 1 replicate from the mixture of two columns. Bars with the same letter 721
are not significantly different. Different letters within a category indicate significance difference 722
(α=0.05). 723
724
Figure 6: Canonical correspondence analysis (CCA) indicating the relationship between 725