A Parallel Self-Organizing Overlapping Community
Detection Algorithm Based on Swarm Intelligence for
Large Scale Complex Networks
Hanlin Suna,b, Wei Jiec, Jonathan Looc, Lizhe Wangd,∗, Sugang Maa,b, Gang Hane, Zhongmin Wanga,b, Wei Xinga,b
aSchool of Computer Science and Technology, Xi’an University of Posts and
Telecommunications, China
bShaanxi Key Laboratory of Network Data Analysis and Intelligent Processing, Xi’an
University of Posts and Telecommunications,China
cSchool of Computing and Engineering, University of West London, UK
dInstitute of Remote Sensing and Digital Earth, Chinese Academy of Sciences, China
eDepartment of Electronic Science and Technology, Northwestern Polytechnical
University, China
Abstract
Community detection is a critical task for complex network analysis. It helps us to understand the properties of the system that a complex network rep-resents and has significance to a wide range of applications. Though a large number of algorithms have been developed, the detection of overlapping com-munities from large scale and (or) dynamic networks still remains challenging. In this paper, a Parallel Self-organizing Overlapping Community Detection (PSOCD) algorithm ground on the idea of swarm intelligence is proposed. The PSOCD is designed based on the concept of swarm intelligence system where an analyzed network is treated as a decentralized, self-organized, and self-evolving systems, in which each vertex acts iteratively to join to or leave from communities based on a set of predefined simple vertex action rules. The algorithm is implemented on a distributed graph processing platform named Giraph++; therefore it is capable of analyzing large scale networks.
∗Corresponding author
Email addresses: [email protected](Hanlin Sun),[email protected](Wei
Jie), [email protected](Jonathan Loo), [email protected](Lizhe Wang ),
[email protected](Sugang Ma),[email protected](Gang Han),
The algorithm is also able to handle overlapping community detection well because a vertex can naturally joins to multiple communities simultaneously. Moreover, if some vertexes and edges are added to or deleted from the an-alyzed network, the algorithm only needs to adjust community assignments of affected vertexes in the same way as its finding joining communities for a vertex, i.e., it inherently supports dynamic network analysis. The proposed PSOCD is evaluated using a number of variety large scale synthesized and real world networks. Experimental results indicate that the proposed algo-rithm can effectively discover overlapping communities on large-scale network and the quality of its detected overlapping community structures is superior to two state-of-the-art algorithms, namely Speaker Listener Label Propa-gation Algorithm (SLPA) and Order Statistics Local Optimization Method (OSLOM), especially on high overlapping density networks and (or) high overlapping diversity networks.
Keywords: overlapping community detection, community structure analysis, complex network analysis, swarm intelligence, parallel network analysis
1. Introduction
An exact definition of a community depends on the underlying problem and its application, thus there is no a unanimous definition. For example, the definition could be based on degrees of vertexes [1], k-cliques[2], k-clans[2], k-clubs [2], etc. Filippo et. al. [1] gave out the definition of strong sense com-munity and weak sense comcom-munity according to member connection strength. Michele et. al. [3] proposed a number of meta definitions. Intuitively, a com-munity is a group of vertexes in a network that has more edges (connections) among its members but comparatively has less edges between its members and the rest of the network vertexes. This simple concept is the core of nearly all community definitions.
The properties of very complex networks induce three staple challenges for a community detection algorithm: (1) overlapping community structure detection, especially from a high overlapping density network of which a large percent of vertexes are overlapping vertexes, and (or) from a high overlapping diversity network of which an overlapping vertex belongs to a great number of communities; (2) large scale network analysis, e.g., the number of vertexes and edges could reach the scale of several millions and even more; and (3) dynamic changing of the analyzed networks topology, i.e., a number of ver-texes and edges could appear or disappear frequently. The problem about large scale and dynamic networks is how to find community structures within them quickly with as less effort as possible. Designing efficient algorithms to meet these problems remains challenging.
In this paper, we develop the Parallel Self-Organizing Community De-tection (PSOCD) algorithm based on the idea of swarm intelligence (SI) to further near to a final solution. Swarm intelligence is the collective behavior of decentralized and self-organized systems, either natural or artificial. An SI system generally consists of a large number of simple individuals who can only perform simple actions and interact with nearby neighbors as well as with the system existing environment. Intelligence will emerge as a consequence of the sum of these simple actions and interactions. The main innovations and contributions of this paper are:
algorithm inherently supports dynamic network analysis very well; in that, if new vertexes and edges are added to the analyzed network, or existing vertexes and edges are deleted, it only needs to adjust community associa-tions of affected vertexes in the same way as finding their previous joining communities.
(2) We implemented the PSOCD in a distributed manner on the par-allel graph processing platform Giraph++[4], leveraging the properties of SI, namely distributed, self-organizing, and self-evolving. As a result, it is capable of handling large scale network analysis.
(3) We found that the extended modularity or modularity density [5] for evaluating overlapping community structure quality should not be used as a metric for performance comparison of different algorithms. The reason is that the incorporation of overlapping properties in the metrics has great impact on its values, thus may lead to a quite opposite conclusion.
(4) We applied the PSOCD to analyze structural communities of three large scale real world networks and got reasonable results, which are closer to the functional communities reported in previous studies than those discovered by the two compared state-of-art algorithms.
The remainder of this paper is structured as follows: In section 2, some most related overlapping community detection algorithms are briefly re-viewed. In section 3, the design of the PSOCD algorithm is outlined. A current implementation of the proposed algorithm on the platform Giraph++ and its computational complexity are described in section 4. In section 5, the evaluation results of the algorithm for a number of synthesized and real large complex networks are presented, and the limits of the current implementation are discussed. Finally, section 6 concludes the paper.
2. Related works
definitions of a community in complex network were given and majority com-munity discovery methods were summed up based on their own definitions [3]. Overlapping community structure analysis algorithms were reviewed in [7] and [8], while those for social network analysis were reviewed in [9]. The performance of a number of algorithms were compared in [8] and [10]. In this section, we briefly review some algorithms most related to our work.
2.1. LPA
The label propagation algorithm (LPA) is currently the fastest algorithm for community structure analysis, with a near-linear computational com-plexity. The idea is that, as information propagates on a network with a community structure, it will have a high probability flowing within a com-munity. At first, each vertex is assigned a label, indicating the community to which it belongs, then each vertex sends its label to its neighbors and selects a label received from neighbors, e.g., the label observed most frequently, as its new label. By iteratively propagating labels among neighboring vertexes, the community structure will gradually emerge. Assuming that a vertex is able to hold more than one label, LPA can be extended for overlapping community detection. There are a number of improved algorithms based on the LPA approach for overlapping community detection, such as CO-PRA(Community Overlap PRopagation Algorithm)[11], MLPA(Multi-Label Propagation Algorithm)[12], BMLPA(Balanced MLPA)[13], SLPA(Speaker-Listener LPA)[14], LPAcw(LPA with consensus weight)[15], DLPA(Dominant LPA)[16], etc. They are differentiated by the way of label propagating strate-gies and new label selections.
We take the SLPA as a comparison algorithm, which is said having good performance as detecting overlapping communities[8]. The algorithm mim-ics human communication behavior as propagating labels, i.e. preferring to spread most frequently discussed opinions. Specifically, each vertex has a memory and spreads randomly one of its current labels to its neighbors with a probability proportional to the occurrence frequency of the label in memory, and takes the most popular label observed as a new label. Those labels with probabilities exceeding a given threshold are kept by a vertex and transformed to communities finally.
2.2. Game Theory
The algorithms based on game theory try to simulate a procedure through which the community structure of a network evolved to the current state. In such an algorithm, a vertex is viewed as a rational or selfish individual, and decides its own community associations according to a defined utility func-tion, that consists of two parts, a gain function and a loss function. While a Nash equilibrium is reached, at which state no individual can increase its utility by changing its strategy (community associations) unilaterally, a com-munity structure could be deduced. If an individual is allowed to join into multiple communities, the algorithm could be used for overlapping commu-nity detection. A Nash equilibrium is guaranteed to exist if the gain and loss functions are locally linear. However, finding a Nash equilibrium under such restricts is NP-hard. In practice, a local equilibrium is used instead, in which each individual plays its local optimal strategy. The algorithms in [19] and [20], PSGMAE(Pearson correlation GAME) [21], NGGAME(Neighborhood similarity GAME)[21], and SID(Social Information Diffusion) [22] are just some examples based on game theory. Their differences lie within the design of the utility functions they employ. Specifically, the COFOGA in [23] defines a utility function for a coalition (community) and uses the game theory as an approach for coalition merging, i.e. an individual in the formation game is a coalition. Since a utility function should be local linear to assure the game being potential, the community properties contained in the utility function should be able to be expressed as local linear functions.
2.3. Swarm Intelligence
Extensively, the LPA algorithms and those based on game theory are sim-ilar as the one ground on swarm intelligence as we have described previously, in the way that each vertex decides its community associations by itself, but the ideas behind are different: the LPA relays on the fact that a label is prop-agating within a community with high probability; the game theory aims to find a Nash equilibrium state by each selfish agent selecting proper strategies iteratively; while the swarm intelligence assumes an emergence of optimal re-sult from collective simple actions of a large number individuals. Therefore, the final best community structures found may have different qualities.
GA-NET+[24] is GA based and used for overlapping community detection by working on a link network translated from a normal vertex network, in which a vertex and an edge represent an edge and a vertex of the original network, respectively. Due to the limitation of the representation method for evolutionary individuals, however,the GA based algorithm can not be used for large scale network analysis. In [25], the AntCBO algorithm was proposed for overlapping community detection. Intrinsically, this algorithm is a type of LPA but the label propagation among neighboring vertexes is achieved by ’ants’ in the ACO algorithm framework.
In [26] the authors proposed an overlapping community detection algo-rithm named COGS (Community Optimization Graph Swarm), that is ex-plicitly said using swarm intelligence. In COGS, an analyzed network is treated as a swarm intelligence system and a vertex interacts with its neigh-bors to find the so called Friendship-Group (a type of partial community). Then the algorithm finds Friendship-Groups that should be merged based on the LPA idea through propagating community labels among such groups. Our algorithm is different from COGS in that the COGS uses SI to find Friend-Groups, only a partial step in community detection, while the PSOCD uses SI as a framework to imitate a procedure through which the commu-nity structure of a network evolves to its current state. The authors also implemented a multi-thread parallel version COGS[27].
2.4. Local Expansion
The OSLOM is another comparison algorithm we used in this paper, that is reported having good performance for overlapping community detection as well[8]. It should be also mentioned that the OSLOM is capable of detecting communities in networks accounting for edge directions, edge weights, over-lapping communities, hierarchies and community dynamics. The algorithm uses a fitness function that expresses the statistical significance of a clus-ter (community) with respect to random fluctuations to evaluate the clusclus-ter quality. The statistical significance of a cluster is defined as the probability of finding the cluster in a random null model, i.e. in a class of networks without community structure. To reduce the impact of stochasticity of ini-tial seed selections, the algorithm is usually repeated several times to obtain several community structures, and then the final best outputs are selected from all detected clusters. One major drawback of OSLOM is its heavy computational cost as calculating significance for each cluster.
To the best of our knowledge, the problem of overlapping community structure analysis remains a challenge, though there are a large number of algorithms have been proposed. We should continue to further explore and develop algorithms that can handle large scale and dynamic networks and be able to detect overlapping community structure accurately and effectively.
3. The proposed PSOCD algorithm
!"#$%&
'()* !"#$%&+, '()* !"#$%&+,
'()* !"#$%&+- '()*
!"#$%&+-'()* !"#$%&+. '()* !"#$%&+.
/0%"1"1$ 1 2 1 1"103141 2 !5$351 2
6$77( 1"1!'
#
$
%&+
$
8
!
+,
9 9
7!''02! /0''1 2 6$33!6"1 2
'()* !"#$%&+,
'()*
!"#$%&+-'()* !"#$%&+.
9
80"0+:3$#
#
$
%&+
$
8
!
+-#
$
%&+
$
8
!
+.
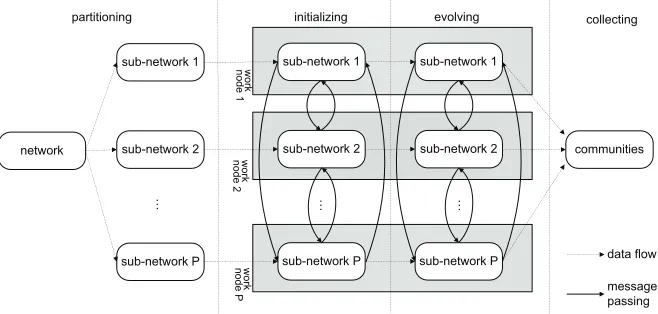
Figure 1: The conception structure of PSOCD.
3.1. Partitioning Phase
The first phase of analyzing a large scale network is to divide it into a number of smaller sub-networks with approximately the same size. More-over, the connections among the identified different sub-networks should be minimal. The target of equally sized sub-networks roughly equalizes the pro-cessing time for each sub-network. Minimal connections among the identi-fied sub-networks is aimed for because the connections between sub-networks have a significant influence on the performance of the subsequent evolving phase. For example, during its evolution, a vertex should notify its neighbors changes of its communities. It is easy to notify local neighbors located in the same sub-network, but if a neighbor is hosted by another sub-network, the vertex must send community- change messages across a communication net-work. Therefore, a vertex is preferred to be assigned to a sub-network with as less connections with other sub-networks (i.e., less external neighbors) as possible. Currently, the ’Metis’ algorithm[35] is used as the partition method, which could produce a partition structure with minimum edges across parti-tions.
3.2. Initializing Phase
1:
2: ALGORITHM 1: InitializeCommunities(sub-network)
3:
4: for(each vertex v in the sub-network)do
5: if (v has been initialized) then
6: continue
7: end if
8: if (v and its two uninitialized neighbors n1 andn2 form a 3-clique)then 9: create a new community nccontaining v,n2 andn2;
10: else
11: create a singleton new community nccontaining v;
12: end if
13: savencin the local community structurelcsand associate it with its mem-bers;
14: tag members ofncas being initialized;
15: end for
16:
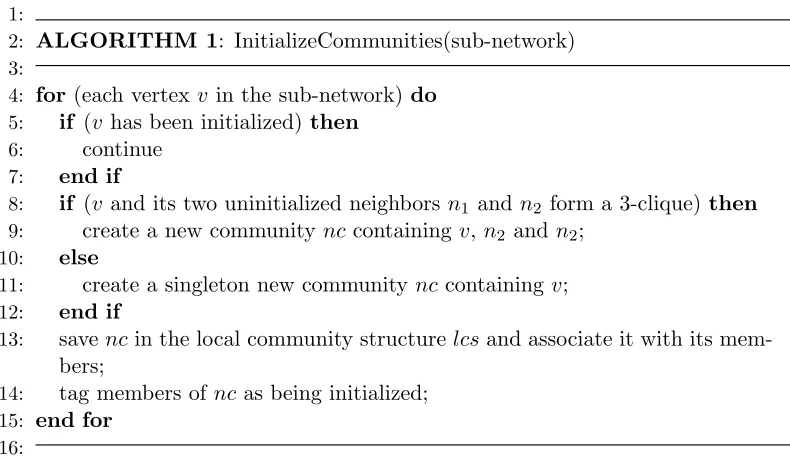
Figure 2: Finding an initial community for each vertex within a sub-network.
of the k-clique. In other words, a maximum k-clique represents the strongest sense of community. The PSOCD takes a smallest k-clique, 3-clique, as the initial core community for the three member vertexes. For simplicity, the algorithm finds a 3-clique for an uninitialized vertex of a sub-network with its two uninitialized local neighbors as their initial community. If such a 3-clique does not exist for a vertex, then the vertex forms a community with only itself as a member, i.e. a singleton community. The initializing algo-rithm for a sub-network is shown in Fig. 2. Please keep in mind that the algorithm is executed in parallel by different worker nodes that are respon-sible for processing different sub-networks. We will explain in section 4.1 how communities are saved in our implementation to reduce communication cost thus get performance gain. Here, we simply consider that each ver-tex keeps its own state, namely its neighbors, neighbors’ neighbors, joining communities, neighbors’ joining communities, and so on.
1:
2: ALGORITHM 2: NotifyVertexNeighbors(sub-network)
3:
4: for(each vertex v in the sub-network)do
5: for(each neighbor ngof v) do
6: send nga message containingv’s neighbors;
7: end for
8: end for
9:
Figure 3: Notifying neighbors of a vertex its all neighbors.
1:
2: ALGORITHM 3: NotifyNewCommunities(sub-network)
3:
4: for(each community cinlcs of the sub-network)do
5: for(each newly joining vertex jvof c) do
6: for (each neighborng ofjv)do
7: if (ng is not a member of c) then
8: send nga message containing communityc;
9: end if
10: end for
11: end for
12: end for
13:
Figure 4: Notifying neighbors of newly joining members the community.
neighbor notification messages (and other messages) will be handled by the receiving vertexes.
3.3. Evolving Phase
The evolving phase plays a key role in finding an optimal community structure for a network. The main question in evolving phase is whether a vertex should join to a community, i.e., under which condition a vertex will join to a community? To address this, we define a new type of connection strength of a vertex with a community, the connection score.
3.3.1. Connection Score
Tanmoy et. al. [36] claimed that the connection strength of a vertex with a community is determined by two factors: 1) the number of connections between the vertex and each other community, but not the total number of connections between the vertex and all other communities, and 2) the strength with which this vertex connects to the candidate community, but not only the number of connections between the vertex and the candidate community. The strength is measured as the clustering coefficient of the vertex’s neighbors belonging to the candidate community. The larger the co-efficient, the stronger the strength, and vice versa. Tanmoy et. al. proposed a connection strength, the vertex permanence, defining as follows:
P erm(v) =
I(v) Emax(v)
× 1
D(v)
−[1−cin(v)] (1)
where I(v) is the connection number between vertexv and a candidate join-ing community, Emax(v) is the maximum number of connections between v
and candidate communities, D(v) indicates the degree of vertexv, andcin(v)
represents the clustering coefficient of v’s neighbors belonging to the candi-date community. The first term in eq. 1 considers the first factor described previously, while the second term takes into account the second. The range of the permanence of a vertex is between [−1,1]. The authors advocated that the averaged permanence of all community members could be used as an index for the quality of the community.
the connection score (CS), following the two mentioned factors:
CS(v) =
I(v) D(v)
(1−cin(v))
(2)
where I(v), D(v) and cin(v) are the same as in eq. 1. The D(v) could be
replaced with Emax(v) as well. In CS, a connection strength is first
mea-sured by the connection number, and then magnified by the corresponding clustering coefficient. Therefore, the CS may get a subtle distinction be-tween connection strengths. The range of CS lies within [0,1] representing absolutely not belonging to (0) and definitely belonging to (1) a community, respectively. It is easy to extend CS to weighted networks, by replacing the degree with sum of corresponding edge weights and defining the clustering coefficient in a way taking edge weights into consideration.
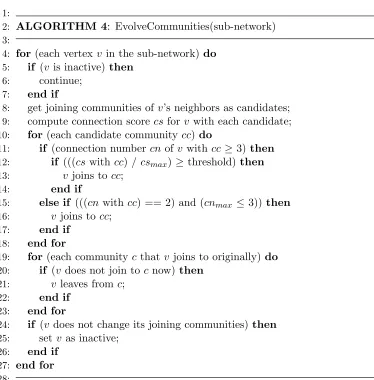
3.3.2. Vertex Community Evolving
vertex will not join to a candidate community. The vertex community evolv-ing algorithm is described as in Fig. 5. A vertex who does not change its joining communities is considered as ’inactive’, and does not need to execute the evolving algorithm. An inactive vertex becomes active again if it receives any message from another vertex.
The evolving algorithm is executed iteratively for each sub-network, and optimal communities will emerge gradually. Theoretically, the evolving will terminate if there is no vertex left that is changing its communities. However, such a graceful termination may not be achieved due to a few vertexes who, in a cyclic way, repeat the same actions within several sequential evolving generations, i.e. leaving from a community and later joining to it again, be-cause of mutual influence of actions of different vertexes. We set a maximum evolving generations to ensure it will terminate eventually.
At the end, in collecting phase, the whole community structure of the analyzed network could be collected from these evolved sub-networks.
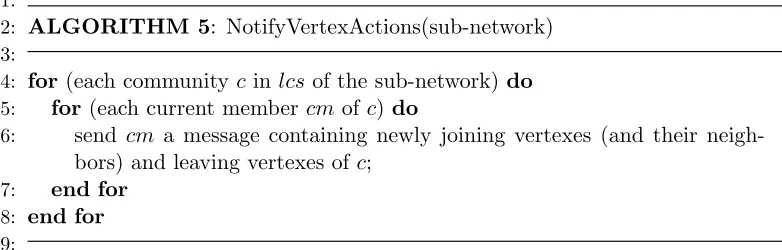
3.3.3. Keeping Consistence
To keep community state being consistent, the changes of a community, i.e. some vertexes joining and some leaving, should be notified to its replicas, if applicable during evolution. Given that the PSOCD runs in a distributed manner, one way of notifying these changes could be sending associate mes-sages after all vertexes of a sub-network finishing their eovlutions. One com-munity change notification algorithm is shown in Fig. 6. Notifying neighbors of newly joining vertexes is for computing clustering coefficient in connection score calculation.
3.3.4. Community Merging
1:
2: ALGORITHM 4: EvolveCommunities(sub-network)
3:
4: for(each vertex v in the sub-network)do
5: if (v is inactive) then
6: continue;
7: end if
8: get joining communities ofv’s neighbors as candidates; 9: compute connection scorecsforv with each candidate; 10: for(each candidate community cc) do
11: if (connection number cn ofv withcc ≥3)then
12: if (((cswith cc) /csmax) ≥threshold)then
13: v joins to cc;
14: end if
15: else if (((cnwith cc) == 2) and (cnmax ≤3))then
16: v joins to cc;
17: end if
18: end for
19: for(each communityc thatv joins to originally) do
20: if (v does not join toc now)then
21: v leaves fromc;
22: end if
23: end for
24: if (v does not change its joining communities) then
25: set v as inactive;
26: end if
27: end for
28:
1:
2: ALGORITHM 5: NotifyVertexActions(sub-network)
3:
4: for(each community cinlcs of the sub-network)do
5: for(each current member cm ofc)do
6: send cm a message containing newly joining vertexes (and their neigh-bors) and leaving vertexes of c;
7: end for
8: end for
9:
Figure 6: Notifying vertex actions.
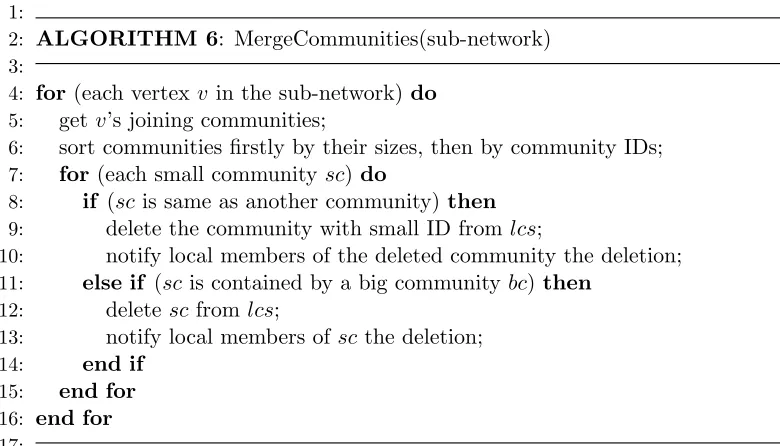
While deleting a community, the deletion could be notified to members of the community to make the deleting only occur once and thus get per-formance gain. By notifying other members after the first deleting on one member, no more deletion is needed any more. To reduce notification cost, if a merging occurs, only local members of the community need to be no-tified, but external members located in other sub-networks need not. It is because that if a deleted community exists in a sub-network, the containing community must exist too. Therefore, the same merging will occur there as well. However, there is a special case needed to be carefully dealt with to make sure the same merging occur in different sub-networks. The case is the situation that the contained and containing communities contain completely same members but with different IDs. It should be guaranteed that in such a situation the deleted community must be the same one. The PSOCD fulfills this requirement by always deleting the community with a small ID. The merging algorithm is shown in Fig. 7.
3.4. Post Process
1:
2: ALGORITHM 6: MergeCommunities(sub-network)
3:
4: for(each vertex v in the sub-network)do
5: getv’s joining communities;
6: sort communities firstly by their sizes, then by community IDs; 7: for(each small communitysc) do
8: if (scis same as another community)then
9: delete the community with small ID fromlcs;
10: notify local members of the deleted community the deletion;
11: else if (scis contained by a big community bc)then
12: deletescfrom lcs;
13: notify local members of scthe deletion;
14: end if
15: end for
16: end for
17:
Figure 7: Merging communities from a vertex viewpoint.
connection number is greater than or equal to 4; and 4) the connection number is greater than or equal to 3, while the connection score could be computed, but the ratio of the connection score to the maximum score is less than a given threshold, which is set the same as the joining threshold during PSOCD evolving. These leaving criteria are approximate the opposites of these joining rules in vertex community evolving algorithm (algorithm 4).
4. Implementation of PSOCD
1:
2: ALGORITHM 7: PostProcess(community structure)
3:
4: repeat
5: for(each vertex v in network) do
6: compute connection number cn and connection score cs of v to each joining community;
7: for (each communityc v joins to)do
8: if (c is singleton)then
9: continue;
10: end if
11: if (cn == 0) then
12: v leaves from c;
13: else if (cn== 1 andcnmax ≥ 2)then
14: v leaves from c;
15: else if (cn== 2 andcnmax ≥ 4)then
16: v leaves from c;
17: else if (cn≥3 andcs /csmax < threshold)then
18: v leaves from c;
19: end if
20: end for
21: if (v joins to none community)then
22: v forms a singleton community;
23: end if
24: end for
25: until (no vertex leaves from a community)
26:
sub-networks. The system will guarantee to deliver these messages to their correct destination vertexes at the end of the current super-step, i.e., after all vertexes finishing their computation of the current super-step. Tian et. al. [4] improved the Giraph and proposed the Giraph++ which provides a ’think like a graph’ programming model. In Giraph++, the sub-network structure is opened up to all local vertexes and thus vertex communica-tion within a sub-network can bypass the heavy message passing or system scheduling support and messages can be sent to local destination vertexes di-rectly. Therefore, the communication mechanism of Giraph++ can be viewed as semi-asynchronous, within local sub-network asynchronous and between subnetworks synchronous. This optimized local asynchronous communica-tion will make the swarm intelligence system evolucommunica-tion be more efficient. We implemented our PSOCD on the Giraph++ platform.
4.1. Considerations
then the representative vertex is capable of being responsible for updating its local community replica. Therefore, such a message needs to be sent for the times of at most the number of sub-networks. In addition, when a vertex notifies an external neighbor of its joining communities, it only sends the IDs of these communities, which is much smaller in size than the sending of whole structures of these communities. The implementations of aforemen-tioned notification algorithms could be improved by using the advantages of the community storage approach.
As the evolving phase progresses, some communities may no longer be referenced by any vertex. To remove these unnecessarily saved communities from the local community structure of a sub-network, at the beginning of each evolving round, the algorithm should examine all communities and delete those null referenced ones.
4.2. Alogrithm Framework
The framework of PSOCD on Giraph++ is shown in Fig. 9. The func-tions starting with ’Process’ deal with messages received from last super-step for vertexes in a sub-network and thus update states of local communities and vertexes. The ’Notify’ functions here are improved ones by taking into considerations of local shared community storage approach. The first two super-steps, step 0 and 1, achieve the initializing phase. Note that the two functions in super-step 1, ’NotifyNewCommunities’ and ’NotifyVertexCom-munities’ (described in Fig. 11), spread information of the initialized commu-nities across subnetworks and prepare for subsequent community evolving. The remained super-steps compute the community evolution. In the even super-steps, the algorithm processes received notification messages and up-dates states of local communities and vertexes and then evolves communities of each local vertex. At the end it sends messages of community evolution (vertex actions) to related subnetworks aiming to keep changed communities be in consistent. Similarly, in the odd super-steps, the algorithm first handles notification messages of community evolution and renew local communities, and then merges contained communities if possible. Finally, it diffuses cur-rent states of local vertex joining communities and prepares for the next round evolving. The corresponding flow diagram is shown in Fig. 10.
4.3. Computational Complexity Analysis
1:
2: ALGORITHM 8: Compute(sub-network)
3:
4: if (super-step == 0)then
5: //initializing.
6: NotifyVertexNeighbors(sub-network);
7: else if (super-step == 1)then
8: //initializing.
9: ProcessNeighborMessages(sub-network); 10: InitializeCommunities(sub-network); 11: NotifyNewCommunities(sub-network); 12: NotifyVertexCommunities(sub-network);
13: else if ((super-step % 2) == 0)and (super-step≤MAXSTEP)) then
14: //evolving, even step.
15: ProcessNewCommunityMessages(sub-network); 16: ProcessVertexCommunityMessages(sub-network); 17: EvolveCommunities(sub-network);
18: NotifyVertexActions(sub-network);
19: else if ((super-step % 2) == 1)and (super-step≤MAXSTEP)) then
20: //evolving, odd step.
21: ProcessActionMessages(sub-network); 22: MergeCommunities(sub-network); 23: NotifyNewCommunities(sub-network); 24: NotifyVertexCommunities(sub-network); 25: else
26: ProcessActionMessages(sub-network); 27: set all local vertexes to be halt;
28: end if
29:
!""!#
$! %&'( )'& * $!*+,!
!""!- !./!'0'1!
22! !3"!*
!./!455! 22! !3"!*
! " #$ % !&'()#*+ +,-$, !&'()#*+
6 6 6 6
7 7 7 7
74).89!1'.:;<4(/!+==! 1'.:;<4(/!48!+!0'()',>
?(4@'//!A'//+:'/! 8(4A!=+/)! !+15!%&5+)'! =4@+=!/)+)'/>
B1.).+=.C'!=4@+=!/%<D 1')E4(F!@4AA%1.).'/>
&('+5!=4@+=!@4AAD %1.)9!.184(A+).41!)4! 4);'(!/%<D1')E4(F/!.8! 1'@'//+(9>
?(4@'//!A'//+:'/! 8(4A!=+/)! !+15!%&5+)'! =4@+=!/)+)'/>
G04=0'!=4@+=! @4AA%1.).'/>
74).89!=4@+=!0'()',! +@).41/>
?(4@'//!A'//+:'/! 8(4A!=+/)! !+15!%&5+)'! =4@+=!/)+)'/>
*'(:'!=4@+=!@4AAD %1.).'/!.8!&4//.<='>
&('+5!=4@+=!@4AAD %1.)9!.184(A+).41!)4! 4);'(!/%<D1')E4(F/!.8! 1'@'//+(9>
?(4@'//!A'//+:'/! 8(4A!=+/)! !+15! %&5+)'!=4@+=!/)+)'/>
')!+==!=4@+=!0'()','/! )4!<'!;+=)>
.-/(0"+1*023!+"4-567
!"!#
!"!
!H!-Figure 10: The flow diagram of PSOCD on Giraph++.
execution on one sub-network and analyze the computational complexity of the two major operations of PSOCD, i.e., the initializing phase and evolving phase. The used labels are listed in Table 1. We assume that all vertexes are divided into approximately equal sized sub-networks and that network communication time is not taken into consideration.
The initializing phase consists of two super-steps. In the first (super-step 0), each vertex notifies its neighbors all its neighbors. In the second (super-step 1), a sub-network processes firstly the received neighbor notifi-cation messages and then finds a 3-clique initial community for each local vertex. Finally, it spreads initialized local communities to other sub-networks if necessary. The computational complexity of notifying neighbor informa-tion is O( ¯NV ·N¯N), while that of processing neighbor notification messages
is O( ¯NV ·N¯EN). Local neighbor notifications can be done at the same time
1:
2: ALGORITHM 9: NotifyVertexCommunities(sub-network)
3:
4: for(each vertex v in the sub-network)do
5: for(each neighbor ngof v) do
6: if (ngis a local vertex) then
7: notifyng v’s joining community IDs directly;
8: else
9: sendng a message containingv’s joining community IDs;
10: end if
11: end for
12: end for
13:
Figure 11: Notifying joining communities of vertexes.
in other sub-networks, then it should be spread to these external neighbors. In consideration of the storage approach of communities in a sub-network, the community spreading could be achieved by the two functions shown in algorithm 8 (Fig. 9), NotifyNewCommunities and NotifyVertexCommunities (algorithm 9, in Fig. 11). The former sends a local community, if necessary, to the selected representative vertexes located in other sub-networks, and the later sends the joining community IDs of each local vertex to all its neigh-bors. The worst computational complexity of the community notification is O( ¯NC ·(NP −1)), and the computational complexity of vertex
commu-nity ID notification is the same as its neighbor notification, O( ¯NV ·N¯N).
As a result, the worst computational complexity of the initializing phase is O(2 ¯NV ·N¯N + ¯NV ·N¯EN + ¯NV ·N¯LN2 + ¯NC ·(NP −1)). Usually, the ¯NN,
¯
NLN and ¯NEN are much smaller comparing with ¯NV, and NP is smaller than
¯
NC. In addition, within a sub-network having good community structure,
finding a 3-clique with two local neighbors for most vertexes does not need NvLN(NvLN−1)/2 times searches, especially for vertexes with a large number
local vertex. Finally, the sub-network sends updates of each local community (vertex joining and leaving) to selected representative vertexes located in other sub-networks if a replica of the community exists there for the purpose of keeping them being consistent. The worst computational complexity of processing new community messages isO( ¯NC·(NP−1)), while the complexity
of processing vertex community ID messages is O( ¯NV ·N¯EN). The worst
complexity of vertex community evolving is O( ¯NV ·N¯N ·N¯V C) because the
algorithm checks all candidate communities for each vertex if it joins, and that of the vertex action notification is O( ¯NC ·(NP −1)) as messages are
only sent to selected representative vertexes.
In the second step (odd super-step), a sub-network processes firstly re-ceived vertex action notification messages and updates states of local com-munities, and then merges communities from a vertex viewpoint if possible. Finally, it prepares for the next round evolving by sending new community notification and vertex joining community ID notification messages, as in the end of initializing phase. The worst computational complexity of processing vertex action messages is O( ¯NC ·(NP −1)), the same as their sending, and
that of the merging is O( ¯NV ·N¯V C2 ) for checking each community if it is
contained in another one.
Therefore, the worst computational complexity of one evolving iteration is O( ¯NV·(NP−1)+ ¯NV·N¯EN+ ¯NV·N¯N·N¯V C+3 ¯NC·(NP−1)+ ¯NV·N¯V C2 + ¯NV·N¯N).
It could be simplied as O(K3 ·N¯V +K4 ·N¯C) where K3 and K4 are two constants due to the similar reasons explained in initializing phase analysis. It should also be noted that the ¯NC gradually becomes small as evolving
forwarding.
When the overall cluster is considered, the complexity of the initializing or one evolving iteration depends on the worst one of the sub-networks processed by a number of worker machines, plus the worst network communication cost. Generally, it is a sensible assumption that the network bandwidth is sufficient and thus network communication will not be the bottleneck of the algorithm’s execution.
5. Performance Evaluation
Table 1: Used labels in computational complexity analysis Variable Description
NP sub-network number
¯
NV average number of vertexes in a sub-network
¯
NC average number of local communities in a sub-network
¯
NN average number of neighbors of a vertex
¯
NLN average number of local neighbors of a vertex
NvLN the number of local neighbors of vertex v
¯
NEN average number of external neighbors of a vertex
¯
NV C average number of joined communities of a vertex
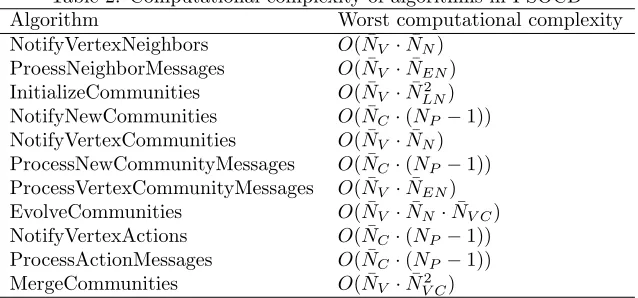
Table 2: Computational complexity of algorithms in PSOCD
Algorithm Worst computational complexity
NotifyVertexNeighbors O( ¯NV ·N¯N)
ProessNeighborMessages O( ¯NV ·N¯EN)
InitializeCommunities O( ¯NV ·N¯LN2 )
NotifyNewCommunities O( ¯NC·(NP−1))
NotifyVertexCommunities O( ¯NV ·N¯N)
ProcessNewCommunityMessages O( ¯NC·(NP−1))
ProcessVertexCommunityMessages O( ¯NV ·N¯EN)
EvolveCommunities O( ¯NV ·N¯N·N¯V C)
NotifyVertexActions O( ¯NC·(NP−1))
ProcessActionMessages O( ¯NC·(NP−1))
MergeCommunities O( ¯NV ·N¯V C2 )
5.1. Experiment Setup
We implemented the PSOCD algorithm on the Giraph++ model and deployed it on a cluster with 20 virtual machines, one virtual machine as the master of the system and the other 19 as slavers (worker nodes). Each virtual machine has 4 core CPUs and 16G memory. The operating system used is Ubuntu 14.04, and the version of Hadoop deploying Giraph++ is 0.20.203.
The maximum computation super-steps in experiments is set as 30. Within the first half number of evolution iterations, the threshold of connection strength ratio of vertex joining is set as 0.8, in order to get a high quality core community structure, and then in the second half, the threshold is reduced to 0.5 or even less, for the purpose of getting more complete communities.
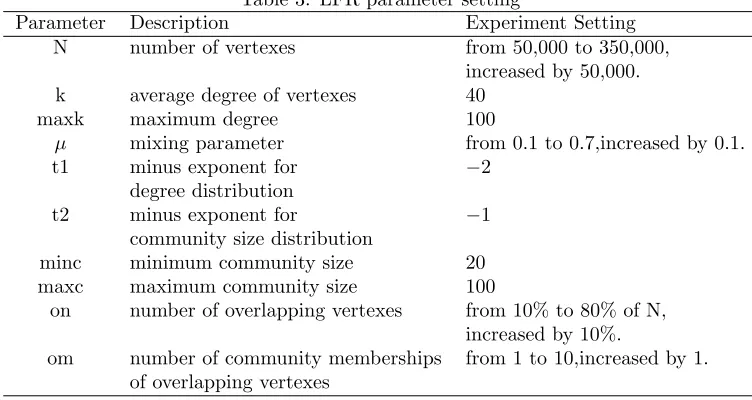
Table 3: LFR parameter setting
Parameter Description Experiment Setting
N number of vertexes from 50,000 to 350,000, increased by 50,000. k average degree of vertexes 40
maxk maximum degree 100
µ mixing parameter from 0.1 to 0.7,increased by 0.1.
t1 minus exponent for −2
degree distribution
t2 minus exponent for −1
community size distribution
minc minimum community size 20
maxc maximum community size 100
on number of overlapping vertexes from 10% to 80% of N, increased by 10%.
om number of community memberships from 1 to 10,increased by 1. of overlapping vertexes
5.2. Synthesized Networks 5.2.1. Network Data
First we use synthesized large complex networks as evaluation data set, since the exact real community structure could be used as the ground truth. The LFR model [37] is widely employed in performance evaluation of com-munity detection algorithms and could generate a large scale network and its community structure. The model is characterized by parameters listed in Table 3. The mixing parameter µ =zout/(zin+zout) that gives the ratio
between external degree of a node and its total degree . The zin and zout
are the internal and external degree of a node with respect to its belonging community, respectively. As µ < 0.5, the community structure of a network is well defined.
the fourth type, we raised the omfrom 1 to 10, increased by 1, and setN as 100,000, µ as 0.3, andon as 10%. Other parameter-settings can be found in Table 3. There are 32 networks generated in total. Each network is divided to approximately equal-sized sub-networks, with size about from 20,000 to 30,000, using the Metis algorithm.
5.2.2. Community Structure Quality Measurement
To evaluate the quality of the detected community structure, we adopt the Overlapping Normalized Mutual Information (ONMI) to measure the similarity between the detected community structure and the real ground-truth one. Moreover, for overlapping community structure, the quality of detected overlapping vertexes should also be assessed. For this purpose, the recall, the precision, and the F-score metrics are employed.
• ONMI
The Normalized Mutual Information (NMI)[38] is a well-known entropy measure in information theory and is widely used for disjoint community structure evaluation. McDaid et. al. [39] developed a new version, which is defined as follows, for overlapping community structure evaluation:
ONMI = I(X :Y)
max(H(X), H(Y)) (3)
whereX andY are the detected community structure and the real one,H(X) and H(Y) are the entropies of the two community structures, respectively. The I(X :Y) is the mutual information of X and Y, defined as:
I(X :Y) = 1
2[H(X)−H(X|Y) +H(Y)−H(Y|X)] (4) where H(X|Y) and H(Y|X) are the conditional entropies of X and Y, re-spectively. More details could be found in [39].
The ONMI measures the quality of the whole community structure sta-tistically. The larger the value, the more similar the two structures are. If the two compared structures are same, the ONMI equals 1. On the other hand, if they are totally different, the ONMI becomes 0.
structures by LFR used as ground-truth. We found that in the generated structures, there are a number of wrong assignments where vertexes join to communities that they should not, and missing assignments where vertexes do not join to communities that they should, especially for networks with largeµ,om, oron. However, the post-process could only correct the majority of wrong assignments, but has no effect on missing assignments. Fortunately, the missing assignments are much less than the wrong assignments in gen-erated community structures. In addition, from the principle of PSOCD, it is a way to correct missing assignments, namely, missing assignments rarely exist in results by PSOCD.
• Quality of Overlapping Vertexes
The quality of detected overlapping vertexes should be measured from three aspects: 1) how many detected overlapping vertexes are true? 2) how many true overlapping vertexes are detected? and 3) are the numbers of com-munity memberships of overlapping vertexes correct? We use the precision (denoted as P) to evaluate the first aspect and the recall (denoted as R) to assess the second. The third aspect is depicted statistically by distributions of community memberships of all overlappign vertexes.
The precision is defined as:
P = N umberOf CorrectlyDetectedOverlappingV ertexes
N umberOf T otalDetectedOverlappingV ertexes , (5) and the recall is:
R = N umberOf CorrectlyDetectedOverlappingV ertexes
N umberOf T rueOverlappingV ertexes . (6) Usually, the F-score (denoted as F), which is the harmonic mean of P and R, is used as an overall index of P and R. The F is defined as:
F = 2R·P
R+P (7)
5.2.3. Results Analysis
0 0.5 1 1.5 2 2.5 3 3.5 4
N ×105
0.85 0.9 0.95 1
avg. ONMI
(a) N changing
SLPA OSLOM PSOCD
0.1 0.2 0.3 0.4 0.5 0.6 0.7
µ 0.85 0.9 0.95 1 avg. ONMI
(b) µ changing
SLPA OSLOM PSOCD
10 20 30 40 50 60 70 80
on(%) 0.3 0.4 0.5 0.6 0.7 0.8 0.9 1 avg. ONMI
(c) on changing
SLPA OSLOM PSOCD
0 2 4 6 8 10
om 0.6 0.7 0.8 0.9 1 avg. ONMI
(d) om changing
SLPA OSLOM PSOCD
Figure 12: ONMIs of test synthesized networks.
be seen from the figure: 1) the ONMIs of PSOCD are the best for nearly all test networks, and those of OSLOM are the second best except for networks with very largeom. 2) asN orµincreases, the ONMIs of all three algorithms are quite stable. 3) as on raises from 10% to 80% of total vertex number, the ONMIs of all three algorithms are decreasing greatly, except as the ratio reaching 70% and 80% for OSLOM where the ONMI is slightly increasing. However, the ONMIs of PSOCD are much better than those of the two others, particularly for largeonnetworks, i.e. high overlapping density networks. 4) while the overlapping memberships om grows from 1 to 10, the ONMIs of SLPA and OSLOM are decreasing greatly, but those of PSOCD are much stable. It suggests that the PSOCD is more suitable for high overlapping diversity network (network with large om) analysis.
0.5 1 1.5 2 2.5 3 3.5
N ×105
0.98 0.985 0.99 0.995 1 1.005 1.01 Avg. Precision
(a) N changing
SLPA OSLOM PSOCD
0.1 0.2 0.3 0.4 0.5 0.6 0.7
µ 0.94 0.96 0.98 1 Avg. Precision
(b) µ changing
SLPA OSLOM PSOCD
10 20 30 40 50 60 70 80
on(%) 0.94 0.96 0.98 1 Avg. Precision
(c) on changing
SLPA OSLOM PSOCD
1 2 3 4 5 6 7 8 9 10 11
om 0.94 0.96 0.98 1 Avg. Precision
(d) om changing
SLPA OSLOM PSOCD
Figure 13: Precisions of test synthesized networks.
and the better one of the two others are very small, and the precisions of PSOCD are fairly good. Fig.14 demonstrates that for all test networks, the PSOCD could find out the overwhelming majority of true overlapping ver-texes, and the recalls of PSOCD are much better than those of OSLOM and SLPA. Particularly, the recalls of SLPA could not be acceptable for networks with very large on. Fig.15 shows the F-scores for test networks, and it con-firms that the performance of PSOCD is better than that of OSLOM and SLPA as a whole.
0.5 1 1.5 2 2.5 3 3.5
N ×105
0.85 0.9 0.95 1
Avg. Recall
(a) N changing
SLPA OSLOM PSOCD
0.1 0.2 0.3 0.4 0.5 0.6 0.7
µ 0.7 0.75 0.8 0.85 0.9 0.95 1 1.05 Avg. Recall
(b) µ changing
SLPA OSLOM PSOCD
10 20 30 40 50 60 70 80
on(%) 0.2 0.4 0.6 0.8 1 Avg. Recall
(c) on changing
SLPA OSLOM PSOCD
1 2 3 4 5 6 7 8 9 10 11
om 0.8 0.85 0.9 0.95 1 Avg. Recall
(d) om changing
SLPA OSLOM PSOCD
Figure 14: Recalls of test synthesized networks.
As a result, it is safe to conclude that the performance of the proposed PSOCD is better than that of the SLPA and the OSLOM, and the PSOCD is an appropriate choice for high overlapping density or high overlapping diversity network analysis.
5.3. Real Networks 5.3.1. Network Data
The advantage of using synthesized networks in evaluation is that the ground-truth community structures are known priorly. In result, the assess-ment of algorithm performance is easily conducted. However, the properties of real world networks could be more complicated than those of synthesized networks. We also tested our algorithm on three real, undirected and un-weighted networks. They arethe Condense Matter Physics collaboration net-work (CondMat), the Computer science bibliography network (DBLP) and
0.5 1 1.5 2 2.5 3 3.5
N ×105
0.9 0.92 0.94 0.96 0.98 1 Avg. F-score
(a) N changing
SLPA OSLOM PSOCD
0.1 0.2 0.3 0.4 0.5 0.6 0.7
µ 0.8 0.85 0.9 0.95 1 Avg. F-score
(b) µ changing
SLPA OSLOM PSOCD
10 20 30 40 50 60 70 80
on(%) 0.4 0.5 0.6 0.7 0.8 0.9 1 Avg. F-score
(c) on changing
SLPA OSLOM PSOCD
1 2 3 4 5 6 7 8 9 10 11
om 0.85 0.9 0.95 1 Avg. F-score
(d) om changing
SLPA OSLOM PSOCD
Figure 15: F-scores of test synthesized networks.
are downloaded from the Stanford Network Analysis Project (SNAP)1. The properties of the three real networks could be found in Table 4.
The CondMat network [40] is from the e-print Arxiv and covers scientific collaborations between authors of whom papers are submitted to Condense Matter category. A vertex in the network represents an author, and if author ico-authored a paper with authorj, the network contains an undirected edge betweeniandj. The network covers papers in the period from January 1993 to April 2003 (124 months).
The DBLP (Digital Bibliography and Library Project) data [41] provides a comprehensive list of research papers in computer science. The SNAP constructs a co-authorship network where two authors are connected if they publish at least one paper together.
The Amazon network was collected by crawling Amazon website [42]. A vertex of the network is a product, and if productiis frequently co-purchased by customers with product j, the network then contains an undirected edge
2 3 4 5 6 7 8 9 10 11 12
om = 2
0 5 10
Avg. Pct.(%) 2 3 4 5 6 7 8 9 10 11 12
om = 3
0 5 10
Avg. Pct.(%)
2 3 4 5 6 7 8 9 10 11 12
om = 4
0 5 10 Avg. Pct.(%) SLPA OSLOM PSOCD REAL
2 3 4 5 6 7 8 9 10 11 12
om = 5
0 5 10
Avg. Pct.(%)
2 3 4 5 6 7 8 9 10 11 12
om = 6
0 5 10
Avg. Pct.(%) 2 3 4 5 6 7 8 9 10 11 12
om = 7
0 5 10
Avg. Pct.(%)
2 3 4 5 6 7 8 9 10 11 12
om = 8
0 5 10
Avg. Pct.(%) 2 3 4 5 6 7 8 9 10 11 12
om = 9
0 5 10
Avg. Pct.(%)
2 3 4 5 6 7 8 9 10 11 12
om = 10
0 5 10
Avg. Pct.(%)
Figure 16: Distributions of overlapping memberships of synthesized networks.
Table 4: Properties of Real World Networks
Network Vertex Edge Max Max Remained Removed
Number (V#) Number (E#) Component V# Component E# V# Ratio(%)
CondMat 23133 186878 21363 182572 19606 8.22
DBLP 317080 2099732 317080 2099732 271646 14.33
Amazon 334863 1851744 334863 1851744 305892 8.65
between vertexiand vertexj. It is reasonable to expect that the connections of the Amazon network is sparse, while those of the CondMat and DBLP network are dense, i.e. their topology structures are more complex.
accelerated. The properties of trimmed maximum component networks are listed in Table 4, as well.
5.3.2. Quality of Community Structure
Generally, it is hard to assess the quality of a community structure of a real network, since a true community structure is difficult to define and is most usually unknown, especially for a large network. Though a ’ground-truth’ community structure of the Amazon (and the DBLP) is provided by SNAP, it is a so-called functional community structure of which a community is a set of vertexes having a common function or role. For example, a ’true’ community of the Amazon is a product category, and a ’true’ community of the DBLP is a publication venue (a journal or a conference), namely, authors who publish papers in the same journal or conference belong to a community. However, a community discovered by almost all current algorithms, including PSOCD, is a so-called structural community which is defined on the connec-tivity pattern of a network. Whether a functional community structure could be effectively found by a structural community detection algorithm depends on if the functional communities exhibit a distinct connectivity pattern. In this paper, we focus on a structural community detection algorithm to ex-tract high quality structural communities. We do not use the ONMI to evaluate detected structural community structures of real networks to avoid the impacts of ground-truth functional community structure constructions.
Another way to evaluate the quality of a community structure is map-ping the structure to a score. The most famous one is the Newman’s mod-ularity, which is widely used to measure the quality of disjoint community structures. There are a number of metrics extended from the Newman’s modularity for assessment of overlapping community structures. Chen et. al. [5] compared the most of extended modularities and other six metrics systematically. Moreover, they proposed a general extension modularity for overlapping community structure and extended the modularity density met-ric to enable its usage for overlapping community structure as well.
• General Extension Modularity for Overlapping Community Structure After studying several versions of extended modularities, Chen et. al. [5] proposed a general extension modularity which is defined as follows:
Qov =
X
c∈C
"
|Ein c | |E| −
2|Ein
c |+|Ecout|
2|E|
2#
whilecis a community from a community structureC,|Ein
c |=
1 2
P
i,j∈cf(ai,c, aj,c)Aij, |Eout
c | =
P
i∈c
P
c0∈C,c6=c0,j∈c0Aij , and |E| = 12
P
ijAij. The ai,c (aj,c) is the
belonging coefficient of vertex i (j) to community c, and the f(ai,c, aj,c) is
the belonging function which can be the product or average of ai,c and aj,c.
Based on the results of a number of experiments, the authors recommended to use the reciprocal of the community membership number as the belong-ing coefficient and the product of two belongbelong-ing coefficients as the belongbelong-ing function because of their effectiveness and simplicity. The Aij is the ith row
and jth column element of the adjacent matrix representing the processed network. If vertex iconnects to vertex j, thenAij = 1, otherwise Aij = 0.
• Extension Modularity Density for Overlapping Community Structure
However, the Newman’s modularity incurs two opposite yet coexisting problems, thus the extended ones: in some cases it tends to prefer small communities over large ones, while in others favor large communities over small ones. In literature, the later tendency is referred as the resolution limit problem. To address these two problems, the Modularity Density was pro-posed by integrating two additional components, the split penalty and the
community density, into the modularity calculation. Chen et. al. [5] pro-posed an extension modularity density for overlapping community structure assessment as well. The extension modularity density is described as:
Qovds =X
c∈C
|
Ein c | |E| dc −
2|Ein
c |+|Ecout|
2|E| dc
2
− X
c0∈C,c06=c |Ec,c0|
2|E| dc,c0
#
(9)
while |Ec,c0| = P
i∈c,j∈c0,c6=c0f(ai,c, aj,c0)Aij, dc = 2|Ein c |/
P
i,j∈c,i6=jf(ai,c, aj,c)
and dc,c0 =|Ec, c0|/P
i∈c,j∈c0f(ai,c, aj,c0). The suggested belonging coefficient
and belonging function were same as in the extension of modularity, i.e. the reciprocal of the community membership number and the product of two belonging coefficients, respectively.
reason behind is that the two metrics take overlapping membership number into consideration, and in the case if the overlapping community structures discovered by the two algorithms are quite different, for example, the over-lapping memberships and overover-lapping vertexes detected by one algorithm are small and less, while those detected by the other one are high and mass, the conclusion deduced could be misleading. As an example, we generated a 100,000 vertex LRF synthesized network of which fifty percent vertexes are overlapping vertexes. The overlapping membership number om is set as 10, the µ is 0.3, and other parameters are same as listed in Table 3. The average ONMI (30 runs) of the community structures detected by PSOCD with respect to the post-processed ground-truth community structure is as high as 0.7672, while the average ONMI of SLPA is only 0.5064. There is no doubt that the quality of the community structures detected by PSOCD is much better than those by SLPA. However, the averaged extended mod-ularity of the community strructures by PSOCD and SLPA are 0.1694 and 0.1865, respectively. As a result, a wrong conclusion that SLPA outperforms PSOCD could be deduced. The averaged extended modularity density of the results by PSOCD and SLPA are 0.06920 and 0.06148, respectively. Though a consistent conclusion as the ONMI values suggest could be inferred for this generated network, a false conclusion may be derived for some networks, just as the prior example in the extended modularity case, due to the same reason. Therefore, we suggest that the two metrics (and similar metrics) should not be used as indexes for performance comparison between different overlapping community detection algorithms.
• Community Structure Property Distribution
then crossovers to law, while the other three distributions obey power-law. These distributions uncover the modular structure of complex networks, however, they could not be used to rank community structures detected by different algorithms. We employ these distributions to describe features of discovered community structures in our experiments.
• Network Average Connection Strength
We define the average connection strength of a network based on the vertex connection score in equation 2 as a quality metric for overlapping community structure, that is:
CSG=
1
|C|
X
c∈C,|c|≥3 1
|c|
X
v∈c
CS(v) (10)
while C denotes a community structure, |C| represents the number of com-munities in C,c is a community belonging toC, and|c| indicates the size of community c. Given that a community with only one or two members has no internal structure, we do not include such communities as computing the network average connection strength. We refer these communities with at least three members as a core community structure of a network. Generally, a community has more internal connections within its members, but less exter-nal connections with other communities. As for an overlapping community structure, the measurement of external connections in quality evaluation is meaningless, even harmful, because overlapping vertexes may have a large number of out connections. The CSG presents a type of internal connection
strength measurement and reflects the quality of a core community structure to some extent. The larger the value, the better the quality. It could be used as a metric for ranking different community structures.
5.3.3. Results Analysis
Table 5 lists some statistical properties of the detected community struc-tures of the three real world networks by different algorithms. The SLPAomod
and SLPAomdsstand for the best results of SLPA algorithm selected from
Table 5: Properties (averages and 95% confidence intervals) of detected community struc-tures of real world networks, averaged over 30 runs. ¯|C|>2is the averaged number of com-munities with size>2; ¯|C|=2 is the averaged number of communities with size=2; ¯|C|=1
is the averaged number of communities with size=1; OV R is the averaged overlapping vertex ratio; and CSG is the network averaged connection strength.
Network Algorithm |C¯|>2 |C¯|=2 |C¯|=1 OV R(%) CSG
SLPAomod 1375.9±31.4 95.0±24.7 138.0±32.9 1.87±2.31 0.8430±0.0073
SLPAomds 1375.4±32.3 100.9±19.8 144.5±21.4 0.64±0.92 0.8415±0.0078
CondMat OSLOM 1529.8±29.8 5.4±5.1 354.9±43.5 11.15±0.49 0.8760±0.0035 PSOCD 1263.6±21.2 26.7±7.1 4728.8±64.1 30.23±0.76 0.9208±0.0031 SLPAomod 20137.7±130.5 1632.9±99.0 2060.0±144.1 2.16±0.69 0.8512±0.0016
SLPAomds 20100.5±126.6 1737.5±70.3 2207.47±107.8 0.52±0.02 0.8503±0.0016
DBLP OSLOM 17384.3±131.7 83.8±16.7 5324.7±121.1 7.47±0.18 0.8709±0.0012 PSOCD 10406.6±56.8 188.5±17.6 114420.8±324.0 17.60±0.37 0.9179±0.0010 SLPAomod 21342.7±120.7 1224±100.0 2968.8±152.9 1.45±1.02 0.8155±0.0020
SLPAomds 21317.5±112.5 1292.5±61.7 3064.3±118.8 0.44±0.04 0.8141±0.0012
Amazon OSLOM 17075.0±84.3 5.3±4.9 1316.2±113.1 4.12±0.12 0.8488±0.0008 PSOCD 7942.6±28.8 15.7±4.7 109297.9±453.2 4.08±0.22 0.9016±0.0006
according to the extended modularity or the extended modularity density and select the best one. All values in Table 5 are averaged over results of 30 runs. The associate 95% confidence intervals are given as well.
From the table, it could be seen that: 1) As for the number of com-munities, the PSOCD found the least core communities (community with size > 2) and the most one-size communities, while the two SLPA discov-ered the most two-size communities. The differences of detected community numbers between PSOCD and other algorithms are huge. Therefore, the de-tected community structures by different algorithms are quite different. We carefully checked the one-size communities and found that the sole member of such a community has at most one connection with other communities. In consequence, the existence of these vast one-size communities is reason-able. 2) From the aspect of overlapping vertexes, the variances of the results are great as well, and particularly those found by the two SLPA algorithms have large gaps. The SLPAomds found the least overlapping vertexes, while
the PSOCD found the most ones except for the Amazon network. For the Amazon network, the results of OSLOM and PSOCD roughly agree to each other. 3) From the viewpoint of network average connection strength, the results of SLPAomod are slightly better than those of SLPAomds, which can
from the fact that it found a huge number of one-size communities. In other words, the PSOCD discovered better core community structures for these real networks.
We also present the four statistical distributions proposed in [43] to de-scribe features of detected community structures by different algorithms. The results are also averaged over 30 runs. Fig. 17 depicts the cumulative distributions of overlapping memberships. As can be seen, the overlapping memberships found by PSOCD are quite different from those by OSLOM and SLPA. The PSOCD detects more overlapping vertexes and their overlapping memberships are distributed within a much wider range, which has a high upper bound, while the OSLOM and the SLPA can only find less overlap-ping vertexes and their associate overlapoverlap-ping memberships are much smaller. Though the PSOCD may overestimate at the end part of large overlapping memberships, just as shown in the synthesized network experiments, those overestimated take up only a small portion as shown in the figure. Specif-ically, the overlapping memberships detected by PSOCD for the Amazon network are similar to those by OSLOM, with the slight difference that for each largeomthe PSOCD finds more overlapping vertexes. It should also be noted that the trends of detected overlapping membership distributions of the CondMat by each algorithm are similar to those of the DBLP. However, the trends of the Amazon are much different from those of the two collabo-ration networks. This reflects the fact that the structure of the Amazon is quite different from the structures of the CondMat and the DBLP, just as what expected.
Fig. 18 displays the double log plots of the overlapping membership cu-mulative distributions by PSOCD, as they have more data points. From the figure, we can see that the cumulative overlapping membership distributions of the CondMat and the DBLP follow a two-phase power-law function. The power-law exponents are shown in the figure. The distribution of the Ama-zon network is not fit because there is only a small number of data points. In [44], Jebabli et. al. analyzed the functional community structure of the same DBLP network, and they reported that the distribution of cumulative overlapping memberships is power-law, too. Moreover, the range of detected overlapping memberships by PSOCD is comparable to the reported one in [44]. Thereby, we believe the quality of overlapping memberships discov-ered by our PSOCD for the three real networks is superior to those of other compared algorithms.
distribu-0 50 100 150 200 om 0.65 0.7 0.75 0.8 0.85 0.9 0.95 1 cumulative percent(%) CondMat SLPAomod SLPAomds OSLOM PSOCD
0 2 4 6 8
om 0.9 0.92 0.94 0.96 0.98 1 cumulative percent(%) Amazon SLPAomod SLPAomds OSLOM PSOCD
0 50 100 150
om 0.8 0.82 0.84 0.86 0.88 0.9 0.92 0.94 0.96 0.98 1 cumulative percent(%) DBLP SLPAomod SLPAomds OSLOM PSOCD
Figure 17: Overlapping membership cumulative distributions of real world networks.
0 0.5 1 1.5 2 2.5 log10(om) -0.16 -0.14 -0.12 -0.1 -0.08 -0.06 -0.04 -0.02 0 log10(cumulative percent) CondMat
-0.2 0 0.2 0.4 0.6 0.8
log10(om) -20 -18 -16 -14 -12 -10 -8 -6 -4 -2 0 log10(cumulative percent)
×10-3 amazon
0 0.5 1 1.5 2 2.5
log10(om) -0.09 -0.08 -0.07 -0.06 -0.05 -0.04 -0.03 -0.02 -0.01 0 0.01 log10(cumulative percent) DBLP 0.097960 0.050605 0.060778 0.015372
Figure 18: Double log of overlapping membership cumulative distributions of real world networks, detected by PSOCD.
focus only on the trends of cumulative distributions here.
0 1 2 3 4 log10(community size) 0.5 1 1.5 2 2.5 3 3.5 log10(cumulative freqency) CondMat SLPAomod SLPAomds OSLOM PSOCD
0 1 2 3 4
log10(community size) 0.5 1 1.5 2 2.5 3 3.5 4 4.5 log10(cumulative freqency) Amazon SLPAomod SLPAomds OSLOM PSOCD
-1 0 1 2 3 4
log10(community size) 1.5 2 2.5 3 3.5 4 4.5 log10(cumulative freqency) DBLP SLPAomod SLPAomds OSLOM PSOCD
Figure 19: Double log of community size cumulative distributions of real world networks.
community degrees and more overlapped communities, i.e. more complex community structures.
Finally, Fig. 21 demonstrates overlap size cumulative distributions of the three real networks. At the first glance, it is clear that the PSOCD could find much larger overlap sizes, i.e. more complex overlapping structures. Again, the first part of most distributions could be fitted by a pow-law function. Similarly as community degree cumulative distributions, the overlap size cu-mulative distributions by the two SLPA algorithms are quite different. The plots suggest that the community structures found by SLPAomod are more
complex than those by SLPAmods.
0 1 2 3 log10(community degree) 2.2 2.4 2.6 2.8 3 3.2 log10(cumulative freqency) CondMat SLPAomod SLPAomds OSLOM PSOCD
-0.5 0 0.5 1 1.5 2
log10(community degree) 3.1 3.2 3.3 3.4 3.5 3.6 3.7 3.8 3.9 4 log10(cumulative freqency) Amazon SLPAomod SLPAomds OSLOM PSOCD
0 1 2 3
log10(community degree) 3.1 3.2 3.3 3.4 3.5 3.6 3.7 3.8 3.9 4 4.1 log10(cumulative freqency) DBLP SLPAomod SLPAomds OSLOM PSOCD
Figure 20: Double log of community degree cumulative distributions of real world net-works.
[45] studied the functional community structures of a number of very large real networks. They proposed a seed based algorithm that finds all structural communities the seed vertex belongs to, and compared the detected commu-nities with the functional ground-truth ones. Palla et. al. [43] explored the structural K-clique community structures of three real networks, but the max network size is only 30739. The K-clique overlapping community detection algorithm can hardly be used on very large networks due to its computational complexity.
The properties of structural community structures of the DBLP detected by PSOCD, such as the ranges of overlap memberships, community degrees and overlap sizes, are much closer to those of the functional community struc-tures reported in [44]. In addition with the fact that the internal connection strengths by PSOCD are the best (shown in Table 5), we expect the quality of structural communities by PSOCD is superior.
0 1 2 3 log10(overlap size)
1.5 2 2.5 3 3.5 4 4.5 5
log10(cumulative freqency)
CondMat
SLPAomod SLPAomds OSLOM PSOCD
0 1 2 3
log10(overlap size) 2.5
3 3.5 4
log10(cumulative freqency)
Amazon
SLPAomod SLPAomds OSLOM PSOCD
0 1 2 3 4
log10(overlap size) 2.5
3 3.5 4 4.5 5 5.5
log10(cumulative freqency)
DBLP
SLPAomod SLPAomds OSLOM PSOCD
Figure 21: Double log of overlap size cumulative distributions of real world networks.
the OSLOM.
5.4. Discussion
The PSOCD is implemented in a distributed manner to be capable of processing large scale networks. One may wonder that the maximum network used in experiments has only 350,000 vertexes, though this size is much larger than the majority used in previous researches. However, if we increase vertex number further, say 400,000, the system will crash. The reason is that the current Giraph++ is developed on an old version Giraph, version 0.2, which has no message flow control mechanism and could crash if messages come too fast, but not the principle of PSOCD. The lack of message flow control has been fixed in new version Giraph, which could run on new version Hadoop to gain performance further. We believe the supported network size would be increased greatly if the PSOCD is implemented on a Giraph++ migrated to a new version Giraph.
com-munity structure evolves, too. The classic comcom-munity evolution includes emergence of a new one, death of an old one, expansion and contraction. The basic idea of PSOCD inherently has a good support for such a dynamic network analysis. The initializing phase could be executed properly on added vertexes and their direct neighbors to find newly created communities. The joining and leaving actions will lead to expansion and contraction of com-munities, respectively. If all members leave from a community, then this community is dead. Therefore, by proper implementation of the algorithm on a platform that supports network evolution, it could be used to analyze evolving community structures of dynamic networks.
Another main property of community structure is hierarchy, i.e., there exists a community structure in the community network recursively. Since the size of a community network is usually much smaller than the size of the associate original network, it is easy to construct a hierarchy structure if lowest level communities are given. What the PSOCD found is just a fine-grained and lowest level community structure. As a result, a hierarchy structure could be constructed easily by running PSOCD or other algorithms having good performance but with difficulty processing large scale networks recursively.
6. Conclusion