Bovine telomere dynamics and
the association between telomere
length and productive lifespan
Luise A. Seeker
1,2, Joanna J. Ilska
1, Androniki Psifidi
2,3, Rachael V.
Wilbourn
4,
Sarah L. Underwood
4, Jennifer Fairlie
4, Rebecca Holland
4, Hannah Froy
4, Eliane
Salvo-Chirnside
5, Ainsley Bagnall
6, Bruce Whitelaw
2, Mike P. Coffey
1, Daniel H. Nussey
4&
Georgios Banos
1,2Average telomere length (TL) in blood cells has been shown to decline with age in a range of vertebrate
species, and there is evidence that TL is a heritable trait associated with late-life health and mortality in humans. In non-human mammals, few studies to date have examined lifelong telomere dynamics and no study has estimated the heritability of TL, despite these being important steps towards assessing
the potential of TL as a biomarker of productive lifespan and health in livestock species. Here we
measured relative leukocyte TL (RLTL) in 1,328 samples from 308 Holstein Friesian dairy cows and in 284 samples from 38 female calves. We found that RLTL declines after birth but remains relatively stable in adult life. We also calculated the first heritability estimates of RLTL in a livestock species which were 0.38 (SE = 0.03) and 0.32 (SE = 0.08) for the cow and the calf dataset, respectively. RLTL measured at the ages of one and five years were positively correlated with productive lifespan (p < 0.05). We conclude that bovine RLTL is a heritable trait, and its association with productive lifespan may be used
in breeding programmes aiming to enhance cow longevity.
Telomeres are structures at the ends of linear chromosomes that consist of repetitive DNA nucleotides and attached proteins of the shelterin complex1,2. They are crucial for chromosomal integrity and pairing of
homol-ogous chromosomes during meiosis3,4. In most cultured cells telomeres shorten with every cell division5 due to
the end replication problem6,7. When telomeres become critically short and repair mechanisms are not activated,
normal somatic cells enter apoptosis or a state called replicative senescence where they are unable to divide fur-ther8. Other cell types such as cancer cells9, embryonic tissue cells10,11, stem cells including hematopoietic stem
cells12, and lymphocytes12 have been shown to express the reverse transcriptase telomerase13 that can replenish
telomere length and elongate their replicative lifespan14 or even immortalise them15. However, in most cases,
tel-omere shortening is a hallmark of cellular ageing and also seems to be associated with organismal ageing16. Most
young individuals have longer telomeres than old individuals of the same species17–20, although among species
TL dynamics with age vary considerably. In humans, telomere attrition with age is usually described to follow a general pattern with three stages: (1) fast telomere attrition in early life, (2) slower attrition or plateau in young adulthood and middle age, and (3) rapid depletion at older ages21,22. Rapid telomere attrition during early life has
been observed in a wide range of species, including Soay sheep23, baboons24, European shags25 and wandering
albatrosses25. However, the pattern of change in TL with age during adult life seems to vary. Adélie penguins,
common terns, tree swallows, zebra finches and great frigatebirds show continuing telomere attrition at adult age26,27, whilst TL remains stable in adult European shags and wandering albatrosses25, and it actually increases
in adult edible dormice28.
Average TL, measured in leukocytes in mammals and erythrocytes in non-mammalian vertebrates, has emerged as a potentially important biomarker of health and ageing across disciplines including epidemiology, biomedicine, ecology and animal welfare29–36. There is mounting evidence from across a range of species that
1Animal & Veterinary Sciences Group, SRUC, Roslin Institute Building, Easter Bush, Midlothian, UK. 2The Roslin Institute and Royal (Dick) School of Veterinary Studies, University of Edinburgh, Easter Bush, Midlothian, UK. 3Queen Mother Hospital for Animals, Royal Veterinary College, University of London, Hatfield, UK. 4Institute of Evolutionary Biology, School of Biological Sciences, University of Edinburgh, Edinburgh, Midlothian, UK. 5Centre for Systems Biology, University of Edinburgh, Edinburgh, Midlothian, UK. 6SRUC Crichton Royal Farm, Glencaple Road, Dumfries, UK. Correspondence and requests for materials should be addressed to L.A.S. (email: Luise.seeker@ed.ac.uk)
Received: 11 July 2017 Accepted: 3 August 2018 Published: xx xx xxxx
blood cell TL is both heritable and predictive of subsequent health and mortality risk37–39. Heritability estimates
of TL have been calculated using parent-offspring regressions, correlations between twins or pedigree-based ‘animal’ models for a variety of species including humans, sand lizards and a range of bird species. Most studies suggest that variance in TL is under some degree of genetic control37.
Short telomeres have been shown to be associated with higher mortality in species such as zebra finches40,
semi-feral Soay sheep23 and humans38,41. However, other studies found no relationship between TL and
lifespan42,43. A meta-analysis of human studies found evidence that the association between TL and mortality risk
was only present at younger adult ages38, whilst a meta-analysis of non-human vertebrate studies found a
signifi-cant overall association between TL and survival despite considerable variation among studies39.
Interest in the potential application of TL as a biomarker of health and welfare within the livestock industry is growing29,44. In particular, the improvement of so-called ‘functional longevity’ (which is productive lifespan
corrected for milk yield) is currently a chief breeding goal in dairy cattle, because it would reduce the require-ment for replacerequire-ment heifers, minimise waste, improve animal welfare, and decrease greenhouse gas emissions and farming costs45. Improving functional longevity is difficult to achieve with conventional selective breeding
for several reasons: phenotypes are recorded at the end of life which causes long generation intervals and slows genetic progress46; the recording of specific phenotypes such as reasons for culling is laborious and often not
practical on a busy commercial farm; functional longevity in cattle is known to have a low heritability of approx-imately 0.01–0.0647. Therefore, an early life biomarker that is heritable and correlated with functional longevity
would benefit the dairy industry tremendously, as it would enable the selection of animals in early life based on the biomarker measurement, long before they express the phenotype of interest (productive lifespan).
Currently, very little is known about TL dynamics across different ages in cattle. Telomere length in bovine embryos may be adjusted by telomerase expression at the transition from morula to blastocyst stage48 but
litera-ture on the post-natal TL profile is scarce. In two cross-sectional studies, young cattle were found to have longer telomeres than older animals suggesting that bovine telomeres might shorten with age44,49. Based on those studies
it can be hypothesised that cattle would follow a human-like TL dynamics with age where telomeres shorten quickly after birth and at a slower pace thereafter.
As mentioned, for TL to be a useful biomarker for selective breeding purposes, it must be heritable. Heritability estimates for TL in non-human mammals outside the laboratory are so far missing from the literature. However, based on detection of low to moderate heritability of TL in humans and wild bird studies and the fact that domes-tic cattle live in a more controlled environment than either of the former species, we hypothesise that RLTL should be at least moderately heritable in cattle as well.
Crucially, the relationship between RLTL at different life stages and productive or functional longevity in dairy cattle has not been explored. Obviously, productive lifespan of dairy cows differs from longevity measurements in humans and wild animals because most cows are culled by humans. However, cows are not randomly chosen for culling, which is usually based on poor fertility or health. The only study that has addressed the association of TL with productivity in dairy cattle so far indeed found suggestive evidence that animals with short telomeres were more likely to be culled within one year of measurement44. However, the hypothesis that TL measured during
early life in dairy cattle is predictive of future productive longevity remains to be tested.
In the present study, we repeatedly measured individual RLTL at different life stages in a large, well-monitored and pedigreed population of Holstein Friesian dairy cattle50. Animals were kept at the Crichton Royal research
farm in Dumfries (Scotland). They represented two genetic lines (selected for high milk fat and protein yield (S) vs. control (C)) that were randomly allocated to two different diets (High forage (HF) vs. low forage (LF)) which allowed us to investigate the effect of genetic and nutritional factors on RLTL.
Our objectives were to test the following hypotheses (i) RLTL shortens with age in dairy cattle and telomere attrition is fastest shortly after birth, (ii) factors other than age such as season of birth, genetic background and diet also affect RLTL, (iii) RLTL is a heritable trait in dairy cattle and (iv) RLTL in early life is predictive of pro-ductive lifespan.
Results
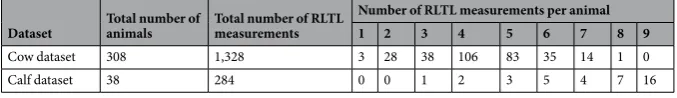
Table 1 shows the number of RLTL measurements per animal available in the cow and the calf dataset, while Tables S1 and S2 summarise other relevant information.
RLTL changes with age at the population level.
We observed a considerable decline in RLTL within the first year of life (estimate =−0.11, SE = 0.007, p < 0.001, Cohen’s D =−0.44) with the most rapid telomere deple-tion shortly after birth (Fig. 1). There was little visual evidence of a systematic change in RLTL with increasing age in animals older than one year (Fig. 1), which is consistent with the finding that modelling age as a two level factor (younger vs. older than one month of age) fitted the cow dataset best (based on AIC; Table 2). Within age group,Dataset Total number of animals Total number of RLTL measurements
Number of RLTL measurements per animal
1 2 3 4 5 6 7 8 9
Cow dataset 308 1,328 3 28 38 106 83 35 14 1 0
Calf dataset 38 284 0 0 1 2 3 5 4 7 16
RLTL was highly variable (CV = 0.16 and 0.18 for the cow and calf datasets, respectively). In fact, the distribution of measurements of neonates in the cow dataset overlapped that of the oldest animals (Fig. 1).
The cow and the calf datasets complement each other nicely in the present study. While the cow dataset pro-vides information about RLTL throughout productive life, it does not include measurements between two and six months of age. Therefore, although we see a difference in average RLTL between neonates and older animals, we cannot be certain about the dynamics of the decline within the first few months of life. This gap is filled by the calf dataset which provides repeated measurements in early life and shows that RLTL declines with age at a slightly Figure 1. Impact of age on relative leukocyte telomere length (RLTL). Top row: Cow dataset. Log transformed RLTL over age in days (left panel) and years (right panel). Bottom row: Calf data set. Log transformed RLTL over age in days (left panel) and months (right panel). In the bottom left panel a quadratic function of age is visualised.
Function of age AIC Delta AIC
Cow dataset
/ −1431.4 193.7
linear −1508.2 116.9 quadratic −1575.4 49.7
cubic −1598.6 26.5
quartic −1605.0 20.1 age as 2-level factor −1625.1 0
Calf dataset
/ −255.89 20.74
Linear −273.7 2.93
Quadratic −276.63 0 Cubic −277.64 −1.01 Quartic −275.85 0.78 Age as 2-level factor −276.92 −0.29
faster rate shortly after birth than closer to the age of one year. In the calf dataset this dynamic is best captured by a quadratic function of age or by modelling age as a two level factor (younger vs. older than four months) (Table 2), Within two AIC units the simpler model is preferred over the more complicated one51,52. We decided to include a
quadratic function of age in the final model for the analysis of the calf dataset.
Factors affecting RLTL independently of age.
The final model for the analysis of the cow dataset con-tained the animal identity as a random effect and the following significant fixed effects: age as a two-level fac-tor (younger vs. older than one month; estimate difference =−0.11, SE = 0.007, p < 0.001), birth year of cow (p = 0.004), qPCR plate (p < 0.001) and qPCR row (p < 0.001) (Supplementary Table S5). For the analysis of the calf dataset, the final model included the animal identity as a random effect, a quadratic function of age (linear estimate =−0.606, SE = 0.138, p < 0.001 and quadratic estimate = 0.294, SE = 0.13, p = 0.031), birth weight (p = 0.04) and birth season (p = 0.04) of the calf, qPCR plate (p < 0.001), and qPCR row (p < 0.01) as fixed effects. Heavier calves had marginally shorter RLTL at birth (estimate difference =−0.005, SE = 0.002, p = 0.045) and calves born over the winter months (October to March) had longer telomeres (estimate difference = 0.069, SE = 0.033, p = 0.041). Supplementary Tables S5 and S6 and Supplementary Figs S1–S4 summarise all significant effects.Interestingly, neither in the cow dataset nor in the calf dataset was the genetic group of the animal significantly associated with RLTL. Also, there was no statistically significant relationship between the feed group and RLTL in the cow dataset.
Estimation of genetic and environmental variance components.
The animal effect in the model included pedigree information, which enabled the estimation of the genetic variance for RLTL. A permanent environment random effect was also fitted to account for common non-genetic variance of repeated measures within individual animals. Estimates of variance components and genetic parameters are shown in Table 3. The variance due to permanent environment was practically zero. Therefore, the permanent environment effect on RLTL in our datasets is negligible. Heritability estimates of RLTL were 0.38 (SE = 0.03) and 0.32 (SE = 0.08) for the cow and the calf datasets, respectively.Relationship between RLTL and productive lifespan.
Livestock animals are usually culled at the end of their life. Therefore, their longevity measures have to be defined differently than for members of natural popu-lations. We define “productive lifespan” as the survival time from birth to culling measured in days. “Functional longevity” is defined as productive lifespan corrected for milk yield and is a measure that is often used in genetic studies of dairy cattle. A total of 244 out of 308 animals in the cow dataset were culled thereby providing phe-notypes for productive lifespan measurements. For most of them (220 out of 244) a precise culling reason was recorded (Supplementary Table S7). The majority of animals were culled involuntarily, particularly due to fertility problems, mastitis or lameness. Productive lifespan ranged from 17 to 2,823 days (mean = 1,477 days) (Fig. S6), which means that on average cows were culled during their third lactation. There was no difference in productive lifespan between the two genetic lines (Welch two sample t-test: t =−0.8954, df = 242, p-value = 0.3714) and between the two feed groups (Welch two sample t-test: t =−1.1235, df = 170, p-value = 0.2628).In the present study we were interested in the potential use of RLTL as an early life trait associated with pro-ductive lifespan. Therefore, the subsequent analyses were focused on RLTL measurements at birth and at the age of one year. We defined functional longevity as productive lifespan adjusted for milk yield. For this reason, we fitted a linear model with productive lifespan as the response variable and the average milk yield over the first four lactations as a covariate. Subsequently, we fitted the animal’s RLTL measurement at birth or at the age of one year (separate analyses) as a second covariate to the model to assess its relationship with functional longevity. In either case, RLTL had been first pre-adjusted for qPCR plate and row by fitting those factors as fixed effects and using the residuals of the model for further analysis. Because animals were required to have both productive lifespan and milk yield records over the first four lactations available, these analyses were based on 143 and 136 animals with RLTL measurements at birth and one year of age, respectively. Milk yield significantly affected lifespan of those animals (estimate = 81.13, SE = 13.92, p < 0.001) but RLTL neither at birth (estimate =−11.10, SE = 329.77, p = 0.973) nor at the age of one year (estimate = 355.91, SE = 394.42, p = 0.368) had a significant effect.
However, the analysis of functional longevity excluded animals that might be of particular interest: animals that died at a young age were excluded for not having productivity records; also animals that were still alive and belonged to the group of animals with the best productive lifespan were excluded, because they did not have a productive lifespan measurement yet. Therefore, we tested the phenotypic correlation between produc-tive lifespan and functional longevity (r = 0.9, p < 0.001, see Supplementary Fig. S5) and found that productive lifespan may be used as a proxy trait for functional longevity in the present study. This allowed us to include all animals that died before generating productivity measurements. Also, we considered a Cox proportional hazard
Dataset Phenotypic variance Genetic variance Permanent environment variance Residual variance Permanent environment Repeatability Heritability
cow 0.0037(1.9 × 10⁻⁴) 0.0014(0.0002) 1.8 × 10 −10
(8.1 × 10⁻¹²) 0.0023(1.03 × 10⁻⁴) 0.0(0.0) 0.3832(0.03) 0.3832(0.03)
calf 0.0047(5.6 × 10⁻⁴) 0.0015(0.0005) 2.5 × 10 −9
(2.3 × 10⁻¹⁰) 0.0032(2.97 × 10⁻⁴) 0.0(0.0) 0.3231(0.08) 0.3231(0.08)
analysis that enabled us to include all animals that were still alive by including a censoring group in the analysis. With those measures we increased our sample size from 143 to 305 RLTL measurements at birth and from 136 to 284 measurements at the age of one year. With the Cox proportional hazard analyses we investigated the survival time in years after sampling. We found that RLTL at birth was not a predictor of survival (p = 0.234), but there was a significant linear relationship between RLTL at the age of one year and subsequent survival (estimate =−1.974, SE = 0.708, p = 0.005). The estimate is negative, because it describes the relation between RLTL and mortality which is the opposite of survival. RLTL at subsequent ages were also tested. RLTL at the ages of 2–4 years did not relate to productive lifespan, but RLTL at the age of 5 years was correlated with subsequent survival (N = 53, estimate =−3.267, SE = 1.346, p = 0.015) (Table 4). We recognise the presence of multiple statistical tests in this part of analysis. Tests were not completely independent since both RLTL measurements and survival at differ-ent ages are correlated traits. Nevertheless, we implemdiffer-ented the relatively strict Holm-Borferroni correction53
according to which the most significant result in year one maintained its statistical significance but the year five result narrowly lost it. Because of the lack of test independence these corrections should be viewed with caution. In any case, our results support the presence of a significant relationship between an early RTL measurement and subsequent survival. The relationship between RLTL at the age of one year (grouped into tertiles) and productive lifespan is visualised in Fig. 2.
Discussion
This is the first large-scale longitudinal study of RLTL dynamics conducted in farm animals and one of the few lifelong studies reported in any species. The combination of calf and cow datasets provided valuable information allowing us to better understand telomere dynamics in early life and throughout the animal’s productive life, respectively. Our results show that average RLTL declines within the first year of life but remains relatively sta-ble thereafter. Telomere attrition shortly after birth has been reported in other mammals such as humans21,22,54,
baboons24 and Soay sheep23 as well as some birds such as Seychelles warblers17, European starlings55, corvids20
and Jackdaws56, and is probably due to the high number of cell divisions that are necessary for the body to grow
quickly during that time. Also, postnatal maturation of the immune system and the sudden challenge to fight off pathogens after birth might cause quick telomere depletion within the first months. Varying results have been reported about telomere dynamics in adult life in different species. While some studies in humans, badgers and birds show a linear telomere decline throughout adult life17,18,20,21,54, a study on the semi-feral Soay sheep reported
more complex dynamics: telomeres shortened within the first four months of life, then lengthened until the age of 5 years and shortened afterwards again23. Other studies in mammals and birds report similar results to ours
with no relation between age and TL after the initial decline early in life24,25,57. A particularly interesting telomere
changing pattern has been observed in edible dormice: after the initial decline in early age, telomeres elongate considerably in adult life28. Those are a few examples that illustrate that telomere dynamics across life stages vary
among species. Our results do not support former studies on TL in cattle that reported an age-dependent decline
RTL at age
in years N Beta coefficient (SE) Hazard Ratio (95% CI) Wald statistic αBonferroni correction-value after Holm- p-value
0 305 0.768 (0.661) 2.155 (0.591–7.866) 1.35 / 0.245 1 284 −1.974 (0.708) 0.139 (0.035–0.556) 7.78 0.0083 0.005 2 261 0.763 (0.682) 2.144 (0.563–8.16) 1.25 / 0.264 3 220 −1.285 (0.744) 0.277 (0.064–1.188) 2.99 / 0.084 4 208 −1.147 (0.763) 0.318 (0.071–1.416) 2.26 / 0.133 5 53 −3.267 (1.346) 0.038 (0.003–0.533) 5.89 0.01 0.015
Table 4. Relationship of RLTL measured at different ages with subsequent survival. CI: Confidence interval.
in adult life44,49. Former studies may have found TL attrition with age, because they included older animals in
their analyses (maximum age of 13 or 14 years44,49 compared to six years in the present study). It is possible that
bovine RLTL dynamics are similar to those observed in humans with fast telomere attrition in early life, a pla-teau in younger adulthood and possibly a second decline later in life that we failed to detect in the present study because we did not test animals that were older than six years. Another explanation may be that cattle indeed maintain their telomere length through the expression of telomerase in hematopoietic stem cells or lymphocytes. The function and role of telomerase were beyond of the scope of the present study but need to be addressed in future research.
To our knowledge we report in the present study the first heritability estimates for RLTL in a livestock species. Presence of significant genetic variation and heritability of bovine RLTL suggests that the trait may be altered with selective breeding; heritability estimates of RLTL in cattle were relatively high (0.31–0.39) and within the range of estimates reported for other species such as humans (h2= 0.28–0.76)41,58–64 and birds (h2= 0–0.999)65–69. The
human studies benefitted in comparison to the bird studies from larger sample sizes37.
One factor that might affect our heritability estimates of RLTL is the potential presence of interstitial telomeres in the cattle genome. Interstitial telomeres are telomeric sequences that are not located at the ends of chromo-somes but between centromeres and telomeres70–75. Interstitial telomeres are believed to be constant in their
amount between tissues and also to remain constant in their length with ageing. Therefore, their presence could lead to an over-estimation of the heritability of RLTL. However, little is known about the presence of interstitial telomeres in the cattle genome to date. For future studies it would be interesting to measure bovine TL using a method that exclusively measures telomeric sequences at the ends of chromosomes (in gel TRF76) which will
provide more accurate heritability estimates if interstitial telomere are present in the cattle genome and if their amount varies between individuals.
The two genetic groups in our study population, which had been selected to differ considerably in milk pro-duction, did not differ in their mean RLTL. Based on these results an unfavourable genetic correlation between TL and productivity is highly unlikely which is desirable because it implies that TL may be altered with genetic selection within a breeding programme without reducing the milk yield of cows.
We found that feed group of the animals did neither affect RLTL nor the productive lifespan. It has been shown that calorie restriction improves longevity in many species77 and also that diet affects TL in humans78–80.
However, the human diet varies a lot more between individuals and there is a greater potential for truly unhealthy and harmful eating habits in humans than in cattle. For example, Nettleton et al. (2008) found a negative effect of the consumption of processed meat on TL, while Cassidy et al. (2010) found a positive effect of dietary fibre intake78,80. While the two feed groups in the present study differ in energy content as defined in separate feed
experiments on this population81–83, they can both be considered as healthy and fibre rich.
In the analysis of the calf dataset we found a significant relationship between birth weight and RLTL, with heavier calves having shorter telomeres. This is in accordance with the theory that faster body growth requires more cell divisions and, therefore, bigger sized individuals of the same species have shorter telomeres84. However,
it is in contrast to former studies in humans that found no relation of birth weight and TL85,86 or longer telomeres
in bigger and heavier babies87. In our study, birth weight might be confounded with gestation length. Heavier
calves may have been born past their due date and their having shorter telomeres could be a reflection of fast age-dependent telomere depletion before birth which usually happens during the first days of life.
It is not clear if the birth year effect on RLTL in the cow dataset reflects random noise associated with measure-ment error or true biology. Year-dependent changes in weather, food quality or other environmeasure-mental factors may affect RLTL measurements systematically. Birth cohort effects on RLTL have been observed before in wild Soay sheep23 which could support the presence of a true biological effect of birth year on the animals’ RLTL. However,
in contrast to Soay sheep, cattle in our study were born and lived in a controlled environment which makes biological cohort effects less likely. The observation of a potential season effect on RLTL of calves has not been reported before and might be explained by different pregnancy conditions either due to more daylight over the summer months or due to more fresh feed available during the grazing period. Stress88,89 and nutrition90 during
pregnancy have been reported to affect TL in humans and rats respectively. Also, experimentally elevated stress hormones during pregnancy and early post-natal life conditions have been associated with shorter telomeres or faster telomere shortening in birds56,66,91,92. Besides those studies, little is known about factors during pregnancy
and early life that affect the offspring’s TL and more specifically designed studies are required to gain a better understanding. For future studies on RLTL it would be interesting to investigate the possible effect of the dam’s feed group on the calves’ RLTL, which may be associated with the birth season effect. Also, the inclusion of a possible maternal effect in future analyses would be interesting.
No significant association of RLTL either at birth or at one year of age with functional longevity (productive lifespan adjusted for milk yield) was found in the present study. The sample size might have been too small to detect such an effect. However, when we included more animals by investigating productive lifespan as a proxy for functional longevity and by introducing a censoring group in the Cox proportional hazard analysis to include animals that were still alive, we found that animals with the longest telomeres at the ages of one and five years lived significantly longer (p < 0.05). While the result for RLTL at one year remained statistically significant even after employing a Holm-Bonferroni correction53 to account for multiple testing, the result for RLTL at the age
of five years became non-significant, indicating that it may have been caused by a statistical artefact. There was no significant signal for RLTL at birth and other ages. Former studies on the potential value of telomeres as a biomarker for lifespan in humans and laboratory animals have shown mixed results: whilst some studies found a relationship between short telomeres and reduced lifespan or the early onset of age related symptoms and diseases93–95 other studies could not find a relationship42,43,96,97. Two meta-analyses on humans and non-human
vertebrates suggest an overall significant positive relationship between TL and lifespan38,39. In dairy cattle, the
Cows with short telomeres were more likely to be culled within the next year regardless of their age at sampling. It is not clear why we detected an association between TL and productive lifespan at the ages of one (and five years) but not at other ages.
The present study was based on average TL measured with a high-throughput method applicable to a large sample size. Other TL measurement techniques98–100 that allow not only the analysis of average TL but also of the
variance and range of TL in relation to productive lifespan would be useful in future studies. Those studies might find strong relationships between telomere length and productive lifespan, because it is likely that the accumula-tion of very short telomeres within a tissue is problematic for the organism101. However, the current state of
devel-opment of such alternative TL measurement techniques does not allow high-throughput process in a large-scale study like the present one. When these techniques are further developed, future studies can shed more light into TL dynamics, as discussed above. Future studies will also need to investigate the relationship between telomerase expression and productive lifespan in dairy cattle.
In order to clarify if RLTL could be used as a biomarker for breeding for improved productive lifespan it would be interesting to investigate the genetic correlation between RLTL and productive lifespan. Genetic correlations between two traits estimated with bivariate analyses, in contrast to phenotypic correlations estimated in the pres-ent study, will not be affected by environmpres-ent effects and might therefore deliver differpres-ent results.
There is growing interest in the change in TL rather than single measurements at specific ages in association with lifespan. Several studies in birds have indeed shown that the rate of change in TL might be more strongly associated with lifespan than mean TL measurements17,20,55,56. This type of association in dairy cattle warrants
further investigation.
Materials and Methods
Study system and sample selection.
Holstein Friesian dairy cattle used in the present study belong to the herd kept at the Crichton Royal research farm in Dumfries (Scotland) where they are closely monitored and repeatedly sampled for a broad range of scientific studies, including feeding, greenhouse gas emission and genet-ics experiments. Since 1976 two distinct genetic lines are maintained at the farm: a selection (S) line and a control (C) line50. Cows of the S line are amongst the highest yielding dairy cows in the UK, due to a careful selection ofbreeding bulls with the highest genetic merit for total milk, fat and protein production internationally. Cows of the C line have been deliberately kept at an average UK performance level. Animals of the two genetic lines are randomly allocated to two different feeding groups after first calving (calf birth): a high forage (HF) and a low forage (LF) diet group. While the HF group is turned out to the fields during the summer months, the LF group is housed continuously. The LF diet is based on by-products of plants farmed for human consumption and is richer in energy and protein content than the HF diet which is based on farm grown fibre-rich feed. Feeding affects the metabolism and milk yield of a dairy cow: a cow of the S line has a targeted milk yield of 7,500 litres per year when managed on a HF diet and of 13,000 litres per year when managed on a LF diet. The farm keeps 50 milking cows of each genetic and feeding group at all times which makes it ca. 200 milking animals in total. The monitoring of the animals includes regular measurement of milk yield, body condition score, body weight, health events, feed intake, fertility measurements, calving records, productive lifespan measures, reasons for culling etc. Cows stay in the experiment for three lactations or five years. Afterwards, they are transferred to the Acrehead Dairy Unit where they are still used commercially. While the feeding experiment stops at that point and animals are moni-tored less intensively, regular blood samples and basic records are still collected until culling.
Blood sampling and sample selection.
A blood sample archive for the cattle of the Crichton herd was started in 2004 and routine sampling protocols include initial blood sampling within the first two weeks of life and an annual sampling of all animals in spring. When possible, an additional sample is taken close to the animal’s planned culling (removal from the herd). Whole blood samples are taken by venepuncture (V. jugularis for calves and V. coccygealis for adults) and EDTA is used as an anticoagulant. Samples are stored at −30 °C. In the present study we used these blood samples to extract DNA and measure TL of individual animals. In the first instance, we selected 1,336 blood samples from 308 individual cows taken at different ages (cow dataset). Since few samples were collected on these animals within the first year of life, we collected an additional 284 blood samples from 38 female calves over the course of their first year of life, at approximately monthly intervals (calf dataset).Ethics statement.
Blood sampling was approved by the SRUC Animal Experimentation Committee and conducted in accordance with UK Home Office regulations (UK Home Office Project License Number: PPL 60/4278 Dairy Systems, Environment and Nutrition).DNA extraction.
Leukocyte DNA was extracted using spin columns of the DNeasy Blood & Tissue kit (QIAGEN). We followed the manufacturer’s protocol for the extraction from whole blood samples with certain alterations102. DNA yield and purity were measured for each sample on a NanoDrop ND-1000 spectrophotometer(Thermo Scientific) with the software NanoDrop 2000 and the DNA integrity of each sample was tested with gel electrophoresis (as recommended by Kimura et al.99). We processed samples which met the following
require-ments: yield >20 ng/μl, 260/280 ratio >1.7 and 260/230 ratio >1.8, integrity gel score <3 (according to Seeker et al.102). We extracted DNA with acceptable quality from 1,612 out of 1,620 whole blood samples (1,328 samples
belonged to the cow dataset and 284 samples to the calf dataset).
Quantitative polymerase chain reaction (qPCR).
Average RLTL was measured by qPCR103 as describedin Seeker et al.102. Average RLTL is expressed as the amount of telomeric DNA in relation to the amount of a
measurement error and to allow a comparison of RLTL measurements from different qPCR plates. The calibrator sample was extracted using the same protocol as for the samples in the study (QIAGEN Blood & Tissue kit spin columns)102.
The master mixes for the telomere and the reference gene reaction contained 5 μl of LightCycler 480 SYBR Green I Master (Roche) per well. For the telomere amplification, tel 1b (CGG TTT GTT TGG GTT TGG GTT TGG GTT TGG GTT TGG GTT) and tel 2b (GGC TTG CCT TAC CCT TAC CCT TAC CCT TAC CCT TAC CCT)104 primers were used at a concentration of 900 nmol. They were manufactured and purified with high
per-formance liquid chromatography by Integrated DNA Technologies (IDT, Glasgow, UK). For the reference gene amplification beta-2-microglobulin (B2M) primers (Primerdesign, accession code NM_001009284) were used at a concentration of 300 nmol102. Nuclease free water was added to the master mixes to allow for a final volume of
10 μl per qPCR plate well. The reference gene B2M has been previously tested against other candidate genes for a consistent copy number using the qbase+ software by Primerdesign and showed stable qPCR results102. This gene
has been used for RLTL measurement in different ruminant species such as Soay sheep23,105,106, roe deer107 and
Holstein Friesian dairy cattle102.
Samples were randomly allocated to a qPCR plate and well. A 96 well sample plate was loaded prior to loading the qPCR plate with the following (20 μl each): fifty-six DNA samples at a concentration of 1 ng/μl, two replicates of a calibrator at 1 ng/μl, a five step 1:4 serial dilution of golden sample DNA starting with 20 ng/μl and a negative control (nuclease free water).
A liquid handling robot (Freedom Evo-2 150; Tecan, Mannedorf, Switzerland) was used to transfer both mas-ter mixes and the contents of the sample plate in triplicates onto a 384 well plate. The robot mixed 9 μl of the respective master mix with 1 μl of the contents of the sample plate per well.
We used the following qPCR protocol on a LightCycler 480 (Roche): 15 min at 95 °C for enzyme activation followed by 50 cycles of 15 s at 95 °C (denaturation), 30 s at 58 °C (primer annealing) and 30 s at 72 °C (signal acquisition). For the production of the melting curve 1 min at 95 °C was followed by 30 s at 58 °C and a continuous increase of 0.11 °C/s to 95 °C with continuous signal acquisition. The protocol was finalised by a 10 s cool down at 40 °C.
qPCR quality control.
The software package LinReg PCR108 was used for a baseline-correction of theampli-fication curves, the calculation of the plate and reaction specific qPCR efficiency, and the calculation of Cq values. The plate and reaction specific efficiency was calculated by averaging across all well-specific efficiencies of the respective reaction (B2M or telomere reaction) in each plate, after excluding the top and bottom 5%.
The reaction specific efficiencies for all 25 qPCR plates ranged from 94.3% to 94.85% for the B2M reaction and from 91.5–95.85% for the telomere reaction.
For the calculation of Cq values, thresholds were set for all plates within the window of linearity; thresholds were 0.221 for the B2M reaction and 0.256 for the telomere reaction.
Individual samples failed the quality control if the Cq values across their triplicate varied too much (CV >5%). They also failed if the efficiency for at least one copy within the triplicate was 5% higher or lower than the respec-tive mean plate efficiency (across the B2M or telomere reaction).
We ran two triplicates of the calibrator sample on each plate, one located in the middle of the plate and the other at its periphery. For the calibrator sample, Cq values and efficiencies had to meet our quality control criteria calculated over all six wells (both triplicates) per reaction to ensure high intra-plate repeatability.
To test the accuracy of our qPCR assay, we repeated the measurement of an identical qPCR plate four times over two days. Correlation coefficients for all possible plate combinations were high (r = 0.75–0.89) which implies that the rank order of samples stayed similar over all measurements. We fitted a mixed linear model with qPCR plate as fixed effect and sample ID as random effect and calculated a repeatability (variance due to the sample divided by total variance) of 80%.
Samples that failed the post-qPCR quality control (26 in total; 1.55%) were measured again and all passed quality control at the second attempt.
RLTL calculation.
RLTL was calculated using following formula published by Pfaffl109:=
−
−
RLTL E
E (1)
TELCq Cq
B MCq2 Cq
TEL Calibrator TEL Sample
B M Calibrator B M Sample
( ) ( )
2 ( ) 2 ( )
where ETEL and EB2M are the reaction and plate specific qPCR efficiencies, Cq is the number of cycles after which the amplification curve crosses the set fluorescence threshold, CqTEL(Calibrator) and CqB2M(Calibrator) are the Cq values for the calibrator sample for the respective reaction and CqTEL(Sample) and CqB2M(Sample) are the Cq values for the respective reaction of the individual sample.
Statistical analysis.
All RLTL measurements were log transformed to achieve normal distribution (Shapiro-Wilk normality test: W = 0.9985, p-value = 0.2988 and W = 0.9949, p-value = 0.4604 for the cow and the calf datasets respectively).We used mixed models to assess the effect of various factors (including age) on RLTL and to calculate vari-ance components and genetic parameters. We started by fitting a basic model including the animal identity as a random effect and qPCR plate and the sample position on the qPCR plate (row) as fixed effects. Our previous work has shown that the calibrator sample is not sufficient to completely correct for the measurement error that is associated with the qPCR plate102 and therefore we needed to correct for it statistically. Position effects in qPCR
test with one identical sample repeated in all wells that the best way to adjust for the well effect is by fitting the row in which the sample was located in the model as a fixed effect.
Next we investigated RLTL dynamics with age by comparing models that incorporated age fitted in different ways in addition to the factors of the basic model. Linear, quadratic, cubic and quartic polynomial functions of age were fitted and assessed based on their AIC values, because models were non-nested (Table 2). Low AIC values were desirable. Within the range of two units (which is corresponding to an approximate significance of p < 0.05) the simpler model was preferred over the more complicated51,52. Because of a distinct difference in RLTL
measurements between neonates and older animals in the cow dataset, we tested age as a factor with two levels. We computed separate models for all possible points of separation between the age groups (age in months) and then selected the age cut-off that minimised the residual sum of squares (Table S3). For consistency the same procedure was applied to the calf dataset (Table S4). Once we were satisfied with the age term in our models, other factors that might affect RLTL were tested. For the cow dataset we examined the animal’s genetic and feed group, the birth year and the birth season as fixed effects and the animal’s birth weight as covariate. We also included all possible interactions between main effects. We were specifically interested in the interaction of age with the animal’s birth weight, birth year and birth season, because we suspected that those effects might influence RLTL shortly after birth, but probably not later in life. All non-significant factors and interactions (P > 0.05) were back-wards eliminated. The effect size of the age factor in the cow dataset was estimated by calculating Cohen’s D as the mean difference between factor level estimates divided by the standard deviation. The standard deviation was calculated as the product of the standard error and the square root of the sample size. For the calf dataset we examined the following fixed effects: a quadratic function of age in days, the genetic group of the animal, birth weight, birth year, and birth season. Feed group was not tested, because animals of the calf group were too young to have been allocated to a feeding group; the latter usually takes place when the cow gives birth for the first time at about two years of age. We backwards eliminated all non-significant fixed effects with a p-value greater than 0.05. For both datasets, the investigation of the best fitting function of age was repeated with all significant fixed effects in the model.
The final models were used to estimate variance components and genetic parameters based on the principle of restricted maximum likelihood. Animal pedigree information was fitted to the random animal effect enabling the estimation of genetic variance for RLTL. The pedigree included 11,003 animals spread over 27 generations. The animals in the cow dataset were offspring to 40 sires and 241 dams. The animals in the calf dataset were offspring of 7 sires and 35 dams. A random permanent environment effect was also fitted to account for repeated meas-ures within individual animal. The sum of the genetic, permanent environment and residual variances yielded estimates of the total phenotypic variance of RLTL. The ratio of genetic to total phenotypic variance was used to estimate the narrow-sense heritability of the trait. The ratio of the sum of genetic and permanent environment to the total phenotypic variance was used to estimate the repeatability of the trait. The ASReml software112 was used
for the estimation of variance components and calculation of their ratios.
Next, we investigated the association between RLTL and lifespan measurements. We defined “productive lifespan” as the age in days of the animal at culling and functional longevity as productive lifespan corrected for milk yield. To assess the relationship between functional longevity and RLTL we fitted linear models with productive lifespan (normal distributed, Shapiro-Wilk normality test: W = 0.9889, p = 0.31) as response variable and the average milk yield calculated over the cow’s lifetime as fixed effect. We added RLTL measurements that were pre-adjusted for qPCR plate and row as second fixed effect to the model. Because animals had to have both productive lifespan and productivity measurements to be included in the analysis, estimations were based on 143 animals for RLTL at birth and on 136 animals for RLTL at the age of one year only.
We investigated the possibility of analysing productive lifespan as a proxy for functional longevity by testing their correlation, because the analysis of the former would allow us to include animals that died before providing a productivity measurement in our calculations. Also, we introduced a censoring group to account for animals that were still alive and therefore had no productive lifespan measure yet. We used Cox proportional hazard models for the subsequent analyses. These measures increased the sample size to 305 at birth and to 53 at the age of one year. With the Cox proportional hazard analysis we tested the subsequent survival time after sampling at the ages of 0, 1, 2, 3, 4 and 5 years. RLTL measurements were pre-adjusted for qPCR plate and row. Significance of RLTL at test all test ages on productive lifespan was estimated using the Wald test. One might argue that our analysis qualifies to be considered as multiple testing which would require a Bonferroni correction. We therefore used a Holm-Bonferroni correction where the p-value associated with RLTL at the age of one year had to be smaller than 0.05/6 = 0.0083 and the p-value associated with RLTL at the age of five years had to be smaller than 0.05/5 = 0.01 to remain statistically significant53. To visualise the association of TL at the age of one year with
survival probability we repeated the Cox proportional hazard analysis using TL tertiles at this age.
If not stated otherwise, statistical analyses were performed in R studio with R 3.1.3113. Mixed-effects models
were implemented using the ‘lme4’ library. Cox proportional hazard analysis was conducted using the package ‘survival’. The significance threshold for all statistical analyses was set to α= 0.05.
Data availability.
All data are available at https://github.com/LASeeker/Bovine-telomere-dynamics.References
1. Blackburn, E. & Gall, J. A Tandemly Repeated Sequence at the Termini of Extrachromosomal Ribbosomal RNA Genes in Tetrahymena. J. Mol. Biol., 33–53 (1978).
2. De Lange, T. Shelterin: The protein complex that shapes and safeguards human telomeres. Genes Dev. 19, 2100–2110 (2005). 3. Blackburn, E. H. Structure and function of telomeres. Nature 350, 569–73 (1991).
4. Zakian, V. A. Structure and Function of Telomeres. Annu. Rev. Genet. 23, 579–60 (1989).
7. Olovnikov, A. M. A theory of marginotomy. The incomplete copying of template margin in enzymic synthesis of polynucleotides and biological significance of the phenomenon. J. Theor. Biol. 41, 181–190 (1973).
8. Campisi, J. The biology of replicative senescence. Eur. J. Cancer 33, 703–709 (1997).
9. Kim, N. W. et al. Specific association of human telomerase activity with immortal cells and cancer. Science 266, 2011–5 (1994). 10. Wright, W. E., Piatyszek, M. A., Rainey, W. E., Byrd, W. & Shay, J. W. Telomerase activity in human germline and embryonic tissues
and cells. Dev. Genet. 18, 173–179 (1996).
11. Xu, J. & Yang, X. Telomerase activity in bovine embryos during early development. Biol. Reprod. 63, 1124–8 (2000).
12. Hiyama, K. et al. Activation of telomerase in human lymphocytes and hematopoietic progenitor cells. J. Immunol. 155, 3711–3715 (1995).
13. Greider, C. W. & Blackburn, E. H. Identification of a specific telomere terminal transferase activity in Tetrahymena extracts. Cell
43, 405–13 (1985).
14. Bodnar, A. G. et al. Extension of life-span by introduction of telomerase into normal human cells. Science (80-). 279, 349–52 (1998).
15. Milyavsky, M. et al. Prolonged Culture of Telomerase-Immortalized Human Fibroblasts Leads to a Premalignant Phenotype.
Cancer Res. 63, 7147–7157 (2003).
16. López-Otín, C., Blasco, M. A., Partridge, L., Serrano, M. & Kroemer, G. XThe hallmarks of aging. Cell 153 (2013).
17. Barrett, E. L. B., Burke, Ta, Hammers, M., Komdeur, J. & Richardson, D. S. Telomere length and dynamics predict mortality in a wild longitudinal study. Mol. Ecol. 22, 249–259 (2013).
18. Beirne, C., Delahay, R., Hares, M. & Young, A. Age-Related Declines and Disease-Associated Variation in Immune Cell Telomere Length in a Wild Mammal. Plos One 9, e108964 (2014).
19. Aviv, A. et al. Leukocyte telomere dynamics: Longitudinal findings among young adults in the Bogalusa Heart Study. Am. J. Epidemiol. 169, 323–329 (2009).
20. Salomons, H. M. et al. Telomere shortening and survival in free-living corvids. Proc. R. Soc. B Biol. Sci. 276, 3157–3165 (2009). 21. Aubert, G. & Lansdorp, P. M. Telomeres and aging. Physiol. Rev. 88, 557–579 (2008).
22. Frenck, R. W., Blackburn, E. H. & Shannon, K. M. The rate of telomere sequence loss in human leukocytes varies with age. Proc. Natl. Acad. Sci. USA 95, 5607–5610 (1998).
23. Fairlie, J. et al. Lifelong leukocyte telomere dynamics and survival in a free-living mammal. Aging Cell, 140–148, https://doi. org/10.1111/acel.12417 (2015).
24. Baerlocher, G. M., Rice, K., Vulto, I. & Lansdorp, P. M. Longitudinal data on telomere length in leukocytes from newborn baboons support a marked drop in stem cell turnover around 1 year of age. Aging Cell 6, 121–123 (2007).
25. Hall, M. E. et al. Telomere loss in relation to age and early environment in long-lived birds. Proc. Biol. Sci. 271, 1571–1576 (2004). 26. Haussmann, M. F. et al. Telomeres shorten more slowly in long-lived birds and mammals than in short-lived ones. Proc. Biol. Sci.
270, 1387–1392 (2003).
27. Juola, Fa, Haussmann, M. F., Dearborn, D. C. & Vleck, C. M. Telomere shortening in a long-lived bird: cross-sectional analysis and test of an aging tool. Auk 123, 775–783 (2006).
28. Hoelzl, F. et al. Telomeres are elongated in older individuals in a hibernating rodent, the edible dormouse (Glis glis). Sci. Rep. 6, 36856 (2016).
29. Bateson, M. Cumulative stress in research animals: Telomere attrition as a biomarker in a welfare context? BioEssays 38, 201–212 (2016).
30. Monaghan, P., Eisenberg, D. T. A., Harrington, L. & Nussey, D. Understanding diversity in telomere dynamics. Phil. Trans. R. Soc. B 373, 20160435 (2018).
31. Monaghan, P. & Ozanne, S. E. Somatic growth and telomere dynamics in vertebrates: relationships, mechanisms and consequences.
Philos. Trans. R. Soc. B Biol. Sci. 373, 20160446 (2018).
32. Olsson, M., Wapstra, E. & Friesen, C. Ectothermic telomeres: it’s time they came in from the cold. Philos. Trans. R. Soc. Lond. B. Biol. Sci. 373, 20160449 (2018).
33. Aviv, A. & Shay, J. W. Reflections on telomere dynamics and ageing-related diseases in humans. Philos. Trans. R. Soc. Lond. B. Biol. Sci. 373, 20160436 (2018).
34. Risques, R. A. & Promislow, D. E. L. All’s well that ends well: why large species have short telomeres. Philos. Trans. R. Soc. B Biol. Sci. 373, 20160448 (2018).
35. Harrington, L. & Pucci, F. In medio stat virtus: unanticipated consequences of telomere dysequilibrium. Philos. Trans. R. Soc. B Biol. Sci. 373, 20160444 (2018).
36. Young, A. J. The role of telomeres in the mechanisms and evolution of life-history trade-offs and ageing. Philos. Trans. R. Soc. Lond. B. Biol. Sci. 373, 20160452 (2018).
37. Dugdale, H. L., Richardson, D. S. & Richardson, D. S. Heritability of telomere variation: it’s all about the environment! Philos. Trans. R. Soc. B 373, 20160450 (2018).
38. Boonekamp, J. J., Simons, M. J. P., Hemerik, L. & Verhulst, S. Telomere length behaves as biomarker of somatic redundancy rather than biological age. Aging Cell 12, 330–332 (2013).
39. Wilbourn, R. V. et al. The relationship between telomere length and mortality risk in non-model vertebrate systems: a meta-analysis. Phil. Trans. R. Soc. B 373, 20160447 (2018).
40. Heidinger, B. J. et al. Telomere length in early life predicts lifespan. Proc. Natl. Acad. Sci. 109, 1743–1748 (2012). 41. Bakaysa, S. L. et al. Telomere length predicts survival independent of genetic influences. Aging Cell 6, 769–774 (2007). 42. Hovatta, I. et al. Leukocyte telomere length in the Finnish Diabetes Prevention Study. Plos One 7, e34948 (2012).
43. Raymond, A. R., Norton, G. R., Sareli, P., Woodiwiss, A. J. & Brooksbank, R. L. Relationship between average leucocyte telomere length and the presence or severity of idiopathic dilated cardiomyopathy in black Africans. Eur. J. Heart Fail., 5–9, https://doi. org/10.1093/eurjhf/hfs147 (2012).
44. Brown, D. E., Dechow, C. D., Liu, W. S., Harvatine, K. J. & Ott, T. L. Hot topic: Association of telomere length with age, herd, and culling in lactating Holsteins. J. Dairy Sci. 95, 6384–6387 (2012).
45. Garnsworthy, P. C. The environmental impact of fertility in dairy cows: A modelling approach to predict methane and ammonia emissions. Anim. Feed Sci. Technol. 112, 211–223 (2004).
46. Visscher, P., Thompson, R., Yazdi, H. & Hill, W. G. Genetic analysis of longevity data in the UK: present practice and considerations for the future, 16–22 (1999).
47. Pritchard, T., Coffey, M., Mrode, R. & Wall, E. Understanding the genetics of survival in dairy cows. J. Dairy Sci., 1–14, https://doi. org/10.3168/jds.2012-6219 (2013).
48. Schaetzlein, S. et al. Telomere length is reset during early mammalian embryogenesis. Proc. Natl. Acad. Sci. USA 101, 8034–8038 (2004).
49. Miyashita, N. et al. Remarkable Differences in Telomere Lengths among Cloned Cattle Derived from Different Cell Types1. Biol. Reprod. 66, 1649–1655 (2002).
50. Veerkamp, R., Simm, G. & Oldham, J. Effects of interaction between genotype and feeding system on milk production, feed intake, efficiency and body tissue mobilization in dairy cows. Livest. Prod. Sci. 39, 229–241 (1994).
52. Froy, H. et al. Age-related variation in foraging behaviour in the wandering albatross at South Georgia: No evidence for senescence.
Plos One 10, 1–19 (2015).
53. Holm, S. A Simple Sequentially Rejective Multiple Test Procedure. Scand. J. Stat. 6, 65–70 (1979).
54. Rufer, N. et al. Telomere Fluorescence Measurements in Granulocytes and T Lymphocyte Subsets Point to a High Turnover of Hematopoietic Stem Cells and Memory T Cells in Early Childhood. J. Exp. Med 190, 157–167 (1999).
55. Nettle, D. et al. Early-life adversity accelerates cellular ageing and affects adult inflammation: Experimental evidence from the European starling. Sci. Rep. 7(40794), 1–10 (2017).
56. Boonekamp, J., Mulder, G., Salomons, H., Dijkstra, C. & Verhulst, S. Nestling telomere shortening, but not telomere length, reflects developmental stress and predicts survival in wild birds. Proc. R. Soc. B Biol. Sci. 281, 20133287 (2014).
57. Pauliny, A., Wagner, R. H., Augustin, J., Szép, T. & Blomqvist, D. Age-independent telomere length predicts fitness in two bird species. Mol. Ecol. 15, 1681–1687 (2006).
58. Faul, J. D., Mitchell, C. M., Smith, J. A. & Zhao, W. Estimating Telomere Length Heritability in an Unrelated Sample of Adults: Is Heritability of Telomere Length Modified by Life Course Socioeconomic Status? Biodemography Soc. Biol. 62, 73–86 (2016). 59. Njajou, O. T. et al. Telomere length is paternally inherited and is associated with parental lifespan. Proc. Natl. Acad. Sci. USA 104,
12135–9 (2007).
60. Zhu, Y. et al. QTL mapping of leukocyte telomere length in American Indians: The strong heart family study. Aging (Albany. NY).
5, 704–716 (2013).
61. Blackburn, N. B. et al. A retrospective examination of mean relative telomere length in the Tasmanian Familial Hematological Malignancies Study. Oncol. Rep. 33, 25–32 (2015).
62. Hjelmborg, J. B. et al. The heritability of leucocyte telomere length dynamics. J. Med. Genet. 52, 297–302 (2015).
63. Lee, J. H. et al. Genome wide association and linkage analyses identified three loci-4q25, 17q23.2, and 10q11.21-associated with variation in leukocyte telomere length: The long life family study. Front. Genet. 4, 1–13 (2013).
64. Honig, L. S. et al. Heritability of telomere length in a study of long-lived families. Neurobiol. Aging 36, 2785–2790 (2015). 65. Asghar, M. et al. Maternal and genetic factors determine early life telomere length. Proc. R. Soc. B (2015).
66. Voillemot, M. et al. Effects of brood size manipulation and common origin on phenotype and telomere length in nestling collared flycatchers. BMC Ecol. 12, 17 (2012).
67. Reichert, S. et al. Maternal telomere length inheritance in the king penguin. Heredity (Edinb)., 1–7, https://doi.org/10.1038/ hdy.2014.60 (2014).
68. Atema, E. et al. Heritability of telomere length in the Zebra Finch. J. Ornithol. 156, 1113–1123 (2015).
69. Becker, P. J. J. et al. Mother-offspring and nest-mate resemblance but no heritability in early-life telomere length in white-throated dippers. Proc. R. Soc. B Biol. Sci. Early view, https://doi.org/10.1098/rspb.2014.2924 (2015).
70. Lin, K. W. & Yan, J. Endings in the middle: Current knowledge of interstitial telomeric sequences. Mutat. Res. - Rev. Mutat. Res.
658, 95–110 (2008).
71. Mohan, K. N., Rani, B. S., Kulashreshta, P. S. & Kadandale, J. S. Characterization of TTAGG telomeric repeats, their interstitial occurrence and constitutively active telomerase in the mealybug Planococcus lilacinus (Homoptera; Coccoidea). Chromosoma
120, 165–175 (2011).
72. Bolzán, A. D. & Bianchi, M. S. Telomeres, interstitial telomeric repeat sequences, and chromosomal aberrations. Mutat. Res. - Rev. Mutat. Res. 612, 189–214 (2006).
73. Foote, C. G., Vleck, D. & Vleck, C. M. Extent and variability of interstitial telomeric sequences and their effects on estimates of telomere length. Mol. Ecol. Resour. 13, 417–428 (2013).
74. Matsubara, K. et al. No interstitial telomeres on autosomes but remarkable amplification of telomeric repeats on the W sex chromosome in the sand lizard (Lacerta agilis). J. Hered. 106, 753–757 (2015).
75. Ruiz-Herrera, A. et al. Distribution of intrachromosomal telomeric sequences (ITS) on Macaca fascicularis (Primates) chromosomes and their implication for chromosome evolution. Hum. Genet. 110, 578–586 (2002).
76. Haussmann, M. F. & Mauck, R. A. Technical Advances: New strategies for telomere-based age estimation. Mol. Ecol. Resour. 8, 264–74 (2008).
77. Bordone, L. & Guarente, L. Calorie restriction, SIRT1 and metabolism: understanding longevity. Nat. Rev. Mol. Cell Biol. 6, 298–305 (2005).
78. Cassidy, A. et al. Associations between diet, lifestyle factors, and telomere length in. Am. J. Clin. Nutr. 91, 1273–80 (2010). 79. Mirabello, L. et al. The association between leukocyte telomere length and cigarette smoking, dietary and physical variables, and
risk of prostate cancer. Aging Cell 8, 405–413 (2009).
80. Nettleton, J. A., Diez-roux, A., Jenny, N. S., Fitzpatrick, A. L. & D., R. J. Jr. Dietary patterns, food groups, and telomere length in the Multi-Ethnic Study of Atherosclerosis (MESA). Am J Clin Nutr. 88, 1405–12 (2008).
81. Pollott, G. E. & Coffey, M. P. The Effect of Genetic Merit and Production System on Dairy Cow Fertility, Measured Using Progesterone Profiles and On-Farm Recording. J. Dairy Sci. 91, 3649–3660 (2008).
82. Bell, M. J., Wall, E., Russell, G., Morgan, C. & Simm, G. Effect of breeding for milk yield, diet and management on enteric methane emissions from dairy cows. Anim. Prod. Sci. 50, 817 (2010).
83. Ross, S. A., Chagunda, M. G. G., Topp, C. F. E. & Ennos, R. Effect of cattle genotype and feeding regime on greenhouse gas emissions intensity in high producing dairy cows. Livest. Sci. 170, 158–171 (2014).
84. Stindl, R. Tying it all together: Telomeres, sexual size dimorphism and the gender gap in life expectancy. Med. Hypotheses 62, 151–154 (2004).
85. Okuda, K. et al. Telomere length in the newborn. Pediatr. Res. 52, 377–381 (2002).
86. Akkad, A. et al. Telomere length in small-for-gestational-age babies. BJOG An Int. J. Obstet. Gynaecol. 113, 318–323 (2006). 87. de Zegher, F., Díaz, M., Lopez-Bermejo, A. & Ibáñez, L. Recognition of a sequence: More growth before birth, longer telomeres at
birth, more lean mass after birth. Pediatr. Obes., 1–6, https://doi.org/10.1111/ijpo.12137 (2016).
88. Entringer, S. et al. Maternal psychosocial stress during pregnancy is associated with newborn leukocyte telomere length. Am. J. Obstet. Gynecol. 208, 134.e1–134.e7 (2013).
89. Entringer, S. et al. Stress exposure in intrauterine life is associated with shorter telomere length in young adulthood. Proc. Natl. Acad. Sci. 108, E513–E518 (2011).
90. Tarry-Adkins, J. L., Martin-Gronert, M. S., Chen, J.-H., Cripps, R. L. & Ozanne, S. E. Maternal diet influences DNA damage, aortic telomere length, oxidative stress, and antioxidant defense capacity in rats. FASEB J. 22, 2037–2044 (2008).
91. Herborn, K. A. et al. Stress exposure in early post-natal life reduces telomere length: an experimental demonstration in a long-lived seabird. Proc. Biol. Sci. 281, 20133151 (2014).
92. Tissier, M. L., Williams, T. D. & Criscuolo, F. Maternal effects underlie ageing costs of growth in the zebra finch (Taeniopygia guttata). Plos One 9 (2014).
93. van der Harst, P. et al. Telomere length of circulating leukocytes is decreased in patients with chronic heart failure. J. Am. Coll. Cardiol. 49, 1459–64 (2007).
94. Hochstrasser, T., Marksteiner, J. & Humpel, C. Telomere length is age-dependent and reduced in monocytes of Alzheimer patients.
Exp. Gerontol. 47, 160–163 (2011).
96. Martin-Ruiz, C. M., Gussekloo, J., van Heemst, D., von Zglinicki, T. & Westendorp, R. G. J. Telomere length in white blood cells is not associated with morbidity or mortality in the oldest old: A population-based study. Aging Cell 4, 287–290 (2005).
97. Bischoff, C. et al. No Association Between Telomere Length and Survival Among the Elderly and Oldest Old. Epidemiology 17, 190–194 (2006).
98. Baird, D. M., Rowson, J., Wynford-Thomas, D. & Kipling, D. Extensive allelic variation and ultrashort telomeres in senescent human cells. Nat. Genet. 33, 203–7 (2003).
99. Kimura, M. et al. Measurement of telomere length by the Southern blot analysis of terminal restriction fragment lengths. Nat. Protoc. 5, 1596–1607 (2010).
100. Nussey, D. H. et al. Measuring telomere length and telomere dynamics in evolutionary biology and ecology. Methods Ecol. Evol. 5, 299–310 (2014).
101. Hemann, M. T., Strong, M. A., Hao, L. Y. & Greider, C. W. The shortest telomere, not average telomere length, is critical for cell viability and chromosome stability. Cell 107, 67–77 (2001).
102. Seeker, L. A. L. A. et al. Method specific calibration corrects for DNA extraction method effects on relative telomere length measurements by quantitative PCR. Plos One 11, 1–15 (2016).
103. Cawthon, R. M. Telomere measurement by quantitative PCR. Nucleic Acids Res. 30, e47 (2002).
104. Epel, E. S. et al. Accelerated telomere shortening in response to life stress. Proc. Natl. Acad. Sci. 101, 17312–17315 (2004). 105. Froy, H. et al. No evidence for parental age effects on offspring leukocyte telomere length in free-living Soay sheep. Sci. Rep. 7, 1–9
(2017).
106. Watson, R. L. et al. Sex differences in leucocyte telomere length in a free-living mammal. Mol. Ecol. 26, 3230–3240 (2017). 107. Wilbourn, R. V. et al. Age-dependent associations between telomere length and environmental conditions in roe deer. Biol. Lett.
13, 20170434 (2017).
108. Ruijter, J. M. et al. Amplification efficiency: linking baseline and bias in the analysis of quantitative PCR data. Nucleic Acids Res. 37, e45 (2009).
109. Pfaffl, M. W. A new mathematical model for relative quantification in real-time RT–PCR. Nucleic Acids Res. 29, e45 (2001). 110. Eisenberg, D. T. A., Kuzawa, C. W. & Hayes, M. G. Improving qPCR telomere length assays: Controlling for well position effects
increases statistical power. Am. J. Hum. Biol. 27, 570–575 (2015).
111. Kibriya, M. G., Jasmine, F., Roy, S., Ahsan, H. & Pierce, B. L. Novel Luminex Assay for Telomere Repeat Mass Does Not Show Well Position Effects Like qPCR. Plos One 11, 1–15 (2016).
112. Gilmour, A. R., Gogel, B. J., Cullis, B. R. & Thompson, R. ASReml User Guide Release 3.0 VSN (2009).
113. R Core Team. R: A language and environment for statistical computing. R Foundation for Statistical Computing, Vienna, Austria,
www.R-project.org/ (2013).
Acknowledgements
We thank everyone involved in collecting blood samples on the Crichton farm, particularly Hannah Dykes and Isla McCubbin. We also thank Ian Archibald for support with sample and data handling. The work was funded by a PhD scholarship to the first author offered by Scotland’s Rural College (http://www.sruc.ac.uk/) and the Biotechnology and Biological Sciences Research Council (BB/L007312/1; http://www.bbsrc.ac.uk/), and the Rural & Environment Science & Analytical Services Division of the Scottish Government. We thank the scientific reviewers for their thorough reading and helpful comments that improved the manuscript considerably.
Author Contributions
A.B. collected samples on the farm. L.S., S.U., R.W., J.F. and R.H. extracted DNA and performed quality control checks. Together with E.S.C. they measured RLTL by qPCR. L.S., S.U., R.W. and J.F. performed post qPCR quality controls and were together with J.I. responsible for the data curation. The statistical analysis was performed by L.S. with support from J.I., A.P. and H.F. and under supervision of G.B. and D.N. L.S. visualised data and drafted the first manuscript. G.B. and D.N. reviewed and edited the first draft. All authors reviewed and edited the final draft. G.B., D.N., M.C. and B.W. supervised the project and acquired funding. All the authors were involved in project planning. G.B. was the project principal investigator.
Additional Information
Supplementary information accompanies this paper at https://doi.org/10.1038/s41598-018-31185-z. Competing Interests: The authors declare no competing interests.
Publisher's note: Springer Nature remains neutral with regard to jurisdictional claims in published maps and institutional affiliations.
Open Access This article is licensed under a Creative Commons Attribution 4.0 International License, which permits use, sharing, adaptation, distribution and reproduction in any medium or format, as long as you give appropriate credit to the original author(s) and the source, provide a link to the Cre-ative Commons license, and indicate if changes were made. The images or other third party material in this article are included in the article’s Creative Commons license, unless indicated otherwise in a credit line to the material. If material is not included in the article’s Creative Commons license and your intended use is not per-mitted by statutory regulation or exceeds the perper-mitted use, you will need to obtain permission directly from the copyright holder. To view a copy of this license, visit http://creativecommons.org/licenses/by/4.0/.