Advanced respiratory monitoring in COVID-19 patients: Use less PEEP!
Lisanne Roesthuis1, Maarten van den Berg1, Hans van der Hoeven1
1 Department of Intensive Care Medicine, Radboud University Medical Center, Nijmegen, The
Netherlands
Correspondence:
Lisanne Roesthuis, MSc
Geert Grooteplein-Zuid 10
6525 GA Nijmegen, The Netherlands
Lisanne.Roesthuis@Radboudumc.nl
Introduction
With the emergence of Coronavirus disease 2019 (COVID-19) we are confronted with
a new clinical picture of acute respiratory distress syndrome (ARDS) in the intensive care unit
(ICU). Although patients with COVID-19 who are admitted to the ICU respond well to
ventilation with high positive end-expiratory pressure (PEEP), we see in the majority of
patients, that respiratory mechanics are very different from the “normal” ARDS patient (1). In
patients with COVID-19 plateau pressures and driving pressures are often low and respiratory
system compliance relatively normal compared to the ARDS patient (2). Many physicians use
high PEEP for patients with COVID-19 although the potential for recruitment is often low (3).
We fear that the high compliance of the respiratory system in combination with high PEEP will
lead to hyperinflation, high dead space and potentially right ventricular failure. We have
implemented the following strategy for all our COVID-19 patients (N = 45): after intubation we
use a tidal volume of 6 ml/kg predicted body weight and immediately prone our patients for
at least 3 days. We use the lowest possible PEEP to obtain adequate oxygenation with a FiO2
of 50%. We increase PEEP according to the low PEEP/FiO2 table when FiO2 has to increase. We
measured transpulmonary pressure and dead space ventilation to assess the effects of high
and low PEEP levels on lung compliance and ventilation-perfusion mismatching.
Methods
Respiratory mechanics was assessed in COVID-19 patients admitted to the Radboud
University Nijmegen Medical Center as part of standard patient care. Brief occlusions were
performed to assess end-inspiratory and end-expiratory airway and transpulmonary pressures
and to calculate driving pressures and respiratory and lung compliances as previously
calculated using the elastance ratio method, in prone position absolute transpulmonary
pressures were used (6). Dead space ventilation was assessed using two methods:
1) The Bohr equation using partial pressure of carbon dioxide in alveolar air (PACO2)
and mixed expired air (PeCO2): (PACO2 – PeCO2) / PACO2. Both parameters were obtained by
measuring flow and carbon dioxide tension (PCO2) using the NICO capnograph (Philips
Respironics, Murrysville, PA, USA). See our previous work for detailed description (7). Offline
analysis was performed using MATLAB 2018a (MathWorks, Natick, MA, USA) using a method
developed by Tusman and colleagues (8).
2) The Enghoff modification of Bohr’s equation using partial pressure of carbon dioxide
in arterial blood (PaCO2) instead of PACO2: (PaCO2 – PeCO2) / PaCO2. Therefore, shunt and
diffusion limitations are taken into the equation. PeCO2 was obtained with volumetric
capnography.
In addition, the ventilatory ratio was assessed as a simple bedside measure of
ventilation correlating with physiological dead space fraction. It was computed as: (minute
ventilation * PaCO2) / (predicted body weight * 100 * 37.5) (9). In a few patients we assessed
the effects of different positive end-expiratory pressure (PEEP) levels on these parameters.
Results
Advanced respiratory mechanics was assessed in 14 patients (8 males and 6 females,
age (mean ± SEM) 67 ± 2 years, body mass index 28.0 ± 0.9 kg/m2) between the 19th of March
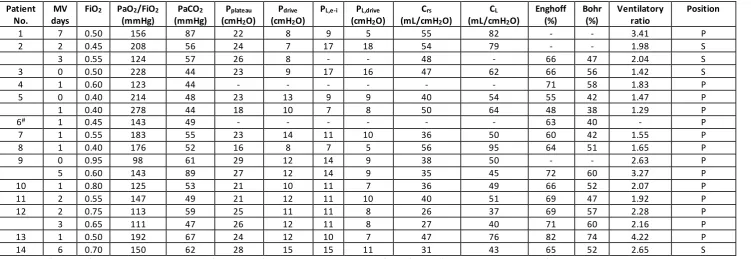
and 2nd of April. Respiratory parameters are shown in Table 1. Compliance of the respiratory
system was low (42 ± 3 mL/cmH2O) due to a lower than normal lung compliance (61 ± 5
mL/cmH2O). However, compared to ARDS patients lung compliance was relatively high,
had high dead space ventilation and gas exchange impairment (Bohr 52 ± 3%; Enghoff
modification 67 ± 2%; ventilatory ratio 2.24 ± 0.23). Patient 14 had very high dead space
ventilation, underwent CT-a and turned out to have pulmonary embolism.
Reducing PEEP resulted in an increase in lung compliance and decrease in dead space
ventilation, except for patient 1 (Figure 1).
Discussion
We demonstrate that mechanically ventilated patients with COVID-19 have a relatively
high lung compliance, high dead space ventilation and gas exchange impairment. In almost all
patients lung compliance decreased with increasing PEEP levels. Dead space ventilation
according to Bohr increased in all patients and according to Enghoff modification increased in
6/9 patients with increasing PEEP levels, albeit by a small amount.
The decrease in lung compliance and increase in dead space ventilation in response to
higher PEEP levels indicate that COVID-19 lesions were not recruited and that higher PEEP
levels cause hyperinflation of the more compliant parts of the lung. These results are in
accordance with recent findings in COVID-19 patients. Pan et al. (3) found that the majority of
patients had low recruitability with high PEEP levels. Recruitability seemed to improve with
alternating body position (i.e. from supine to prone position). Liu et al. (10) computed the
ventilatory ratio as a measure of ventilatory efficiency. They found a high ventilatory ratio in
hypercapnic COVID-19 patients, which decreased when tidal volume was increased from 7 ±
0.6 to 7.7 ± 0.6 mL/kg. We found that the ventilatory ratio increased in accordance with
Enghoff modification (not Bohr) in response to higher PEEP levels.
When lung compliance increases in response to higher PEEP levels (patient 1),
Conclusions
In conclusion, we show that higher PEEP levels decrease lung compliance and in most
cases increase dead space ventilation, indicating that high PEEP levels probably cause
hyperinflation in patients with COVID-19. We suggest using prone position for an extended
References
1. Gattinoni L, Taccone P, Carlesso E, Marini JJ. Prone position in acute respiratory distress
syndrome. Rationale, indications, and limits. American journal of respiratory and
critical care medicine 2013; 188: 1286-1293.
2. Gattinoni L, Coppola S, Cressoni M, Busana M, Chiumello D. Covid-19 Does Not Lead to a
"Typical" Acute Respiratory Distress Syndrome. American journal of respiratory and
critical care medicine 2020.
3. Pan C, Chen L, Lu C, Zhang W, Xia JA, Sklar MC, Du B, Brochard L, Qiu H. Lung Recruitability
in SARS-CoV-2 Associated Acute Respiratory Distress Syndrome: A Single-center,
Observational Study. American journal of respiratory and critical care medicine 2020.
4. Akoumianaki E, Maggiore SM, Valenza F, Bellani G, Jubran A, Loring SH, Pelosi P, Talmor D,
Grasso S, Chiumello D, Guerin C, Patroniti N, Ranieri VM, Gattinoni L, Nava S, Terragni
PP, Pesenti A, Tobin M, Mancebo J, Brochard L, Group PW. The application of
esophageal pressure measurement in patients with respiratory failure. American
journal of respiratory and critical care medicine 2014; 189: 520-531.
5. Mauri T, Yoshida T, Bellani G, Goligher EC, Carteaux G, Rittayamai N, Mojoli F, Chiumello D,
Piquilloud L, Grasso S, Jubran A, Laghi F, Magder S, Pesenti A, Loring S, Gattinoni L,
Talmor D, Blanch L, Amato M, Chen L, Brochard L, Mancebo J, Group PLpw. Esophageal
and transpulmonary pressure in the clinical setting: meaning, usefulness and
perspectives. Intensive care medicine 2016; 42: 1360-1373.
6. Yoshida T, Amato MBP, Grieco DL, Chen L, Lima CAS, Roldan R, Morais CCA, Gomes S, Costa
ELV, Cardoso PFG, Charbonney E, Richard JM, Brochard L, Kavanagh BP. Esophageal
Manometry and Regional Transpulmonary Pressure in Lung Injury. American journal of
7. Doorduin J, Nollet JL, Vugts MP, Roesthuis LH, Akankan F, van der Hoeven JG, van Hees HW,
Heunks LM. Assessment of dead-space ventilation in patients with acute respiratory
distress syndrome: a prospective observational study. Crit Care 2016; 20: 121.
8. Tusman G, Scandurra A, Bohm SH, Suarez-Sipmann F, Clara F. Model fitting of volumetric
capnograms improves calculations of airway dead space and slope of phase III. J Clin
Monit Comput 2009; 23: 197-206.
9. Sinha P, Fauvel NJ, Singh S, Soni N. Ventilatory ratio: a simple bedside measure of
ventilation. Br J Anaesth 2009; 102: 692-697.
10. Liu X, Liu X, Xu Y, Xu Z, Huang Y, Chen S, Li S, Liu D, Lin Z, Li Y. Ventilatory Ratio in
Hypercapnic Mechanically Ventilated Patients with COVID-19 Associated ARDS.
Figure legends
Figure 1 The effects of increasing positive end-expiratory pressure (PEEP) on lung compliance (N = 9) and dead space ventilation (N = 9). A Lung compliance decreased with increasing PEEP levels in 8 patients. B Dead space ventilation according to Bohr increased in all patients with increasing PEEP levels. C In response to higher PEEP levels dead space ventilation according to Enghoff modification (global gas exchange impairment) increased in 3 patients, first decreased
and then increased in 3 patients, decreased in 2 patients and had no effect in 1 patient. D The ventilatory ratio could be determined in 8 patients and showed a similar trend as Enghoff
Tables
Table 1
Table 1 Respiratory mechanics
Crs = compliance of respiratory system; CL = lung compliance; MV days = days of mechanical ventilation at time of measurement; PL,e-i = end-inspiratory transpulmonary pressure; PL,drive = transpulmonary driving pressure; P = prone position; S = supine position.
#Patient ventilated in pressure support mode, therefore the ventilatory ratio could not be determined.
Patient No.
MV days
FiO2 PaO2/FiO2
(mmHg)
PaCO2
(mmHg)
Pplateau
(cmH2O)
Pdrive
(cmH2O)
PL,e-i PL,drive
(cmH2O)
Crs
(mL/cmH2O)
CL
(mL/cmH2O)
Enghoff (%) Bohr (%) Ventilatory ratio Position
1 7 0.50 156 87 22 8 9 5 55 82 - - 3.41 P
2 2 0.45 208 56 24 7 17 18 54 79 - - 1.98 S
3 0.55 124 57 26 8 - - 48 - 66 47 2.04 S
3 0 0.50 228 44 23 9 17 16 47 62 66 56 1.42 S
4 1 0.60 123 44 - - - 71 58 1.83 P
5 0 0.40 214 48 23 13 9 9 40 54 55 42 1.47 P
1 0.40 278 44 18 10 7 8 50 64 48 38 1.29 P
6# 1 0.45 143 49 - - - - - - 63 40 - P
7 1 0.55 183 55 23 14 11 10 36 50 60 42 1.55 P
8 1 0.40 176 52 16 8 7 5 56 95 64 51 1.65 P
9 0 0.95 98 61 29 12 14 9 38 50 - - 2.63 P
5 0.60 143 89 27 12 14 9 35 45 72 60 3.27 P
10 1 0.80 125 53 21 10 11 7 36 49 66 52 2.07 P
11 2 0.55 147 49 21 12 11 10 40 51 69 47 1.92 P
12 2 0.75 113 59 25 11 11 8 26 37 69 57 2.28 P
3 0.65 111 47 26 12 11 8 27 40 71 60 2.16 P
13 1 0.50 192 67 24 12 10 7 47 76 82 74 4.22 P
Figure 1
6 8 10 12 14 16 18 20 0 30 40 60 80 100 2 1 5 7 8 10 11 12 14
PEEP level (cmH2O)
L u n g c o m p li a n c e ( m L /c m H2 O)
6 8 10 12 14 16 18 20 -10 -5 0 5 10 5 4 6 7 8 10 11 12 14
PEEP level (cmH2O)
Ch a n g e Bo h r (% )
6 8 10 12 14 16 18 20 -10 -5 0 5 10 5 4 6 7 8 10 11 12 14
PEEP level (cmH2O)
Ch a n g e E n g h o ff m o d if ic a ti o n ( % )
6 8 10 12 14 16 18 20 -20 -10 0 10 4 5 7 8 10 11 12 14
PEEP level (cmH2O)