Contents lists available atScienceDirect
NeuroImage: Clinical
journal homepage:www.elsevier.com/locate/ynicl
Grey matter volume and cortical structure in Prader-Willi syndrome
compared to typically developing young adults
Katherine E. Manning
a,⁎, Roger Tait
a, John Suckling
a, Anthony J. Holland
a,b,caDepartment of Psychiatry, University of Cambridge, Cambridge, UK bCambridgeshire and Peterborough NHS Foundation Trust, UK
cNational Institute for Health Research (NIHR) Collaborations for Leadership in Applied Health Care Research and Care (CLAHRC), East of England, UK
A R T I C L E I N F O
Keywords:
Prader-Willi syndrome Grey matter
Multiparameter mapping Myelination
Cortical thickness Genomic imprinting
A B S T R A C T
Prader-Willi syndrome (PWS) is a neurodevelopmental disorder of genomic imprinting, presenting with a characteristic overeating disorder, mild to moderate intellectual disability, and a variable range of social and behavioral difficulties. Consequently, widespread alterations in neural structure and developmental and maturational trajectory would be expected. To date, there have been few quantitative and systematic studies of brain morphology in PWS, although alterations of volume and of cortical organisation have been reported. This study aimed to investigate, in detail, the structure of grey matter and cortex in the brain in a sample of young adults with PWS in a well-matched case-controlled analysis. 20 young adults with PWS, aged 19–27 years, underwent multiparameter mapping magnetic resonance imaging sequences, from which measures of grey matter volume, cortical thickness and magnetisation transfer sa-turation, as a proxy measure of myelination, were examined. These variables were investigated in comparison to a control group of 40 typically developing young adults, matched for age and sex. A voxel-based morphometry analysis identified large and widespread bilateral clusters of both increased and decreased grey matter volume in the brain in PWS. In particular, widespread areas of increased volume encompassed parts of the prefrontal cortex, especially medially, the majority of the cingulate cortices, from anterior to posterior aspects, insula cortices, and areas of the parietal and temporal cortices. Increased volume was also reported in the caudate, putamen and thalamus. The most ventromedial prefrontal areas, in contrast, showed reduced volume, as did the parts of the medial temporal lobe, bilateral temporal poles, and a small cluster in the right lateral prefrontal cortex. Analysis of cortical structure revealed that areas of increased volume in the PWS group were largely driven by greater cortical thickness. Conversely, analysis of myelin content using magnetisation transfer saturation indicated that myelination of the cortex was broadly similar in the PWS and control groups, with the exception of highly localised areas, including the insula. The bilateral nature of these abnormalities suggests a systemic biological cause, with possible developmental and maturational mechanisms discussed, and may offer insight into the contribution of imprinted genes to neural development.
1. Introduction
Prader-Willi syndrome (PWS) is a neurodevelopmental disorder af-fecting around 1 in 25,000–29,000 births (Whittington et al., 2001; Smith et al., 2003). PWS arises due to the evolutionary phenomenon of gender of origin specific genomic imprinting, whereby specific genes are programmed to be silent or expressed according to the chromo-some's maternal or paternal origin. In PWS there is a failure of paternal expression of maternally imprinted genes at chromosomal locus 15q11-13 (the PWS critical region), with almost all cases accounted for by one
of three genetic events: deletion of the critical region on the paternal chromosome (c. 70%); maternal uniparental disomy of chromosome 15 (UPD; c. 25%); or an imprinting centre defect (< 5%) (Bittel and Butler, 2005). The common result of all genetic causes is the loss of expression of the paternal alleles of maternally imprinted genes in this critical region.
PWS presents with a characteristic, although variable, profile (Holm et al., 1993). Most prominently, infants are born with severe hypotonia (low muscle tone) and show an initial failure to thrive, which is re-placed during preschool years by an insatiable appetite, necessitating
https://doi.org/10.1016/j.nicl.2017.12.027
Received 30 October 2017; Received in revised form 14 December 2017; Accepted 19 December 2017
⁎Corresponding author at: CIDDRG, Department of Psychiatry, University of Cambridge, Douglas House, 18b Trumpington Road, Cambridge CB2 8AH, UK.
E-mail address:[email protected](K.E. Manning).
Abbreviations:ANTS, Advanced Normalisation Tools Software; ACC, anterior cingulate cortex; BMI, body mass index; CamBA, Cambridge Brain Analysis software; TE, echo time; FA,flip angle; GLM, general linear model; GM, grey matter; IQ, intelligence quotient; MRI, magnetic resonance imaging; MPM, multiparameter mapping; MT, magnetisation transfer; NHS, National Health Service; NSPN, NeuroScience in Psychiatry Network; OFC, orbitofrontal cortex; PWS, Prader-Willi syndrome; PWSA UK, Prader-Willi Syndrome Association UK; PFC, prefrontal cortex; PD, proton density; TR, repetition time; TIV, total intracranial volume; UPD, uniparental disomy; WM, white matter
Available online 20 December 2017
2213-1582/ © 2017 The Authors. Published by Elsevier Inc. This is an open access article under the CC BY-NC-ND license (http://creativecommons.org/licenses/BY-NC-ND/4.0/).
external restriction of food and commonly resulting in life-threatening obesity if such restrictions are not in place. Relative growth and sex hormone deficiencies mean that short stature is common, sexual de-velopment is disrupted, and a typical facial phenotype is often present. These characteristics strongly suggest a disorder of hypothalamic con-trol. However, beyond these core features, PWS is also associated with mild to moderate intellectual disability, a high pain threshold and a variable range of social and behavioral difficulties, including temper outbursts, need for routine, skin picking, repetitive and ritualistic be-haviours, and poor social functioning, as well as propensity to psy-chiatric disturbance (Dykens and Kasari, 1997; Clarke et al., 2002; Holland et al., 2003).
These diverse phenotypic effects indicate a widespread atypical pattern of development of the PWS brain. However, whilst the char-acterisation of PWS at the cognitive and behavioral level has received considerable attention, a recent systematic review highlighted the lack of comprehensive or systematic study and consensus at the neural level (Manning and Holland, 2015), with the notable exception of the eating behavior which has been associated with aberrant central satiety re-sponses (e.g.Hinton et al., 2006; Holsen et al., 2006). In particular, few systematic and quantitative studies of neural morphology in PWS were identified, although a number of case studies and other studies using more qualitative measurement or categorisation of regions of interest have suggested diffuse abnormalities, particularly in frontal and wider cortical regions, when focus was not restricted to the hypothalamic pituitary area. Functional studies also indicate aberrant activity in si-milar areas, both in response to tasks and resting state, especially im-plicating regions of the cortico-striatal-thalamic loops involved in cognition, motivation and emotional regulation over behavioral control (e.g.Hinton et al., 2006; Holsen et al., 2006; Kim et al., 2006; Miller et al., 2007; Woodcock et al., 2010). Considering quantitative structural investigations of grey matter (GM) in PWS,Ogura et al. (2011)reported reduced total GM volume, and particular reductions in orbitofrontal cortex (OFC) and somatomotor areas, in a voxel-based morphometry (VBM) study comparing 12 participants with PWS to age and sex-matched control participants. Abnormal cortical gyrification with re-duced cortical complexity particularly in frontal areas, including the insula and cingulate regions, as well as in parietal and temporal cortices has also been reported, alongside reduced total cortical surface area in children with PWS compared to sibling controls (Lukoshe et al., 2013; Lukoshe et al., 2014). Most recently,Xu et al. (2017)reported reduced total cortical volume and reductions in the medial prefrontal cortex (PFC), dorsolateral PFC, right anterior cingulate cortex (ACC) and in temporal and occipital areas in children with PWS compared to healthy controls, however these alterations were also seen in a highly obese group.
Given the few systematic and quantitative investigations of the PWS brain, this analysis aims to explore neuroanatomy at the level of a whole brain exploratory analysis. Voxel-based morphometry analyses enable comparison of GM volume across the whole brain in different populations using fully automated processes. In addition to in-vestigating GM volume in PWS, this study also considers cortical structure and, in particular, how cortical structure may be involved in differences in GM volume. The aim of this study was to address the paucity of systematic and quantitative investigations into the structure of the brain in vivo in PWS cross-sectionally compared to a well-mat-ched control group. In doing so, this data-driven analysis approach, unrestricted by anatomical boundaries, conducted within one of the largest PWS neuroimaging cohorts to date and confined to young adults, aims to address a number of the potential confounds implicated in previous conflictingfindings.
2. Methods
Ethical approval was granted by the National Health Service (NHS) National Research Ethics Service (13/EE/0373) and relevant NHS and
university research and development approvals were obtained.
2.1. Participants
Twenty-six young adults, meeting the study criteria of being aged between 18 and 28 years and with a genetic diagnosis of PWS, were recruited from across England via the Prader-Willi Syndrome Association UK (PWSA UK), residential home providers and NHS clin-icians. This represents approximately 14.5% of all adults aged 18–28 years with PWS in England, estimated according to the pre-valence known to the PWSA UK. Only those with capacity to consent, assessed in accordance with Section 3 of the UK Mental Capacity Act 2005, were eligible to participate. Of these 26 participants, six failed to complete the magnetic resonance imaging (MRI) assessments. Consequently, thefinal sample comprised 20 people with PWS.
Forty control participants, matched to the PWS participants for age and sex in a two-to-one fashion, were included in the study. Typically devel-oping participants aged 18–24 years were recruited and tested as part of the NeuroScience in Psychiatry Network (NSPN) U-Change project, en-abling the selection of age and sex-matched controls. Control participants aged 24–28 years were additionally recruited from the local population. For sex, matching was possible for all except one male with PWS who was matched to two control females. The majority of participants with PWS were matched with two control participants within six months of their age; the maximum age difference was 2.25 years. It was not possible to match for BMI and IQ owing to the association of PWS with these variables and a characteristic part of how people with PWS typically differ from the ty-pically-developing population.
Exclusion criteria for both groups were standard MRI safety exclu-sion criteria or inability to tolerate the MRI environment, history of neurological disorder or trauma, and current or recent (within 12 months) participation in a clinical trial of a medicinal product. For the control group, this additionally included current treatment for a psychiatric disorder or drug or alcohol dependence and intellectual disability requiring educational support or treatment. For the PWS group, the presence of a current psychiatric disorder disrupting com-pliance with study demands also precluded participation.
2.2. Clinical, genetic and cognitive characteristics
History of growth and sex hormone treatment and medications for the PWS group were given by participants with PWS, their parents and carers. For those with PWS, genetic diagnosis of subtype was obtained via medical records where available or confirmed using saliva or blood samples. Height and weight was recorded for all participants at the scan visit.
IQ in the PWS group was assessed via administration of the com-plete Wechsler Adult Intelligence Scales Fourth Edition (WAIS-IV; Wechsler, 2008). The control group completed only the vocabulary and matrix reasoning subtests from the Wechsler Abbreviated Scale of In-telligence Second Edition (WASI-II;Wechsler, 2011), a shortened ver-sion of the WAIS.
2.3. Magnetic resonance imaging protocol
Participants underwent an multiparameter mapping sequence (MPM) allowing fast high resolution whole brain T1, T2*, proton density (PD) and magnetisation transfer (MT) mapping, thus assessing parameters sensitive to iron concentration, water content and myeli-nation as well as more traditional anatomical MRI data. As described in more detail by Draganski et al. (2011), the MPM imaging protocol consisted of T1-weighted, PD-weighted and MT-weighted sequence and twofield map sequences. The analyses reported here are carried out on the R1 (1/T1) data from the T1-weighted sequence and the MT sa-turation images from the MT sequence.
with a 20°flip angle (FA), and 23.70 ms for the MT sequence with a 6° FA. All other parameters were the same for both sequences: multi-echo time (TE) contrasts (2.20 ms, 4.70 ms, 7.20 ms, 9.70 ms, 12.20 ms, 14.40 ms),field of view = 256 mm, 176 × 1 mm slices. Scan duration was approximately 20 min.
2.4. Preprocessing
Background noise outside the head was removed by creating a head mask using the PD-weighted image and orienting the R1 and MT images to standard MNI alignment, before aligning the R1 and MT images to the PD-weighted image and zeroing all data points outside this head mask region on all scans. Further preprocessing of the data was carried out using the Advanced Normalisation Tools Software 1.9.v4 (ANTS; Avants et al., 2011).
2.4.1. GM volumetric maps
A study specific template for segmentation and normalisation was created using the R1 data from the 20 PWS participants and one of the matched control participants for each PWS participant (randomly se-lected), using the buildtemplateparallel process of the ANTS software package. This was skull stripped, then segmented to produce template specific tissue priors to guide the segmentation of the subject R1 images. Specifically, the template was segmented into 5 tissue priors: cerebrospinal fluid, cortical GM, white matter (WM) deep GM and cerebellum. The subject R1 images were then processed using the antsCorticalThicknesspipeline (ANTS), which extracts the brain, warps the tissue priors and segments the subject images into the five tissue images in subject space. Cortical, subcortical and cerebellar segmen-tations were combined to produce a GM image for each subject. These GM images were then warped to normalise them to the study specific template and modulated by the Jacobian warp parameters, in order to preserve the quantitative voxel values, before the data was smoothed using a sigma 3 kernel. These normalised, modulated, and smoothed GM images were then analysed using a VBM approach with a general linear model (GLM).
2.4.2. Cortical thickness maps
The antsCorticalThickness pipeline also produced cortical thickness maps in subject space, using a diffeomorphic registration based cortical thickness (DiReCT) measure (Das et al., 2009). The subject space cortical thickness maps and the subject space cortical GM masks created during tissue segmentation were warped into template space and smoothed using a sigma 3 kernel. The warped, smoothed cortical thickness maps were divided by the smoothed, warped cortical GM mask images to account for the effects of smoothing. Finally, voxels outside of cortical GM space were removed using the cortical tissue prior mask.
2.4.3. MT saturation maps
The subject space MT maps were warped to the study specific template space using the same transformations used to warp the cortical thickness maps into template space, and then multiplied by the cortical GM prior mask to remove voxels outside of the cortical GM.
2.5. Statistical analyses
Basic demographic data were analysed using SPSS (IBM Corp.). Extraction of global or cluster level volume, cortical thickness and MT data was performed using MATLAB (The Mathworks, Inc.) as described below, with analyses of extracted data conducted in SPSS. Voxel-wise analyses were carried out using Cambridge Brain Analysis software version 2.3.0 (CamBA; Brain Mapping Unit, University of Cambridge; Bullmore et al., 1999).
2.5.1. Global measures of volume
Total intracranial volume (TIV), cerebellar GM volume and GM
cortical and subcortical volume (i.e. excluding the cerebellum) were compared between groups, prior to more detailed morphological comparisons. Differences in cerebellar volumes between the PWS and control groups were not investigated at finer resolutions, thus re-stricting analyses of morphology to cortical and subcortical GM and limiting the number of voxel-wise comparisons performed.
2.5.2. Voxel-based morphometry (VBM)
A voxel-based morphometry analysis of all cortical and subcortical GM was conducted to identify areas showing anatomical abnormality of GM volume in the PWS group compared to the control group. CamBA version 2.3.0 was used to conduct the VBM analysis on the warped, modulated, smoothed GM data in template space, with a mask com-prising cortical and subcortical GM used to restrict the area of analysis. A GLM was used, comparing the PWS group with the typically devel-oping control group as the main effect of interest, with TIV included as a nuisance covariate. Since participants were well matched for age and sex in the PWS and control groups, the statistical models were thus kept as simple as possible. Significant areas of difference identified using clusterwise testing are reported at the corrected significance level for multiple comparisons. The significant cluster map image was trans-formed from study template space to Montreal Neurological Institute (MNI) space in order to report peak cluster results.
2.5.3. Cortical thickness
Mean cortical thickness for the whole brain was extracted from the cortical thickness maps using MATLAB. Between-group comparisons were conducted for global mean cortical thickness.
A whole cortex voxel-wise analysis of cortical thickness was carried out on the normalised and smoothed cortical thickness maps in tem-plate space, using CamBA version 2.3.0, in order to investigate potential mechanisms driving atypicalities identified by the VBM analysis. A mask of cortical GM space, created from the cortical GM prior, was used to restrict the area for analysis to cortical GM space. A GLM was used, comparing the PWS group with the control group. TIV has not been shown to have a direct linear relationship with cortical thickness in the way that total and regional grey matter volume does; consequently, controlling for TIV has been shown to be unnecessary in analyses of cortical thickness, although it is important that effects of age and sex are suitably controlled (Barnes et al., 2010).
2.5.4. Magnetisation transfer saturation
Mean MT saturation in percentage units (p.u.) was extracted as a global measure for the whole cortex and compared between groups. The study specific template was used for image alignment. A whole cortex voxel-wise analysis of MT saturation was also carried out using CamBA version 2.3.0. A GLM was used, comparing the PWS group with the control group.
2.5.5. Exploration of the relationships between GM volume, cortical thickness and MT saturation
Two binary masks of all significant clusters of between-group dif-ferences (one for combined positive and negative clusters respectively) in the VBM analysis, confined to cortical GM, were used to extract the mean cortical thickness and MT saturation for these areas. These measurements were then compared between groups (PWS vs. control group) to assess whether cortical thickness and MT saturation also differed in areas where volume was significantly altered. The re-lationship between cortical thickness and MT saturation was also as-sessed within each group both at the global level and for each of the measurements extracted from significant clusters, as described above.
thickness and GM volume and a positive relationship between age and MT saturation in young adults (Gogtay et al., 2004; Tau and Peterson, 2010), these analyses are reported at the one-tailed p< 0.05 sig-nificance level.
2.5.7. Exploration of the associations between GM structure and IQ and BMI
The association between GM volume, cortical thickness and MT saturation with IQ and BMI were assessed within each group. These analyses are reported at the two-tailedp< 0.05 significance level.
3. Results
3.1. Participants
Overall, the groups were well matched for age and sex. There was no significant difference between the PWS and control groups in age or sex ratios, however, as would be expected with these populations, body mass index (BMI) and intelligence quotient (IQ) did differ significantly, although the control group mean was towards the upper end of the healthy BMI range (Table 1). BMI and IQ were not controlled for in investigations of brain structure owing to the strength of their asso-ciation with group. Nineteen of the 20 participants with PWS had the deletion subtype, whilst one had the UPD subtype.1This is in contrast to an expected ratio of approximately 3:1, but was not due to over-representation of UPD among those withdrew or were unable complete all measures. As would be expected in this young adult group, the
majority of participants with PWS were either currently or had his-torically received growth hormone treatment (17/20; 7 current) and hormone treatment (15/20; 7 current). Ten participants with PWS were taking some form of psychoactive medication (seeTable 1for further details).
3.2. Global measures of volume
The distribution of TIV for both groups was approximately normal (Shapiro-Wilk tests,p > 0.05) and similar in dispersion (PWS group: s = 132.292 ml; control group: s = 144.765 ml). Although, the mean TIV in the PWS group (mean = 1495.61 ml) was slightly lower than in the control group (mean = 1551.22 ml), no significant difference in TIV between groups was found,t(58) =−1.442,p= 0.155.
Cerebellar GM volumes also approximated a normal distribution within groups (Shapiro-Wilk tests,p> 0.05) and did not differ sig-nificantly between the PWS (mean = 70.12 ml, s = 4.765) and control (mean = 70.97 ml, s = 2.869) groups,t(58) =−0.866,p= 0.390.
Similarly, the volume of all GM excluding the cerebellum did not differ significantly between the PWS (mean = 333.80 ml, med-ian = 330.18 ml) and control (mean = 330.15 ml, med-ian = 326.59 ml) groups, U= 380.00, p= 0.762. However, the dis-tribution of total grey matter volume (excluding cerebellum) in the PWS group was broader in range, and the variance differed significantly between the two groups,F(1,58) = 8.523,p< 0.01.
3.3. VBM analysis
Ten significant clusters were identified at thepcorrected< 0.05
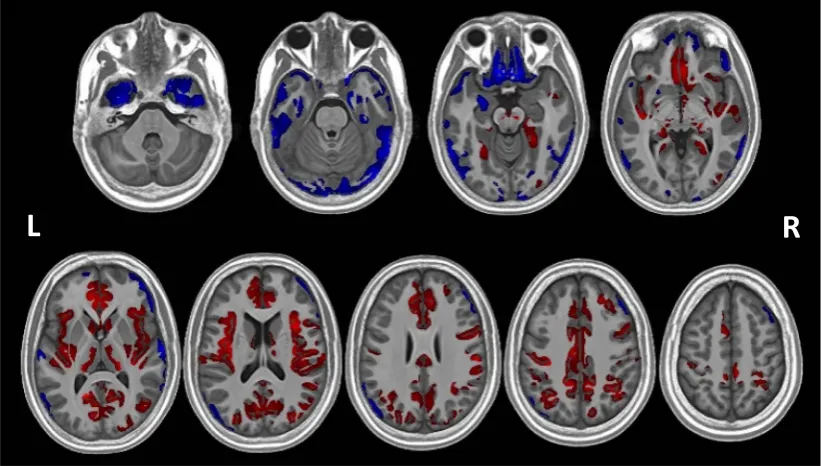
(two-tailed) level.Table 2shows the size of these clusters, the peak cluster value (t-statistic), and the peak coordinates for each cluster in MNI space. Eight clusters showed areas that had greater volume in PWS compared to the control group, whilst two clusters indicated areas that had reduced volume in PWS compared to the control group (Table 2; Fig. 1).Fig. 1shows, in particular, that the majority offindings of de-creased volume are in the inferior part of the brain, whilst the majority of clusters showing increased volume are located in the superior part of the brain.
3.3.1. PWS > controls
The largest positive cluster (cluster 2, seeTable 2for cluster label-ling) extends across diffuse areas of the frontal, cingulate, temporal and parietal cortices and into the subcortical GM. It encompasses the bi-lateral medial PFC, throughout the cingulate gyrus (anterior, middle and posterior) bilaterally and the right insula, extending into the right superior temporal lobe and right inferior parietal lobe and bilaterally into anterior parts of the more superior occipital lobe as it meets the temporal and parietal lobes. This right parietal area also extends from the postcentral gyrus into right precentral and inferior frontal gyri. Additionally, a number of subcortical structures are encompassed by this large cluster: specifically, the more ventral parts of the bilateral caudate and the right putamen, including the right nucleus accumbens area, as well as the most posterior aspects of the right putamen and the bilateral thalamus. With the exception of the left nucleus accumbens area, the contralateral counterparts to those areas encompassed uni-laterally by this large cluster are included in other clusters, mainly by cluster 4 which covers the left insula, extending into the left inferior frontal gyrus, left postcentral gyrus and left superior temporal areas, and also includes the left posterior putamen. Cluster 3 further en-compasses the superior temporal and middle temporal gyri on the banks of the superior temporal sulcus.
Clusters 5, 6 and 7 cover mostly parietal areas. Cluster 5 extends from the right precentral gyrus posteriorly through the parietal lobe, including dorsal and lateral aspects, through to the posterior inferior and superior gyri and angular gyrus. Cluster 6 and 7 largely encompass areas contralateral to those in cluster 5: cluster 6 extends from the left
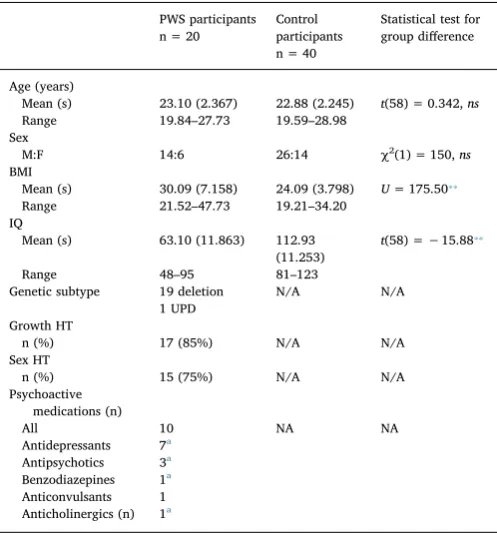
Table 1
Characteristics of the PWS and control groups.
PWS participants n = 20
Control participants n = 40
Statistical test for group difference
Age (years)
Mean (s) 23.10 (2.367) 22.88 (2.245) t(58) = 0.342,ns
Range 19.84–27.73 19.59–28.98 Sex
M:F 14:6 26:14 χ2(1) = 150,ns
BMI
Mean (s) 30.09 (7.158) 24.09 (3.798) U= 175.50⁎⁎ Range 21.52–47.73 19.21–34.20
IQ
Mean (s) 63.10 (11.863) 112.93 (11.253)
t(58) =−15.88⁎⁎ Range 48–95 81–123
Genetic subtype 19 deletion N/A N/A 1 UPD
Growth HT
n (%) 17 (85%) N/A N/A
Sex HT
n (%) 15 (75%) N/A N/A
Psychoactive medications (n)
All 10 NA NA
Antidepressants 7a
Antipsychotics 3a
Benzodiazepines 1a
Anticonvulsants 1 Anticholinergics (n) 1a
BMI: body mass index; F: female; HT: hormone treatment; IQ: intelligence quotient; M: male; n: number; N/A: not applicable;ns: nonsignificant; s: standard deviation; UPD: uniparental disomy.
⁎⁎Significant atp< 0.001.
aOne participant was taking both an antidepressant and an antipsychotic; another was
taking both an antidepressant and a benzodiazepine; another was taking both an anti-psychotic and an anticholinergic.
1The participant with UPD was not an outlier in the PWS cohort in regard to measures
postcentral gyrus through the parietal lobe, though not quite as dorsally as cluster 5, encompassing all lateral aspects through to posterior parts of the inferior and superior gyri and the angular gyrus, and extending just into the occipital lobe beyond; cluster 7 consists of the left pre- and postcentral gyri.
Clusters 1 and 8 are unilateral clusters, without a contralateral corresponding cluster. Cluster 1 is located in the left posterior medial temporal cortex, in the posterior aspects of the fusiform and para-hippocampal gyri, and continuing into the lingual gyrus. Cluster 8 comprises the more medial areas of the right dorsolateral PFC.
3.3.2. PWS < controls
The larger of the two negative clusters (cluster 9) encompasses the more inferior areas of the cortex, in the OFC and the most inferior as-pects of the insula bilaterally, as well as areas of the temporal and parietal lobes. This included the medial temporal lobes bilaterally, in-cluding parahippocampal gyri and fusiform gyri (located more ante-riorally than the areas included in cluster 1) and extending into the inferior hippocampus, as well as the bilateral temporal poles and the left amygdala. Reduced volume in the temporal poles extended along the inferior temporal gyri into the inferior occipital cortex bilaterally at its lateral and posterior surfaces. Areas of the parietal lobe at its pos-terior surface were also included, with the cluster continuing into the
occipital lobe at this point. These parietal areas were located at the more posterior surface of the parietal lobe than those encompassed by the positive clusters, which were more laterally and dorsally located. The second negative cluster (cluster 10) is located in the right lateral PFC, and extends from ventral to dorsal regions on the lateral surface.
3.4. Cortical thickness
The distribution of mean global cortical thickness in the PWS group approximated the normal distribution, however it deviated significantly from the normal distribution in the control group, showing a positive skew including a number of outliers at the upper end of the distribution. Consequently, nonparametric tests were used to compare the distribu-tions, finding that mean global cortical thickness was significantly greater in the PWS group (mean = 2.90 mm, Mdn= 2.80 mm, s = .343 mm) than the control group (mean = 2.70 mm, Mdn= 2.60 mm, s = .297 mm),U= 258.50, p= 0.026 (two-tailed). Exclusion of outliers in the control group would only emphasise this
finding, since all outliers lie at the upper end of the control group's cortical thickness distribution.
Fig. 2 shows areas of the cortex with increased and decreased thickness in the PWS group compared to the typically developing control group. In total, the analysis identified ten significant clusters (pcorrected < 0.05, two-tailed). The majority of these clusters (eight)
encompassed a large and diffuse area in which the cortex was thicker in PWS compared to the typically developing control group. Taking these clusters together, this increase in thickness was largely bilateral and extended from the superior and mid occipital cortex through the par-ietal, medial and superior temporal cortices, to the PFC. In particular, however, the insula as well as the medial cortex showed increased cortical thickness– most strikingly in the ACC and the medial PFC, though also including parts of the mid cingulate cortex, posterior cin-gulate cortex, cuneus and precuneus. The two clusters in which cortical thickness was decreased in PWS compared to the typically developing control group were again bilateral in nature and located largely in-feriorly to the clusters of increased volume. In contrast to the areas of increased thickness in the PWS group, these areas were very small. They included anterior areas of the hippocampus, as well as the most inferior
Table 2
Clusters of significantly increased or decreased volume in the PWS group compared to the typically developing control group.
Cluster Cluster size (template space, mm3)
Peak value Peak MNI coordinates (x, y, z)
1 2105 5.213376 −31,−51,−5 2 87,936 7.873281 −16,−57, 11 3 1788 4.631148 48,−13,−9 4 12,981 6.440391 −40,−16,−9 5 6881 5.011025 33,−48, 48 6 4698 4.817841 −25,−56, 49 7 2162 6.256971 −33,−22, 41 8 2056 5.433667 25, 43, 35 9 55,760 −6.458086 −10, 24,−24 10 5180 −4.616985 49, 30,−14
aspects of the insula, the olfactory gyri, the most inferior parts of the inferior frontal gyrus and the right middle temporal pole. Notably, however, these clusters also encompassed bilateral amygdalae since they were included in the cortical GM mask, however these are corti-coid not cortical structures and so interpretation of this observation of reduced thickness is not possible.
3.5. Magnetisation transfer saturation
There was no difference in mean global MT saturation between the
PWS group (mean = 0.905 p.u., s = 0.056 p.u.) and the control group (mean = 0.902 p.u., s = 0.048 p.u.),t(58) = 0.162,p= 0.872 (two-tailed). A voxel-based comparison of MT saturation across the whole cortex also found little difference between groups except for in a few localised areas (pcorrected < 0.05, two-tailed), suggesting that MT
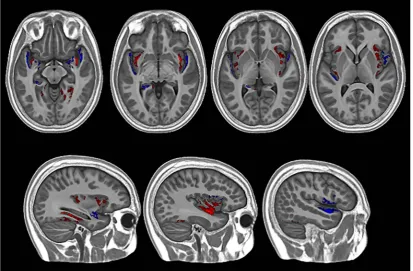
sa-turation was largely similar across the cortex. The clusters of increased and decreased MT saturation are shown inFig. 3. Areas of increased MT saturation in the PWS group compared to the typically developing control group were found in the insula, as well as the posterior of the inferior temporal lobe. Areas of reduced MT saturation in the PWS
Fig. 2.Findings from the whole-brain nonparametric GLM analysis showing clusters where cortical thickness differed significantly between the PWS and control groups. Red indicates areas where the cortex was thicker in the young adults with PWS compared to the typically-developing control group, whilst blue indicates areas where the cortex was thinner in the PWS group compared to the control group. Clusters are overlaid on the study specific template space in which the analysis was conducted. (For interpretation of the references to color in this
figure legend, the reader is referred to the web version of this article.)
group were found mainly in medial temporal lobe regions, including parts of the hippocampus and amygdala, but were also seen in the frontal and temporal opercula. Thesefindings, whilst largely bilateral, were more marked in the right hemisphere.
3.6. Exploring the relationships between GM volume, cortical thickness and MT saturation
Mean cortical thickness in the combined clusters of significantly greater volume in PWS, was significantly greater in the PWS group (mean = 3.09 mm, median = 3.08 mm, s = .471 mm), compared to the control group (mean = 2.61 mm, median = 2.46 mm, s = .384 mm), U= 162.00, p< 0.001. This suggests that cortical thickness was driving the difference in GM volume, at least for areas of increased volume.
However, in combined clusters where volume was significantly re-duced in PWS compared to the control group, no significant difference was found in cortical thickness between the PWS (mean = 2.96 mm, med-ian = 2.93 mm, s = 0.341) and control (mean = 3.03 mm, med-ian = 2.97 mm, s = .247 mm) groups,U= 332.00,p= 0.226, indicating that a thinner cortex could not explain thefinding of decreased volume.
No differences were found in MT saturation between the PWS and control groups in either combined clusters of increased or decreased volume in PWS. Similarly, no relationship was found between myeli-nation saturation and cortical thickness for the PWS or control groups at the global level or within the combined clusters of increased or de-creased volume. This suggests cortical thickness and volume were not artificially altered as an artefact of MRI tissue segmentation. Briefly, increased myelination of the cortex would increase the likelihood that tissue is classified as WM, particularly at the WM-GM boundary since myelination follows an inside-out pattern, and thus not included in calculation of cortical thickness (for discussion seeAhmed et al., 2015; Storsve et al., 2014).
3.7. Exploration of the relationships between GM structure and age
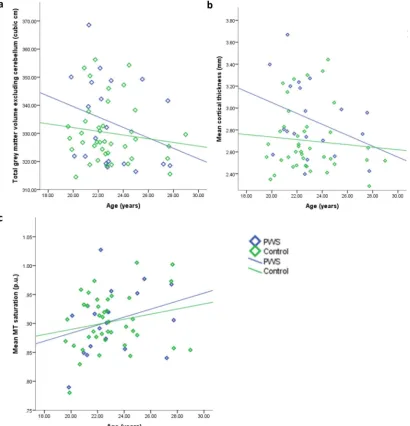
A significant negative relationship between total GM volume (ex-cluding the cerebellum) and age was found for the PWS group only, rs=−0.421,p= 0.032 (control:rs=−0.144,p= 0.188) (Fig. 4a).
However, analysis of the interaction between group and age (centred to account for multicollinearity) on total cortical and subcortical GM vo-lume did notfind this to be significant,t= 0.798,p = 0.429.
Fig. 4b suggests a small negative association between reduced cor-tical thickness and increased age within both groups. However, this relationship was not significant in either group, and showed a trend towards significance within the PWS group only (one-tailed significance level): PWS group, rs=−0.362, p= 0.058; control group,
rs=−0.083,p= 0.309.
Fig. 4c suggests a small positive relationship between age and MT saturation, as may be expected in this age group, however, this was not significant in either group: PWS group,r= 0.292,p= 0.106; control group,r= 0.207,p= 0.100.
3.8. Exploration of the relationships between GM structure, IQ and BMI
For IQ, a significant positive correlation between total GM volume (excluding the cerebellum) was found in both groups: PWS group, rs= 0.475,p= 0.034; control group,rs= 0.419,p= 0.007. A positive
association between cortical thickness and IQ was identified within the control group only: PWS group,rs= 0.297,p= 0.203; control group,
rs= 0.333,p= 0.036. No association between IQ and MT saturation
was found in either group.
No significant association was found between BMI and any measure of GM structure (volume, cortical thickness or MT saturation) within either the PWS or control group.
4. Discussion
4.1. Characterisation of grey matter structure in PWS
Multiple and diffuse areas of difference between the PWS and control groups were identified by the VBM analysis, despite no overall difference in TIV or total GM volume. These differences suggest diffuse abnormalities throughout the brain. In particular, large and diffuse regions of greater volume were seen in the PWS group compared to the typically developing control group. These widespread areas of in-creased volume encompassed parts of the PFC, in particular medially, the majority of the cingulate cortices, from anterior to posterior aspects, insula cortices, and areas of the parietal and temporal cortices. Increased volume was also reported in the caudate, putamen and tha-lamus. The most ventromedial prefrontal areas, in contrast, showed reduced volume, as did the parts of the medial temporal lobe, bilateral temporal poles, and a small cluster in the right lateral PFC.
Only two previous VBM analyses comparing PWS to a typically developing control group have been published.Ogura et al. (2011)also reported reduced OFC volume, but, alongside this, reduced volume was also seen in the caudate, inferior temporal gyrus, pre- and post-central gyri and supplementary motor area, in a group of participants of a si-milar age as those in the current study. Reduced OFC volume was found in the current study, however, whilst aberrant volume was seen in the other areas, this was in the direction of increased volume. In fact, Ogura et al. found no areas of increased volume in PWS compared to controls, in contrast to the widespread volume increases seen in this study. Si-milarly, Honea et al. (2012) reported smaller anterior cingulate, su-perior temporal and hippocampal volumes in PWS compared to healthy controls and no regions where increased volume was seen in PWS. This concurs with thefindings reported here of reduced hippocampal vo-lume, but contrasts to the increase in ACC size. The current study was larger than these previous studies and age-matching was more strin-gent. Perhaps most importantly, these studies also failed to correct for TIV, which was reported to be significantly decreased in PWS. This may be, at least, partially responsible for the conflicting findings with widespread volume reduction perhaps expected alongside reduced TIV. In contrast to these previous studies, TIV was not significantly reduced in PWS in this study, although the average and range was shifted in this direction and it was included as a covariate in the VBM.
In another quantitative analysis, Lukoshe et al. (2013) reported reduced TIV in PWS children with deletion compared to sibling
controls, but no significant differences in GM volumes or cerebellar volumes after correcting for TIV, suggesting that this indicated reduced size but proportional development in the deletion subtype of PWS. However, they also reported increased right superior parietal lobe and left superior temporal sulcus volume, and a smaller right hippocampal gyrus. Thesefindings are similar to those of the current study, although Lukoshe et al. parcellated the brain according to gyri and sulci to ex-tract GM volumes, whilst an automated voxel based analysis was un-dertaken in the current study allowing clusters to cross anatomical boundaries. This moreflexible analysis may enable greater sensitivity to difference by its lack of limitation to sulci boundaries and suggests that the brain in the deletion type of PWS does not simply develop in a reduced yet proportional way, but with widespread alterations.
Going beyond volume, cortical structure was considered in more depth with measures of cortical thickness and myelination. Average (mean and median) cortical thickness in the PWS group was approxi-mately 0.2 mm greater than in the control group. The whole cortex voxel-wise analysis indicated that, as for grey matter volume, there were widespread and largely bilateral alterations of cortical thickness, with a thicker cortex observed in the PWS group from occipital regions through parietal and superior temporal areas to the cingulate and insula cortices and the PFC (in particular medial PFC). Areas of reduced cor-tical thickness were much smaller and, as for areas of reduced volume, were located largely inferior to the areas of thicker cortex. Notably, areas of increased cortical thickness appeared to overlap quite heavily with the areas of increased GM volume seen in the PWS group. No such striking global or diffuse differences were observed between the PWS and control group for MT saturation, suggesting that the extent of myelination within the cortex, at least by young adulthood, was broadly typical in PWS, with the exception of small localised clusters, in par-ticular in the insula. As such, the insula may be an area of parpar-ticular abnormality in PWS showing aberrant volume, cortical thickness and myelination.
More broadly, thesefindings suggest that cortical thickness was a driving factor at least in the areas of increased volume, with minimal contribution to the differences observed derived from differences in myelination. This was further investigated and confirmed by directly comparing cortical thickness and magnetisation transfer saturation in the areas in which a significant difference in volume had been found. Cortical thickness was markedly greater in the areas in which increased volume was seen in PWS compared to the control group, whilst there was no similar difference for areas of reduced volume.
Thefinding of greater cortical thickness in young adults with PWS appears at odds with the lack of a difference in cortical thickness re-ported byLukoshe et al. (2013)in children with the deletion type of PWS compared to typically developing siblings, although they did re-port an increase in cortical thickness in UPD. The PWS group in the current study predominantly comprised individuals with the deletion subtype. Perhaps a crucial difference between this previousfinding and that of the current study is the age of participants: the age range in this previous study for those with the deletion subtype ranged from middle childhood through adolescence, and was only considered at the level of a global mean. Thus, it is possible that the complexity of cortical thickness change over this period, which encompasses both a rapid rise and peak before a reduction of cortical thickness (Shaw et al., 2008), means that to observe any differences would have required a much more nuanced analysis. Furthermore, all participants in the UPD sub-type were aged between 6.8 and 13.1 years, whilst the control groups were aged between 7.1 years–15.8 years. The age range of those with deletion extended higher still: 6.7–17.0 years. Given that a peak in cortical thickness would be expected within the UPD range, followed by a decline in the older participants, the higher cortical thickness in the UPD group may be explained according to this age difference.
report widespread increased volume and cortical thickness in the brain in PWS, alongside other areas showing reductions in grey matter vo-lume. Moreover, in the previous literature reporting functional imaging studies in PWS, many of these areas have been found to respond aberrantly, including increased ventromedial PFC activity following caloric intake in response to food images than seen in controls (e.g. Hinton et al., 2006; Shapira et al., 2005; Miller et al., 2007). Fronto-parietal connectivity has been implicated in the set-shifting abnormal-ities seen in PWS (Woodcock et al., 2010), with connectivity between the prefrontal, inferior parietal and anterior cingulate cortices – all showing altered volume here–involved in successful switching in the typical population (Hyafil et al., 2009; Monsell, 2003; Rubia et al., 2006). This difficulty, in turn, has been associated with the need for routine and temper outbursts and related behaviours (Woodcock et al., 2011). Furthermore, many of the areas of structural abnormality de-scribed above are highly implicated in emotional processing and emo-tional and behavioral control and within the cortico-striatal-thalamic loops involved in these capacities. The ACC, for example, is highlighted in a number of psychiatric disorders of mood and affective processing, including depression (e.g.Ressler and Mayberg, 2007), with the insula frequently associated with interoception of emotion and sensory states (Gu et al., 2013). Recently,Klabunde et al. (2015)described increased right ACC, supplementary motor area, insula and middle frontal gyrus activity in PWS during skin picking, suggesting that skin picking may play a role in balancing an impaired system for interoception. Resting state imaging in PWS has also reported aberrant activity in the majority of these areas, including, among others, reduced activity in OFC, tem-poral poles, insula, medial PFC, ACC, and medial and superior temtem-poral lobes (Kim et al., 2006; Mantoulan et al., 2011; Ogura et al., 2011; Zhang et al., 2015). Again, these areas were all highlighted in this study as having increased volume in PWS. It is plausible that such abnorm-alities of function may be underpinned by atypical structural develop-ment.
4.2. Possible mechanisms responsible for atypical brain structure in PWS
The largely bilateral nature of the volumetric increases and creases may indicate an early and/or systemic biological basis to de-velopmental abnormalities, rather than morphological differences arising owing to differences in particular capacities, for example in language production, where more unilateral changes would be ex-pected. Consequently, it seems plausible that these abnormalities may occur either during early neurodevelopment such as neuronal diff er-entiation and migration and layering and gyrification of the cortex, or in the maturation of cortical areas occurring at critical periods as happens, for example, in the frontal cortex of typically developing adolescents (i.e. cortical thinning; for review see Tau and Peterson, 2010). These may not be mutually exclusive and there may be an in-terplay in that typical development may not be expected to continue from an atypical foundation.
Potential reasons for the greater cortical thickness found here in the PWS group were considered. Firstly, it is possible that the maturation and related cortical thinning of the cortex is delayed in PWS. Such a
finding may be informative in consideration of Whittington and Holland's (2004, p.140)suggestion of arrested development in PWS. It is important to emphasise that this is a cross-sectional study, and as such, consideration of alteration of cortical maturation is speculative and would require longitudinal measurement and a wider age range extending into childhood and adolescence. It was possible, however, to consider the expected pattern of cortical maturation within both groups. In the typically developing population, the trajectory of cortical development has been fairly well established, with a decrease in thickness of the cortex alongside increasing myelination following a largely posterior to anterior pattern in the brain, involving first the areas involved in basic sensory and motor functions, before the ma-turation of the frontal lobes and PFC, in particular, during adolescence
and early adulthood (e.g.Shaw et al., 2008; Østby et al., 2009; Giedd et al., 1999; Sowell et al., 2002; for review seeTau and Peterson, 2010). If maturation relating to cortical thinning was delayed in this sample, we may expect to see one of the following effects: a) a thicker cortex in PWS than the typically developing control group given the post-ado-lescence age range; b) an altered relationship between cortical thick-ness or GM volume and age in the PWS compared to the typically de-veloping control group; c) cortical thickness differences located mainly in later maturing areas of the cortex.
As described, cortical thickness was significantly greater in the PWS group compared to the typically developing control group. There was a significant negative correlation between age and total GM volume (excluding cerebellum) in the PWS group only, although no significant group by age interaction effect was found. Similarly, a trend towards significance for a moderate negative correlation between age and global mean cortical thickness was reported in the PWS group, which was not found in the control group. This set offindings is compatible with a delayed thinning of the cortex, whereby the thicker cortex is still un-dergoing a more rapid thinning process later into young adulthood than seen in the typically developing population. However, if this was the case, it would appear that such maturation may be severely delayed since increased cortical thickness was seen in some more sensorimotor and association areas, where earlier thinning may be expected, as well as in the frontal areas, associated with higher order cognition, where later maturation would be expected.
An alternative explanation for the increased cortical thickness re-ported here in the young adults with PWS concerns early cortical de-velopment. Determination of cortical thickness in the developing foetus has been particularly associated with the period of neuronal migration (Rakic, 1990, 1995). In clear disturbances of foetal cortical develop-ment, presenting with the extreme of lissencephaly or pachygyria,2a thickened cortex is typically seen alongside the reduced gyrification (Kuzniecky, 1994). Increased cortical thickness has been reported alongside reduced surface area in a number of neurodevelopmental disorders (Lee et al., 2016; Meda et al., 2012; Jalbrzikowski et al., 2013). There is also evidence of a negative association of cortical sur-face area with cortical thickness within the typical population (Hogstrom et al., 2013; Im et al., 2008). One hypothesis to explain this relationship suggests that the need for local connectivity as cortical volume increases is most efficiently met by increasing surface area than by increasing thickness (e.g.Ruppin et al., 1993). Consequently,fi nd-ings of increased cortical thickness may also be indicative of aberrant gyrification, which has been associated with intellectual disability (Zhang et al., 2010).Lukoshe et al. (2014)identified large clusters in frontal, parietal and temporal lobes which had reduced cortical com-plexity in children with PWS compared to typically developing siblings. A further significant point for discussion is that although volume increases in the cortex appear driven by increased cortical thickness, cortical thickness was not found to be decreased in regions showing reduced volume. One particular observation of interest is the fairly distinct split between the locations of reduced and increased volume, with areas of increased volume superior to the more inferior areas of volume decrease. One intriguing possibility is that this pattern of
findings may be informative about the role of imprinted genes in neural development. PWS is a disorder of genomic imprinting arising from the lack of paternal expression of a number of maternally imprinted genes. Broadly, at the level of both embryonic development and placental development, knockout of maternally expressed genes results in over-growth whilst knockout of paternally expressed genes leads to under-growth (for reviews see Goos and Silverman, 2001; Plasschaert and Bartolomei, 2014). This is in line with theories from evolutionary
2Lissencephaly and pachygyria are caused by developmental disturbances of neuronal
biology suggesting that paternal expression of maternally imprinted genes should provide some advantage in growth and accessing maternal resources thus promoting offspring preservation, whilst maternal ex-pression of paternally imprinted genes should work to restrict these functions in order to distribute limited resources across multiple off -spring and promote maternal self-preservation (e.g. the genetic conflict model of genomic imprinting; seeHaig, 1993). With regard to neural development,Keverne et al. (1996)created chimeric mouse embryos
finding that androgenetic chimeras had smaller brains and larger bodies, whilst the reverse was true for the parthenogenetic chimeras.3 Moreover, Keverne et al. also reported more nuanced regional con-tributions of maternal and paternal expression in the brain, with an-drogenetic cells most important in the inferior pre-optic area and hy-pothalamus, whilst parthenogenetic cells were more prevalent in the cortex, striatum and hippocampus. This latterfinding appears similar to the pattern seen in the current study of brain structure in a rare disorder in which some paternal expression of maternally imprinted genes is absent.
Finally, a number of potentially confounding factors associated with PWS, either directly or through the clinical management of its features, may also require consideration for a fuller understanding of the brain in PWS. Firstly, the PWS and control samples were well-matched in regard to age and sex. It was not possible, however to match participants for BMI or IQ, since BMI was significantly greater in the PWS group and IQ was significantly higher for the control group. A recent study by Xu et al. (2017) identified a number of overlapping brain regions of decreased grey matter volume between children with PWS and children with severe obesity, suggesting shared effects or vulnerabilities. The strength of the associations of BMI and IQ with group was such that attempting to control for these factors during comparisons of the PWS and control groups was not possible. However, no associations between BMI and grey matter volume or cortical structure were found within either group within the present study, although only undertaken at the global level. In contrast, an association between IQ was found for grey matter volume within both groups, as well as with cortical thickness within the control group, and should be held in mind as a potential confound in interpreting the group differences reported.
Secondly, the use of psychoactive medications and growth and sex hormone treatment in PWS may also have an impact on neurodeve-lopment and function. Half of the individuals with PWS taking part in this study were being treated with one or more psychoactive medica-tions. Importantly, this also means that half of the sample was not currently taking any psychoactive medications, which is a larger pro-portion than can often been found within the PWS population. The site of action of these medications varied substantially, meaning more in-depth interrogation of potential effects of these medications was not feasible, however the most common class of medication being used was antidepressants, of which all were a form of selective-serotonin re-uptake inhibitor (SSRI). In this population SSRIs are often prescribed to treat behavioral problems as well as mood disorders. Furthermore, the majority of individuals taking part were not currently and, had never been, diagnosed with a psychiatric illness, such as depression, anxiety or psychosis.
Lastly, as is now common in clinical practice, many of the partici-pants with PWS were currently or had historically received growth hormone and sex hormone treatment to address the deficiencies of these hormones found in PWS. The role of growth hormone in the brain is not fully understood, but receptors are found throughout the brain and research has suggested potential effects of growth hormone treat-ment on behavior and cognition (Siemensma et al., 2012). Conse-quently, it is possible that growth hormone treatment may have effects
on neural development. A similar caveat applies to sex hormone treatment, which is commonly, but not universally, used in PWS, usually starting in late adolescence. The relatively small sample size, especially of the groups who had never received these treatments, means that further investigation within this sample of the effects of growth and sex hormone treatment on the brain in PWS was unlikely to be informative, though care should be taken in generalising to the, often older, untreated PWS population.
5. Conclusions
The participants within this study were all young adults and well-matched for age and sex with their typically developing counterparts in the control group. This is important since previous studies have in-cluded children, adolescents and adults, which may be responsible for some of the conflictingfindings, given the trajectory of GM develop-ment and maturation across the lifespan. Widespread morphological abnormalities of both increased and decreased volume were found in those with PWS compared to the typically developing control group in areas previously reported to show atypical anatomy or function in PWS and related behaviours, although the direction offindings has often been inconsistent. Cortical structure was also investigated, with clear abnormalities in cortical thickness reported, most notably widespread increased thickness in PWS. This increased cortical thickness appears to be driving the increased volume reported in PWS, however no similar abnormality was found to be underpinning areas of reduced volume. Myelination of the cortex was largely similar in both groups. Possible explanations for thefindings of altered brain structure in PWS come from both an early developmental and delayed maturational cause, and a number of potentially confounding factors associated with PWS or its clinical treatment need to be considered, such as BMI and IQ as well as the use of sex and growth hormone therapy. Greater elucidation of these mechanisms in PWS would require at least a wider age range of well-matched samples extending from very early childhood, or even foetal scanning, through to adulthood, and, at the gold standard, careful longitudinal assessment.
Acknowledgements
We would like to acknowledge the NSPN U-Change project team for sharing their MRI data for typically-developing adolescents and young adults, which was used as a comparison group in this study. Genetic analysis was undertaken by the East Anglian Medical Genetics Service, Cambridge, UK. We would also like to thank the PWSA UK and re-sidential settings supporting those with PWS for their help in recruiting participants with PWS to take part in this study. Similarly, we ap-preciate the efforts of families and support workers, whose facilitation of participation was crucial to the success of the project. Most im-portantly, our sincere gratitude goes to the men and women with PWS for the time and effort they so willingly gave and without whom this research would not have been possible.
Funding
The research was funded by the Prader-Willi Syndrome Association UK (grant number RG63385). KM was supported by the Pinsent Darwin Studentship in Mental Pathology and by St John's College, University of Cambridge. AH received support from the Health Foundation (grant number RG34317) and NIHR Collaborations for Leadership in Applied Health Care Research and Care (CLAHRC) East of England. Funding bodies had no role in the study design, data collection, data analysis, data interpretation, writing of the report or the decision to submit for publication. The views expressed are those of the authors and not ne-cessarily those of the NHS, the NIHR or the Department of Health. 3Androgenetic and parthenogenetic chimeras comprise cells containing maternal and
Conflict of interest
The authors declare no conflict of interest.
References
Ahmed, S.P., Bittencourt-Hewitt, A., Sebastan, C.L., 2015. Neurocognitive bases of emotion regulation development in adolescence. Dev. Cogn. Neurosci. 15, 11–25.
Avants, B.B., Tustison, N., Song, G., 2011. Advance Normalization Tools (ANTS). University of Pennsylvania: Penn Image Computing and Science Laboratory.
Barnes, J., Ridgway, G.R., Bartlett, J., Henley, S.M.D., Lehmann, M., Hobbs, N., ... Fox, N.C., 2010. Head size, age, and gender adjustment in MRI studies: a necessary nui-sance? NeuroImage 53, 1244–1255.
Bittel, D.C., Butler, M.G., 2005. Prader-Willi syndrome: clinical genetics, cytogenetics and molecular biology. Expert Rev. Mol. Med. 25, 1–20.
Bullmore, E.T., Suckling, J., Overmeyer, S., Rabe-Hesketh, S., Taylor, E., Brammer, M.J., 1999. Global, voxel, and cluster tests, by theory and permutation, for a difference between two groups of structural MR images of the brain. IEEE Trans. Med. Imaging 18, 32–42.
Clarke, D.J., Boer, H., Whittington, J.E., Holland, A.J., Butler, J.V., Webb, T., 2002. Prader-Willi syndrome, compulsive and ritualistic behaviours: thefirst population-based survey. Br. J. Psychiatry 180, 358–362.
Das, S.R., Avants, B.B., Grossman, M., Gee, J.C., 2009. Registration based cortical thickness measurement. NeuroImage 45, 867–879.
Draganski, B., Ashburner, J., Hutton, C., Kherif, F., Frackowiak, R.S.J., Helms, G., Weiskopf, N., 2011. Regional specificity of MRI contrast parameter changes in normal ageing revealed by voxel-based quantification (VBQ). NeuroImage 55, 1423–1434.
Dykens, E.M., Kasari, C., 1997. Maladaptive behavior in children with Prader-Willi syn-drome, Down synsyn-drome, and nonspecific mental retardation. Am. J. Ment. Retard. 102, 228–237.
Giedd, J.N., Blumenthal, J., Jeffries, N.O., Castellanos, F.X., Liu, H., Zijdenbos, A., ... Rapoport, J.L., 1999. Brain development during childhood and adolescence. Nat. Neurosci. 2, 861–863.
Gogtay, N., Giedd, J.N., Lusk, L., Hayashi, K.M., Greenstein, D., Vaituzi, A.C., ... Thompson, P.M., 2004. Dynamic mapping of human cortical development during childhood through early adulthood. Proc. Natl. Acad. Sci. 101, 8174–8179.
Goos, L.M., Silverman, I., 2001. The influence of genomic imprinting on development and behavior. Evol. Hum. Behav. 22, 385–407.
Gu, X., Hof, P.R., Friston, K.J., Fan, J., 2013. Anterior insula cortex and emotional awareness. J. Comp. Neurol. 521, 3371–3388.
Haig, D., 1993. Genetic conflicts in human pregnancy. Q. Rev. Biol. 68, 495–532.
Hinton, E.C., Holland, A.J., Gellatly, M.S., Soni, S., Patterson, M., Ghatei, M.A., Owen, A.M., 2006. Neural representations of hunger and satiety in Prader-Willi syndrome. Int. J. Obes. 30, 313–321.
Hogstrom, L.J., Westlye, L.T., Walhovd, K.B., Fjell, A.M., 2013. The structure of the cerebral cortex across adult life: age-related patterns of surface area, thickness, and gyrification. Cereb. Cortex 23, 2521–2530.
Holland, A.J., Whittington, J.E., Butler, J., Webb, T., Boer, H., Clarke, D., 2003. Behavioural phenotypes associated with specific genetic disorders: evidence from a population-based study of people with Prader-Willi syndrome. Psychol. Med. 33, 141–153.
Holm, V.A., Cassidy, S.B., Butler, M.G., Hanchett, J.M., Greenswag, L.R., Whitman, B.Y., Greenberg, F., 1993. Prader-Willi syndrome: consensus diagnostic criteria. Pediatrics 91, 398–402.
Holsen, L.M., Zarcone, J.R., Brooks, W.M., Butler, M.G., Thompson, T.I., Ahluwalia, J.S., ... Savage, C.R., 2006. Neural mechanisms underlying hyperphagia in Prader-Willi syndrome. Obesity 14, 1028–1037.
Honea, R.A., Holsen, L.M., Lepping, R.J., Perea, R., Butler, M.G., Brooks, W.M., Savage, C.R., 2012. The neuroanatomy of genetic subtype differences in Prader-Willi syn-drome. Am. J. Med. Genet. B Neuropsychiatr. Genet. 159B, 243–253.
Hyafil, A., Summerfield, C., Koechlin, E., 2009. Two mechanisms for task switching in the prefrontal cortex. J. Neurosci. 29, 5135–5142.
Im, K., Lee, J.-M., Lyttelton, O., Kim, S.H., Evans, A.C., Kim, S.I., 2008. Brain size and cortical structure in the adult human brain. Cereb. Cortex 18, 2181–2191.
Jalbrzikowski, M., Jonas, R., Senturk, D., Patel, A., Chow, C., Green, M.F., Bearden, C.E., 2013. Structural abnormalities in cortical volume, thickness, and surface area in 22q11.2 microdeletion syndrome: relationship with psychotic symptoms. Neuroimage: Clinical 3, 405–415.
Keverne, E.B., Fundele, R., Narasimha, M., Barton, S.C., Surani, M.A., 1996. Genomic imprinting and the differential roles of parental genomes in brain development. Dev. Brain Res. 92, 91–100.
Kim, S.E., Jin, D.K., Cho, S.S., Kim, J.H., Hong, S.D., Paik, K.H., ... Choe, Y.H., 2006. Regional cerebral glucose metabolic abnormality in Prader-Willi syndrome: a 18F-FDG PET study under sedation. J. Nucl. Med. 47, 1088–1092.
Klabunde, M., Saggar, M., Hustyi, K.M., Hammond, J.L., Reiss, A.L., Hall, S.S., 2015. Neural correlates of self-injurious behavior in Prader-Willi syndrome. Hum. Brain Mapp. 36, 4135–4143.
Kuzniecky, R.I., 1994. Magnetic resonance imaging in developmental disorders of the cerebral cortex. Epilepsia 35 (Suppl. 6), S44–S56.
Lee, N.R., Adeyemi, E.I., Lin, A., Clasen, L.S., Lalonde, F.M., Condon, E., ... Giedd, J.N., 2016. Dissociations in cortical morphometry in youth with Down syndrome: evidence for reduced surface area and increased thickness. Cereb. Cortex 26, 2982–2990.
Lukoshe, A., White, T., Schmidt, M.N., van der Lugt, A., Hokken-Koelega, A.C., 2013.
Divergent structural brain abnormalities between different genetic subtypes of chil-dren with Prader-Willi syndrome. J. Neurodev. Disord. 5, 31.
Lukoshe, A., Hokken-Koelega, A.C., van der Lugt, A., White, T., 2014. Reduced cortical complexity in children with Prader-Willi syndrome and its association with cognitive impairment and developmental delay. PLoS One 9, e107320.
Manning, K.E., Holland, A.J., 2015. Puzzle pieces: neural structure and function in Prader-Willi syndrome. Diseases 3, 382–415.
Mantoulan, C., Payoux, P., Diene, G., Glattard, M., Roge, B., Molinas, C., ... Tauber, M., 2011. PET scan perfusion imaging in the Prader-Willi syndrome: new insights into the psychiatric and social disturbances. J. Cereb. Blood Flow Metab. 31, 275–282.
Meda, S.A., Pryweller, J.R., Thronton-Wells, T.A., 2012. Regional brain differences in cortical thickness, surface area and subcortical volume in individuals withWilliams syndrome. PLoS One 7, e31913.
Miller, J.L., James, G.A., Goldstone, A.P., Couch, J.A., He, G., Driscoll, D.J., Liu, Y., 2007. Enhanced activation of reward mediating prefrontal regions in response to food sti-muli in Prader-Willi syndrome. J. Neurol. Neurosurg. Psychiatry 78, 615–619.
Monsell, S., 2003. Task switching. Trends Cogn. Sci. 7, 134–140.
Ogura, K., Fujii, T., Abe, N., Hosokai, Y., Shinohara, M., Takahashi, S., Mori, E., 2011. Small gray matter volume in orbitofrontal cortex in Prader-Willi syndrome: a voxel-based MRI study. Hum. Brain Mapp. 32, 1059–1066.
Østby, Y., Tamnes, C.K., Fjell, A.M., Westlye, L.T., Due-Tuønnesen, P., Walhovd, K.B., 2009. Heterogeneity in subcortical brain development: a structural magnetic re-sonance imaging study of brain maturation from 8 to 30 years. J. Neurosci. 29, 11772–11782.
Plasschaert, R.N., Bartolomei, M.S., 2014. Genomic imprinting in development, growth, behavior and stem cells. Development 141, 1805–1813.
Rakic, P., 1990. Principles of neural cell migration. Experientia 46, 882–891.
Rakic, P., 1995. A small step for the cell, a giant leap for mankind: a hypothesis of neocortical expansion during evolution. Trends Neurosci. 18, 383–388.
Ressler, K.J., Mayberg, H.S., 2007. Targeting abnormal neural circuits in mood and an-xiety disorders: from the laboratory to the clinic. Nat. Neurosci. 10, 1116–1124.
Rubia, K., Smith, A.B., Woolley, J., Nosarti, C., Heyman, I., Taylor, E., Brammer, M., 2006. Progressive increase of frontostriatal brain activation from childhood to adulthood during event-related tasks of cognitive control. Hum. Brain Mapp. 27, 973–993.
Ruppin, E., Schwartz, E.L., Yeshurun, Y., 1993. Examining the volume efficiency of the cortical architecture in a multi-processor network model. Biol. Cybern. 70, 89–94.
Shapira, N.A., Lessig, M.C., He, A.G., James, G.A., Driscoll, D.J., Liu, Y., 2005. Satiety dysfunction in Prader-Willi syndrome demonstrated by fMRI. J. Neurol. Neurosurg. Psychiatry 76, 260–262.
Shaw, P., Kabani, N.J., Lerch, J.P., Eckstrand, K., Lenroot, R., Gogtay, N., ... Wise, S., 2008. Neurodevelopmental trajectories of the human cerebral cortex. J. Neurosci. 28, 3586–3594.
Siemensma, E.P.C., Tummers-de Lind van Wijngaarden, R.F.A., Festen, D.A.M., Troeman, Z.C.E., van Alfen-van der Velden, A.A.E.M., Otten, B.J., ... Hokeen-Koelega, A.C.S., 2012. Beneficial effects of growth hormone treatment on cognition in children with Prader-Willi syndrome: a randomized controlled trial and longitudinal study. J. Clin. Endocrinol. Metab. 97, 2307–2314.
Smith, A., Egan, J., Ridley, G., Haan, E., Montgomery, P., Williams, K., Elliot, E., 2003. Birth prevalence of Prader-Willi syndrome in Australia. Arch. Dis. Child. 88, 263–264.
Sowell, E.R., Trauner, D.A., Gamst, A., Jernigan, T.L., 2002. Development of cortical and subcortical brain structures in childhood and adolescence: a structural MRI study. Dev. Med. Child Neurol. 44, 4–16.
Storsve, A.B., Fjell, A.M., Tamnes, C.K., Westlye, L.T., Overbye, K., Aasland, H.W., Walhovd, K.B., 2014. Differential longitudinal changes in cortical thickness, surface area and volume across the adult life span: regions of accelerating and decelerating change. J. Neurosci. 18, 8488–8499.
Tau, G., Peterson, B.S., 2010. Normal development of brain circuits. Neuropsychopharmacology 35, 147–168.
Wechsler, D., 2008. Wechsler Adult Intelligence Scale, fourth edition. The Psychological Corporation, San Antonio, TX.
Wechsler, D., 2011. Weschler Abbreviated Scale of Intelligence, second edition. The Psychological Corporation, San Antonio, TX.
Whittington, J., Holland, A., 2004. Prader-Willi syndrome: Development and Manifestations. Cambridge University Press, Cambridge.
Whittington, J.E., Holland, A.J., Webb, T., Butler, J.V., Clarke, D.J., Boer, H., 2001. Population prevalence and estimated birth incidence and mortality rate for people with Prader-Willi syndrome in one UK health region. J. Med. Genet. 38, 792–798.
Woodcock, K.A., Humphreys, G.W., Oliver, C., Hansen, P.C., 2010. Neural correlates of task switching in paternal 15q11–q13 deletion Prader-Willi syndrome. Brain Res. 1363, 128–142.
Woodcock, K.A., Oliver, C., Humphreys, G.W., 2011. The relationship between specific cognitive impairment and behaviour in Prader-Willi syndrome. J. Intellect. Disabil. Res. 55, 152–171.
Xu, M., Zhang, Y., von Deneen, K.M., Zhu, H., Gao, J.-H., 2017. Brain structural altera-tions in obese children with and without Prader-Willi syndrome. Hum. Brain Mapp. 38, 4228–4238.
Zhang, Y., Zhou, Y., Yu, C., Lin, L., Li, C., Jiang, T., 2010. Reduced cortical folding in mental retardation. AJNR Am. J. Neuroradiol. 31, 1064–1067.