Omics approaches for engineering wheat production under abiotic stresses Tariq Shah*1, Jinsong Xu1, Xiling Zou1 and Xuekun Zhang1
1Key Lab of Biology and Genetic Improvement of Oil Crops, Oil Crops Research Institute,
Chinese Academy of Agricultural Sciences (CAAS), Wuhan District, Hubei 430062, China.
Corresponding author: [email protected]
Abstract
Abiotic stresses greatly influenced wheat productivity executed by environmental factors such as
drought, salt, water submergence, and heavy metals. The effective management at molecular level
is mandatory for thorough understanding of plant response to abiotic stress. The molecular
mechanism of stress tolerance is complex and requires information at the omic level to understand
it effectively. In this regard, enormous progress has been made in the omics field in the areas of
genomics, transcriptomics, and proteomics. The emerging field of ionomics is also being employed
for investigating abiotic stress tolerance in wheat. Omic approaches generate a huge amount of
data, and adequate advancements in computational tools have been achieved for effective analysis.
However, the integration of omic-scale information to address complex genetics and physiological
questions is still a challenge. In this review, we have described advances in omic tools in the view
of conventional and modern approaches being used to dissect abiotic stress tolerance in wheat.
Emphasis was given to approaches such as quantitative trait loci (QTL) mapping, genome-wide
association studies (GWAS), and genomic selection (GS). Comparative genomics and candidate
gene approaches are also discussed considering identification of potential genomic loci, genes, and
biochemical pathways involved in stress tolerance mechanism in wheat. This review also provides
a comprehensive catalog of available online omic resources for wheat and its effective utilization.
We have also addressed the significance of phenomics in the integrated approaches and recognized
high-throughput multi-dimensional phenotyping as a major limiting factor for the improvement of
abiotic stress tolerance in wheat.
Keywords: Abiotic stresses, GWAS, Ionomics, Omics, Phenomics, QTL
Introduction
Wheat is one of the 3rd most cultivated cereal crop throughout the globe (Acevedo et al. 2002)
which covers 22% of the cultivating land. It belongs to the family of Gramineae (Poacea). It mainly
grows in the temperate zones with cool weather (12-25 0C temperature) and having 250-1750 mm
annual precipitation [1]. It is widely planted at the end of autumn season as it needs the cold
treatment for flower initiation, which is called vernalization process [2]. A recessive allele of Vrn
genes on 5A, 5B and 5D genomes is responsible to control this growth habit of winter wheat,
photoperiod are major factors to control the flowering pattern in wheat which lack photoperiod
insensitivity genes (Ppd) need exposure to long growing days [4].
Abiotic stress is one of the key factors limiting the crop production. Environmental stresses like
drought stress, salt stress, heavy metals stress as well as water submergence stress influenced the
crop yield in different manner. To overcome such problems, local cultivars should be modified by
making molecular changes in the gene [5]. Although the multi-selection field trials method has
been widely used for direct selection of the tolerant varieties to any harsh environment however,
this selection method doesn’t provide significant results for the abiotic stress related traits due to
highly influenced by environmental condition and low heritability [6]. In addition, this direct
selection approach is quite laborious as well as time consuming. The genetic variation in different
yielding crops could lead to the development of the tolerant cultivars but there is a knowledge gap
which needs strong effort to find the specific molecular marker [7]. The development of molecular
markers will provide the new and latest sequenced genomes and organelles in crops [8].
Recently, the development of molecular markers to characterize the complete genome sequence
plays a crucial role in marker-assisted breeding [9]. The availability of high density markers helps
to identify different alleles involved in agronomics traits and also helps in haplotype analysis [10].
In addition, marker-assisted breeding has been accomplished for the simple traits, which is
controlled by a single or fewer loci [11; 12] however, such breeding also suffers due to unsought
genetic strains [11]. The phenotypic expression of the newly developed gene (s) is controlled by
the genetic makeup of the repeated parents, which is mainly due to epistatic interaction [13], and
this epistatic interaction in mostly unpredictable in case of multiple complex traits, unless some
proper evidence is available about the molecular processes involved during the developments of
new traits. Current improvement in the genomics can easily predict the factors involved in their
genetic variation, traits developments, distribution as well as interaction with the host environment
[14]. Genetic Engineering is an advanced approach mainly used for the genetic enhancement of
the plants. Interestingly, genetically modified (GM) plants has been proven to be successful for
herbicide and insect tolerance, and widely used throughout the world [15]. A combination of
multi-disciplinary knowledge is required for the development of an ideal plants, which could provide
better yield even at adverse climatic conditions. This review has been written to explain the recent
achievements in various omics approaches and to elaborate the future outcomes for the
Technological advances have also provided a high-throughput, reliable, and quick array-based
genotyping platforms. The SNP array development require initial information about SNPs,
fortunately, information about millions of SNPs is already available in the public domain (Table
1). The Illumina Infinium array (SoySNP50K iSelect BeadChip) for ∼50,000 SNPs has been
successfully developed and used for the genotyping of several soybean plant introduction (PI) lines
[16]. Technological advances beyond this make it possible to resequence hundreds of lines in a
cost effective manner and has started a new era of genotyping by re-sequencing [17]. Now, the
challenge for plant biologists is how to effectively use these resources for marker-assisted
applications.
Omics approaches in technological era
When genetics, nutritional or environmental conditions is changed, diverse omics technologies
fulfil the understanding of all the changes that occur. Omics are useful in the understanding of
species and thus providing insight into modification of the plant metabolism which results through
contact with environment. The era of genomics had been started with the development of
automated sequencing methods and led to first whole genome sequencing of Arabidopsis thaliana
[122]. The genome sequencing has been stretched out to major crop plants such as rice [18; 19],
soybean [20], maize [21]. The emergence of highly throughput “Omics” approaches has begun a
successful period of plant molecular techniques for adjusting to changes in the environment.
Recent development in ‘omics’ after post genomic era such as next generation sequencing, genome
scale molecular analysis, modeling of different physiological and molecular understanding and
correlation of these observations with physiology of the plant provides an accomplished move to
adaptability and productivity under stress. Latest advent of next generation sequencing methods
made possible sequencing the plant species quite useful [22]. Allohexaploid bread wheat
(2n=6x=42, AABBDD genomes) is one of the complicated genomes in which homologous
chromosomes having similar genes could complicates the reconstructing process of biological
networks. A draft of wheat genome is completed which shows more than 124,000 gene loci which
covers all the sub-genomes (A, B, and D) and proves useful in identifying genes which control
biological process. Further, modern utilization of transcriptomics (RNA-seq) and proteomics
(targeted vs non-targeted proteins) will help in defining their functions at gene and protein level
respectively. As all genes are not always turned on at the same time therefore the metabolism
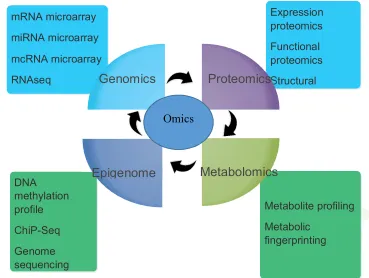
successful integration of the transcriptomics (gene), proteomics (proteins), metabolomics
(metabolite), ionomics (analysis of elemental compositions), epigenomics (inheritance),
interactomics (protein-protein or protein-DNA interactions) will facilitate the breeder to select the
potential candidates and best traits to generate and improve the crop productivity under abiotic
stress (Fig. 1).
Figure 1. Key branches of omics and their major components being used in different integrated approaches in wheat.
Genomics progresses for abiotic stress tolerance in wheat
Genomics emphasis on the genome physical structure, aiming to recognize, detect, and order
genomic structures along chromosomes. Here we discuss some of genomic progresses to
understand an abiotic stress tolerance in wheat.
Molecular marker resources
The emergence of genomic technology has opened a new window in genetic enhancement of more
complicated traits such as salt and drought tolerance. The amalgam of genomic approaches along
with marker assisted selection (MAS) can be helpful in the identification of specific genes at a
much fast rate in breeding population as compared to classical breeding [23, 24, 25, 26]. DNA
methylation profile
ChiP-Seq
Genome sequencing
Metabolite profiling
Metabolic fingerprinting mRNA microarray
miRNA microarray
mcRNA microarray
RNAseq
Expression proteomics
Functional proteomics
Structural proteomics Proteomics
Metabolomics Epigenome
Genomics
Developments in MAS for wheat was lagged behind due to limited genomic data but recent
progress in DNA sequencing and genotyping techniques have developed genome datasets which
are much useful in designing sequence based simple sequence repeats (SSRs) and SNP markers
[27, 28, 29]. SNPs are frequently used for genome mapping and germplasm characterization as
compared to other molecular markers. As SNPs are highly-throughput, rapid, cost-effective,
co-dominant, sequence tagged and highly abundant, they are appropriate for division of complex traits
using highly multiplexed marker microarrays such as the Affymetrix GeneChip [30, 29]. For
instance Axiom Wheat Breeders’ genotyping array, robust system for screening large wheat
population, is developed recently. It is a cost effective and efficient genotyping method having
35,143 pre-validated SNPs which covered all wheat chromosomes and have ability to genotype
384 samples at once. In duram wheat, it has been applied recently in the development linkage map
of high density and also in identifying the genomic areas of complex traits such as drought [31].
QTL Mapping for abiotic stress
For agronomically important traits, linkage maps are necessary for mapping the QTLs as they are
constructed from genotypic data from multiplexed marker assays [32-35]. High-density linkage
maps also offers a genomic resource for positional cloning of significant genes. They can also be
applied in comparative genomics to assess chromosomal organization and evolution as they are
constructed from sequence tagged markers. In the linkage map, markers are helpful in identifying
regions having QTLs of selected traits and several QTLs have mapped previously for salt tolerance
[36, 17, 35] and drought tolerance [37-39] in wheat cultivars (Table 1).
Advances in genomics and phenomics provide us more precise and broad characterization of the
QTLs that control a targeted trait known as QTLome. The vast knowledge on QTLome put a
responsibility on breeders to utilize this knowledge in effective way. Enhanced QTL
meta-analysis, valuation of QTL effects and upgraded crop modeling will allow an actual utilization of
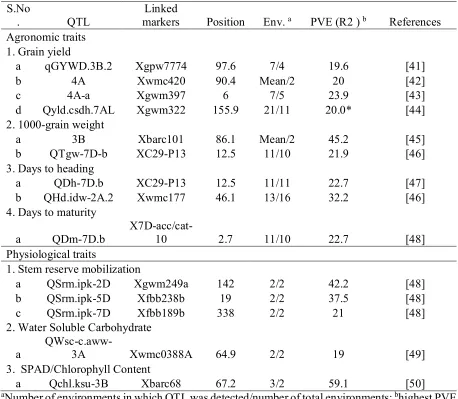
Table 1: Major and stable QTL with PVE ranging from 19% to 59% for agronomic and physiological traits
S.No
. QTL
Linked
markers Position Env. a PVE (R2 ) b References
Agronomic traits 1. Grain yield
a qGYWD.3B.2 Xgpw7774 97.6 7/4 19.6 [41]
b 4A Xwmc420 90.4 Mean/2 20 [42]
c 4A-a Xgwm397 6 7/5 23.9 [43]
d Qyld.csdh.7AL Xgwm322 155.9 21/11 20.0* [44]
2. 1000-grain weight
a 3B Xbarc101 86.1 Mean/2 45.2 [45]
b QTgw-7D-b XC29-P13 12.5 11/10 21.9 [46]
3. Days to heading
a QDh-7D.b XC29-P13 12.5 11/11 22.7 [47]
b QHd.idw-2A.2 Xwmc177 46.1 13/16 32.2 [46]
4. Days to maturity
a QDm-7D.b
X7D-acc/cat-10 2.7 11/10 22.7 [48]
Physiological traits
1. Stem reserve mobilization
a QSrm.ipk-2D Xgwm249a 142 2/2 42.2 [48]
b QSrm.ipk-5D Xfbb238b 19 2/2 37.5 [48]
c QSrm.ipk-7D Xfbb189b 338 2/2 21 [48]
2. Water Soluble Carbohydrate
a
QWsc-c.aww-3A Xwmc0388A 64.9 2/2 19 [49]
3. SPAD/Chlorophyll Content
a Qchl.ksu-3B Xbarc68 67.2 3/2 59.1 [50]
aNumber of environments in which QTL was detected/number of total environments; bhighest PVE
(R2 ) values under drought/water stress, * with >20% higher yield per ear.
Genome wide association studies
Alternative strategy to resist the shortcomings is association mapping based on traditional meiosis
in the divergence analysis and gives accurate results [51]. It is quite feasible and cost effective to
establish association mapping in comparison to RIL development. In association mapping,
experimental structures and statistical evaluation is constantly fluctuating to diminish the results
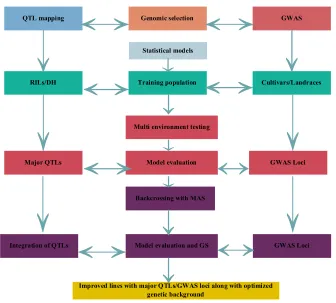
of confounding factors, decrease false positives and also control minor allele effects (Fig. 2).
Genetic interaction and population designs confuse marker-trait relations results in the
several diagnostic and precise statistical analyses have been developed. Studies have been carried
out on the correct genomic locations of developing genes such as reduced height (Rht),
vernalization (Vrn), and photoperiod responsiveness (Ppd) and used as standard measure in order
to incorporate phenotypic diversity and markers present in the study [3]. As genetic reference,
these genes possess the stress adaptive capability by changes heading date, plant height, maturity
Figure 2. Combined approach of QTL mapping/Genome-wide association study (GWAS) and Genomic selection (GS).
Genomic selection
The emergence of model based association and easy availability of molecular markers, a correlated
concept known as genomic selection has emerged to assess genotypic breeding value [54]. This
technique is utilized to minimize the shortcomings of map based genetic analysis that identify very
few QTL to explicate the divergence in targeted traits [54, 123]. The concrete significance of
evaluated QTL effect and linkage disequilibrium based on the genetic relatedness and divergence
of the population under study. Populations that shows more allelic variants of targeted traits display
more precise evaluation of QTL effect compared to populations which are more closely related.
Linkage disequilibrium is often overvalued in closely related inter-mating individuals and diminish
Major QTLs Model evaluation GWAS Loci
Cultivars/Landraces
RILs/DH Training population
Statistical models
QTL mapping Genomic selection GWAS
Multi environment testing
Integration of QTLs Model evaluation and GS GWAS Loci Backcrossing with MAS
in further meiotic events [55]. Genomic breeding value can be predicted by genomic selection by
transforming marker assisted selection with the help of markers. A model that is established and
evaluated using genotypic and phenotypic data of study population will be utilized to assess
phenotypic variation of sample population based on their genetic composition only. This will
enhance genetic gain in comparison to both QTL and phenotype-based selection [56].
Statistical methods are used to develop genomic selection models that explains the properties of
various markers and traits [57, 123]. The distribution of marker effects and random sampling of
germplasm from selected population is being considered by the multiple regression models [58].
Genomic best linear unbiased prediction evaluates genetic relatedness among individuals on the
basis of molecular marker composition similarity and also assess their phenotypic performance.
Such a model is similar to estimation of breeding value (BV) from heritability and phenotypic
performance of related genotypes in a pedigree [54, 123]. Statistical analyses shows that forward
and mixed type regression models have ability to remove markers on the basis of their relative
significance effect. Ridge regression have an additional feature of incorporating penalty parameter
in the design for the markers in excess of statistically accepted number (> number of genotypes)
[59].
Transcriptome profiling for abiotic stress tolerance
In wheat, expressed sequence tag databases showed that homologous genes can show expression
in one but remain silent in one or both of the remaining genomes in the analysis of gene expression
[60]. For the cereals, various microarray and macroarray platforms have been developed. There
are various significant arrays like 10000 cDNA array reported by Leader [61] and Affymatrix
arrays have been developed for wheat and barley recently [62]. In abiotic stress conditions in
variety of plants, microarray is one of the successful method for the genome wide transcript
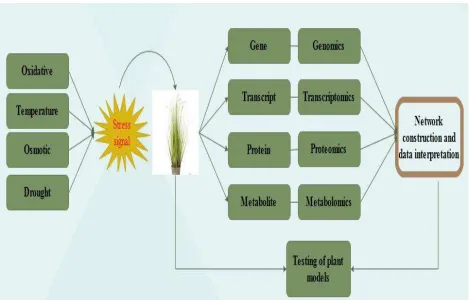
expression profiling and is being widely used to generate transcriptional profiles (Fig. 3). Studies
have been carried out in barely in response to salt stress [63, 64] and the model cereal
Brachypodium [65] but there are limited research on wheat due to polyploidy genome [66]. The
high-throughput analyses of gene expression is being enabled by deep genome sequencing
technology (RNA-Seq) which proves to be successful technique to identify precise changes in the
genome. Next-generation sequencing technology is in the emerging phase in plant studies but it is
predicted to replace microarray technique due to its accurate results. Due to lack of fully sequenced
et al. [67] assessed alkalinity stress by digital expression tag profiling method in wheat.
Poersch-Bortolon et al. [68] assessed the extreme drought stress in roots and leaves by examining their
expression profiles which prove to be helpful in marker development and selecting the significant
important genes. These expression profiles are also prove useful in wheat drought stress by
examining their metabolic processes. Ma et al. [69] conducted an RNA-seq analysis to analyze the
effect of drought on wheat genome during reproductive stages. Salt stress responsive gene
networks and functional annotation was identified by differential root transcriptome analysis
which prove to be helpful in understanding the process and genes role in salt tolerance as analyzed
by Goyal et al. [70].
Figure 3: General outline of ‘omics’ approach for network construction, data interpretation and model testing.
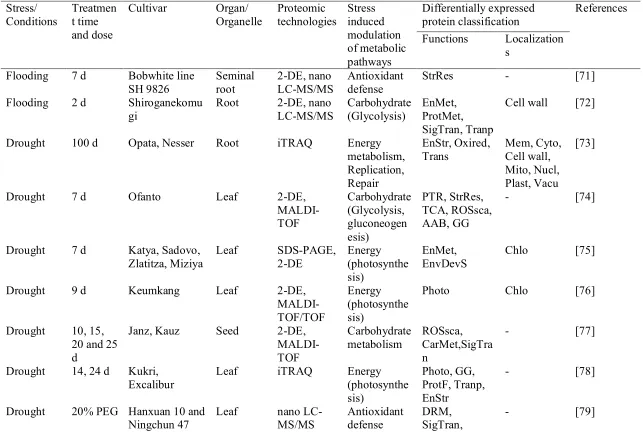
Proteomics in wheat
It is imperative to study proteome alterations at various stress conditions as proteins play a role in
stress sensing and signaling processes. In order to understand the stress coping mechanisms in
plant, effective characterization and isolation of stress responsive proteins is required step.
Understanding of post-translational modification of proteins is necessary in plant stress conditions.
Study of proteomics provides vast information on the fine-tuning of cellular pathways that once
took part in stress mitigation. The significant data related to changes in response to abiotic stress
Stress/ Conditions
Treatmen t time and dose
Cultivar Organ/ Organelle Proteomic technologies Stress induced modulation of metabolic pathways Differentially expressed protein classification References
Functions Localization s
Flooding 7 d Bobwhite line SH 9826 Seminal root 2-DE, nano LC-MS/MS Antioxidant defense
StrRes - [71]
Flooding 2 d Shiroganekomu gi
Root 2-DE, nano LC-MS/MS Carbohydrate (Glycolysis) EnMet, ProtMet, SigTran, Tranp
Cell wall [72]
Drought 100 d Opata, Nesser Root iTRAQ Energy metabolism, Replication, Repair EnStr, Oxired, Trans Mem, Cyto, Cell wall, Mito, Nucl, Plast, Vacu [73]
Drought 7 d Ofanto Leaf 2-DE,
MALDI-TOF Carbohydrate (Glycolysis, gluconeogen esis) PTR, StrRes, TCA, ROSsca, AAB, GG
- [74]
Drought 7 d Katya, Sadovo, Zlatitza, Miziya
Leaf SDS-PAGE, 2-DE Energy (photosynthe sis) EnMet, EnvDevS
Chlo [75]
Drought 9 d Keumkang Leaf 2-DE,
MALDI-TOF/TOF
Energy (photosynthe sis)
Photo Chlo [76]
Drought 10, 15, 20 and 25 d
Janz, Kauz Seed 2-DE, MALDI-TOF Carbohydrate metabolism ROSsca, CarMet,SigTra n
- [77]
Drought 14, 24 d Kukri, Excalibur
Leaf iTRAQ Energy
(photosynthe sis)
Photo, GG, ProtF, Tranp, EnStr
- [78]
Drought 20% PEG Hanxuan 10 and Ningchun 47
Leaf nano LC-MS/MS
Antioxidant defense
DRM, SigTran,
Heat and Drought
10 d Vinjett Kernel 2-DE,
MALDI-TOF Carbohydrate (Glycolysis) CarboMet, STP
- [80]
High Temperatur e 37°C d, 28°C N/10 d, 20 d
Butte 86 Endosper m 2-DE, QSTAR PULSAR-TOF Carbohydrate metabolism CarboMet, NitMet, ProtMet, StrRes, STP, SigTran, Tranp, Trans
- [81]
Salt 150 mM
NaCl/1 d, 2 d, 3 d
Keumkang Leaf 2-DE,
LTQ-FTICR-MS
Energy (photosynthe sis)
Photo, StrRes Chlo [82]
Salt 1.0, 1.5, 2.0 and 2.5% NaCl in HS/2 d
Zhenhmai 9023 Leaf 2D- DIGE/Q-TOF-MS Carbohydrate metabolism CarMet, ProtF, Tranp, ROS, ATP
- [83]
Salt 200 mM Wyalkatchem, Janz
Shoot 2-DE, LC-MS/MS
- - Mito [84]
Aluminum 250 µM/2 d, 3 d
Atlas-66, Fredrick
Root SDS-PGE, Immunoblot
Signaling pathway
Oxi - [85]
Aluminum 100, 150 µM/5 d
Keumkang Root 2-DE,
LTQ-FTICR-MS Energy (Glycolysis) Gly, Tranp, SigTran, StrRes, EnMet
- [86]
Copper 100 µM/3 d
Yumai 34 Root, Leaf 2-DE, HPLC- Chip/ESI- Q-TOF/MS/M S Energy (photosynthe sis), antioxidant defense StrRes, SigTran, ProtMet, CarMet, Photo, EnMet
AAB- Amino acid biosynthesis; ATP-ATP synthase; CarMet-Carbohydrate metabolism; CGD-Cell growth and division; COB- Cell organization; COD-Cellular organization and development; DevPro-Developmental process; DRM-DNA and RNA metabolism; EnMet- Energy metabolism; EnStr-Environmental stress; EnvDevs-Environmental and developmental signals; GG-Glycolysis and gluconeogenesis; Gly-Glycolysis; NitMet-Nitrogen metabolism; Oxi- Oxidative stress; OxiRed-Oxidation-reduction process; Photo-Photosynthesis; ProtF-Protein folding; ProtMet-Protein metabolism; ProtS-Protein synthesis; PTR-Post-transcriptional regulations; ROSsca-ROS scavenging; SigTran-Signal transduction; STP- Storage proteins; StrRes-Stress response; TCA- Calvin cycle; Tranp-Transport, Trans-Translation; Chlo-Chloroplast; Mem-Membrane; Cyto-Cytoplasm; Nucl-Nucleus; Mito-Mitochondria; Plast-Plastid; Vacu-Vacuole; HS-Hoagland solutin
FTICR sis) ProtMet,
StrRes, Tranp, Trans
Protein Profiling
Mature seed
Wild type (AA, BB, DD
genome)
Seed SDS-PAGE, nano LC-MS/MS
Carbohydrate metabolism
StrRes, EnMet, ProtS, CGD, COD, ProtF, SigTran, STP, Tranp
- [89]
Cadmium 10, 100, and 200 µM
Yangmai 15 Leaf IPG, MALDI-TOF
Energy (photosynthe sis)
Oxi, ProtMet, Photo
- [90]
Cadmium 0.5mM/L Yangmai 13 Leaf IPG, MALDI-TOF
Antioxidant defense
Metabolomics advances for abiotic stress
Metabolites provides the energy which is necessary for metabolism and growth of protoplasm as
they are basic elements of various structural and enzymatic molecules. Metabolites not only serve
as a link between phenotype and genetic information but also play a role in determining the
physiological condition of organism. Metabolomics along with other disciplines played a
significant role in understanding the inter-related biological processes linked to phenotypes. In
functional genomics, metabolic profiling is an emergent tool [92]. The co-existence of gene
transcript and metabolites provides a foundation for generating data-driven theoretical models of
the biological phenomenon [93-95]. In the study of mutants and transgenic lines, metabolomics
not only help in understanding metabolic systems but also give information about candidate gene
[96-98]. The metabolic study also explains that how some particular gene effects metabolic
pathway and its intervention with other pathways which is not possible with other techniques such
as microarray [99, 100].
The advances in metabolomics, the availability of whole genome sequence, genome-wide genetic
variants, and cost-effective genotyping assays has opened exciting doors to blend metabolomics
with crop breeding programs [101, 102]. Mass spectrometry (MS) and nuclear magnetic resonance
(NMR) spectrometry proved to be successful technologies. Metabolomics cover not only familiar
metabolites but also unfamiliar metabolites as confirmed by wide scale metabolite assessments.
But managing the ample data is still a challenge [103, 104]. Metabolic annotation can be
progressed through metabolomics approaches when coupled with advance bioinformatics
techniques, for instance, the one for model plant Arabidopsis [105, 106]. Genomic data can also
be improved through the sequencing of DNA, RNA, and MS quantification of proteins and
metabolites which helped in the improving of targeted traits [107]. A number of studies have been
conducted on agriculturally useful crops to evaluate the effect of salinity and drought on metabolic
activity of crop as metabolic study are helpful in studying stress responses [108, 109]. The enhance
tolerance of some particular gene may be due to different phenotypic responses which explains the
specific metabolic changes. Improvement of breeding material and selection of higher traits can
be facilitated through metabolomics approaches [110]. In bread wheat genome, the polyploidy
nature is quite distinctive as it has ability to tolerate considerable chromosomal aberrations and
allowing phenotypic assessment as a result of multiple gene loss. Aneuploidy genetic lines of
identifying those genes which control phenotypes [111, 112]. Michaletti et al. [113] concluded
that the study of metabolomics and proteomics reveal drought stress responses of leaf tissue from
spring wheat and provide a better framework for understanding the mechanisms that command
plant cell response to drought stress with knowledge of molecules that can be used for crop
improvement programs.
Ionomics for wheat
Ionomics is a high-throughput elemental profiling approach to study the molecular mechanistic
basis underlying mineral nutrient and trace element composition of living organism. It also
represents the inorganic component of cellular and organismal systems [114]. Its wide role in
forward and reverse genetics, screening of mutants, uncovering the mechanisms of ion uptake,
compartmentalization, transport and exclusion, useful in understanding the processes of abiotic
stresses in plants [115]. Ionomics along with relevant genomic data can identify the cellular
changes during abiotic stresses and the basic processes involved as well. Ionomics are also helpful
in identifying rare genes which code for ions by using phenotypic and genotypic data as obtained
from mapping populations. It is prove to be helpful in understanding the gene networks which
control ion accumulation at varied growth steps under the conditions of abiotic stress [116]. The
literature available on ionomics approaches is limited, however, the highly effective ion profiling
will open new doors in understanding the signaling mechanism for abiotic stress tolerance.
Phenomics prospective in wheat
Phenomics is a study of high-throughput phenotypic analysis. It has become possible to predict
abiotic stress genotypes through phenotyping approaches [117]. For high throughput plant
phenotyping, the automated Greenhouse system is a successful procedure. This system permits the
non-destructive screening of plants over a particular period with the help of image acquisition
techniques. The different images of each plant are recorded and then evaluated using advanced
image analysis algorithms to predict plant with certain phenotypes [118]. The plant with tolerant
phenotypes proved to be best sources of genomic resources and also became target for different
molecular approaches including the high-throughput sequencing to identify the alleles of interest.
However, phenomics also have some disadvantages as it did not provide accurate correlation
among the values obtained in the pot culture versus field experiment.
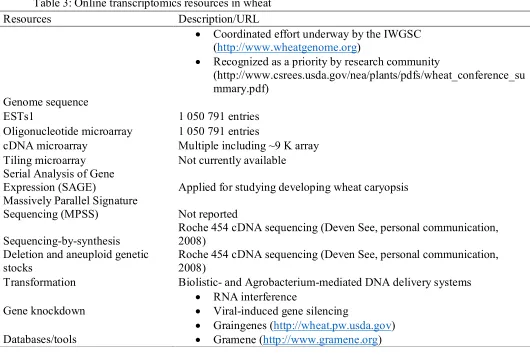
The emerging progress in the omic approaches has established a huge data which prove to be
helpful in number of research activities. Computational resources have helped to store, catalog and
analyze data and make it easily available through user friendly “databases.”
A number of databases have developed for wheat (Table 3). The most reliable database is
(http://www.gramene.org) which gives wide information for omics data from number of other
sources. These databases provide useful information regarding wheat translational genomics and
molecular breeding research. It contains information of genes, proteins, microRNAs, sRNAs,
metabolites, molecular markers, and phenomic information of soybean plant introductions (PI).
Integration of multi-omics datasets information are also present in these databases. For example,
genes in the QTL region can be retrieved very easily along with the functional annotations,
associated protein information in respect of structure and functional features, syntenic information
with other model plants, sequence variation among different cultivars, gene expression data
including tissue specific variations and many other types of information for wheat.
Table 3: Online transcriptomics resources in wheat
Resources Description/URL
Genome sequence
Coordinated effort underway by the IWGSC (http://www.wheatgenome.org)
Recognized as a priority by research community
(http://www.csrees.usda.gov/nea/plants/pdfs/wheat_conference_su mmary.pdf)
ESTs1 1 050 791 entries
Oligonucleotide microarray 1 050 791 entries
cDNA microarray Multiple including ~9 K array Tiling microarray Not currently available Serial Analysis of Gene
Expression (SAGE) Applied for studying developing wheat caryopsis Massively Parallel Signature
Sequencing (MPSS) Not reported
Sequencing-by-synthesis
Roche 454 cDNA sequencing (Deven See, personal communication, 2008)
Deletion and aneuploid genetic stocks
Roche 454 cDNA sequencing (Deven See, personal communication, 2008)
Transformation Biolistic- and Agrobacterium-mediated DNA delivery systems
Gene knockdown
RNA interference
Viral-induced gene silencing
Databases/tools
TIGR Genome Database (http://www.tigr.org/tdb/e2k1/tae1) Wheat Genome Project
(http://wheat.pw.usda.gov/NSF/htmlversion.html) Wheat Genome Project
(http://wheat.pw.usda.gov/NSF/htmlversion.html) wEST (http://wheat.pw.usda.gov/wEST)
CerealsDB (http://www.cerealsdb.uk.net) HarvEST Wheat (http://harvest.ucr.edu) PLEXdb (http://plexdb.org)
Gene Expression Omnibus (http://www.ncbi.nlm.nih.gov/geo) ArrayExpress (http://www.ebi.ac.uk/microarray-as/ae)
GrainSAGE (http://www.scu.edu.au/research/cpcg/igfp/index.php) Wheat SNP Project
(http://wheat.pw.usda.gov/SNP/new/index.shtml) [121]
Conclusion and future perceptive
Different omics tools have been employed to understand how soybean plants respond to abiotic
stress conditions. We realize that the studies to integrate multiple omics approaches are limiting in
soybean due to the increased cost and potential challenging integrated omic scale analysis. Recent
developments in computational resources, statistical tools, and instrumentation have lowered the
cost of omics in many folds but integrated analysis needs novel tools and technical wizards. The
comprehensive nature of multiomic studies provides an entirely new avenue and future research
programs should plan to adapt accordingly. In soybean, genomics and transcriptomics have
progressed as expected but the other major omic branches like proteomics, metabolomics, and
phenomics are still lagging behind. These omic branches are equally important to get clear picture
of the biological system. Notably, phenomic studies need to be extensively employed along with
the other omics approaches. Desired phenotype is ultimate aim of crop sciences; therefore it needs
to be understood intensely. Different omic tools and integrated approaches discussed in the present
review will provide glimpses of current scenarios and future perspectives for the effective
management of abiotic stress tolerance in soybean.
A major focus in the future will be the merging and comparative analysis of transcriptome data
between researchers. In particular, there are large resources of wheat microarray data now
available, which provide opportunities for gene coexpression network analysis. The merging of
data derived from a standardized platform, such as the Affymetrix Wheat GeneChip, will be much
four studies of the wheat transcriptional response to rust pathogens using the Affymetrix Wheat
GeneChip platform. The data from these four studies will be integrated to perform a gene
coexpression network analysis that has the potential to identify key gene expression signatures
involved in rust resistance. This type of analysis has been successful in associating abiotic stress
phenotypes in A. thaliana with underlying common and unique gene expression pathways and
marker genes [115]. The linking of gene expression data to genetic information is also of great
importance to understand the interplay among genome, transcriptome and phenotype.
Simultaneous surveying of the genome and transcriptome on a single platform through, for
example, the ELPs and SFPs discussed earlier, is a valuable technique for uncovering genetic
elements that influence the transcriptome. Overall, wheat transcriptomics is progressing rapidly
and in the future we will see a complete systematical approach that integrates the transcriptome
with genome, proteome and metabolome. Additionally, gene expression databases will expand and
become more standardized, which will accelerate the discovery and characterization of all genes
in the wheat genome.
Acknowledgments
We are very thankful to all staff of Oil Crops Research Institute, Wuhan for their support and
motivation. This research was funded by the National Key Research and Development Program
of China (2017YFD0101700), the National Natural Science Foundation of China (31301361,
31171589).
Author’s contribution
TS wrote the manuscript, JX help in literature XZ helped in making diagrams and XZ read the
paper
Conflict of Interest
The authors declare that they have no conflict of interest.
References
58. Nadaf, J., Riggio, V., Yu, T. P., & Pong-Wong, R. (2012, December). Effect of the prior distribution of SNP effects on the estimation of total breeding value. In BMC proceedings(Vol. 6, No. 2, p. S6). BioMed Central.
59. Ogutu, J. O., Schulz-Streeck, T., & Piepho, H. P. (2012, December). Genomic selection using regularized linear regression models: ridge regression, lasso, elastic net and their extensions. In BMC proceedings (Vol. 6, No. 2, p. S10). BioMed Central.
Robinson SJ, Cram DJ, Lewis CT, Parkin IAP. Maximizing the efficacy of SAGE analysis identifies novel transcripts in arabidopsis(1[w]). Plant Physiology 2004;136(2):3223–33. 25. Hussain, B. (2015). Modernization in plant breeding approaches for improving biotic stress
resistance in crop plants. Turkish Journal of Agriculture and Forestry, 39(4), 515-530. 22. Weckwerth, W. (2011). Green systems biology—from single genomes, proteomes and
metabolomes to ecosystems research and biotechnology. Journal of Proteomics, 75(1), 284-305.
29. Akpinar, B. A., Lucas, S., & Budak, H. (2017). A large-scale chromosome-specific SNP discovery guideline. Functional & integrative genomics, 17(1), 97-105.
31. Lucas, S. J., Salantur, A., Yazar, S., & Budak, H. (2017). High-throughput SNP genotyping of modern and wild emmer wheat for yield and root morphology using a combined association and linkage analysis. Functional & integrative genomics, 17(6), 667-685.
34. Lorieux, M. (2012). MapDisto: fast and efficient computation of genetic linkage maps. Molecular Breeding, 30(2), 1231-1235.
40. Salvi, S., & Tuberosa, R. (2015). The crop QTLome comes of age. Current opinion in biotechnology, 32, 179-185.
55. Korte, A., and Farlow, A. (2013). The advantages and limitations of trait analysis with GWAS: a review. Plant Methods 9, 29.
57. Jannink, J. L., Lorenz, A. J., & Iwata, H. (2010). Genomic selection in plant breeding: from theory to practice. Briefings in functional genomics, 9(2), 166-177.
65. Kim, D. Y., Hong, M. J., Jang, J. H., & Seo, Y. W. (2012). cDNA-AFLP analysis reveals differential gene expression in response to salt stress in Brachypodium distachyon. Genes & Genomics, 34(5), 475-484.
61. Leader, D. J. (2005). Transcriptional analysis and functional genomics in wheat. Journal of Cereal Science, 41(2), 149-163.
60. Mochida, K., Yamazaki, Y., & Ogihara, Y. (2004). Discrimination of homoeologous gene expression in hexaploid wheat by SNP analysis of contigs grouped from a large number of expressed sequence tags. Molecular Genetics and Genomics, 270(5), 371-377.
63. Ueda, A., Kathiresan, A., Bennett, J., & Takabe, T. (2006). Comparative transcriptome analyses of barley and rice under salt stress. Theoretical and Applied Genetics, 112(7), 1286-1294.
73. Alvarez, S., Roy Choudhury, S., & Pandey, S. (2014). Comparative quantitative proteomics analysis of the ABA response of roots of drought-sensitive and drought-tolerant wheat varieties identifies proteomic signatures of drought adaptability. Journal of proteome research, 13(3), 1688-1701.
72. Kong, F. J., Oyanagi, A., & Komatsu, S. (2010). Cell wall proteome of wheat roots under flooding stress using gel-based and LC MS/MS-based proteomics approaches. Biochimica et Biophysica Acta-Proteins and Proteomics, 1804(1), 124-136.
78. Ford, K. L., Cassin, A., & Bacic, A. F. (2011). Quantitative proteomic analysis of wheat cultivars with differing drought stress tolerance. Frontiers in plant science, 2, 44.
84. Jacoby, R. P., Millar, A. H., & Taylor, N. L. (2010). Wheat mitochondrial proteomes provide new links between antioxidant defense and plant salinity tolerance. Journal of proteome research, 9(12), 6595-6604.
90. Wang, Y., Hu, H., Xu, Y., Li, X. X., & Zhang, H. J. (2011). Differential proteomic analysis of cadmium-responsive proteins in wheat leaves. Biologia Plantarum, 55(3), 586-590. 98. Hong, J., Yang, L., Zhang, D., & Shi, J. (2016). Plant metabolomics: an indispensable system
biology tool for plant science. International journal of molecular sciences, 17(6), 767. 93. Saito, K., & Matsuda, F. (2010). Metabolomics for functional genomics, systems biology, and
biotechnology. Annual review of plant biology, 61, 463-489.
85. Delisle, G., Champoux, M., & Houde, M. (2001). Characterization of oxalate oxidase and cell death in Al-sensitive and tolerant wheat roots. Plant and Cell Physiology, 42(3), 324-333. 94. Saito, K., Hirai, M. Y., & Yonekura-Sakakibara, K. (2008). Decoding genes with coexpression networks and metabolomics–‘majority report by precogs’. Trends in plant science, 13(1), 36-43.
100. Kusano, M., & Saito, K. (2012). Role of metabolomics in crop improvement. Journal of Plant Biochemistry and Biotechnology, 21(1), 24-31.
97. Yonekura-Sakakibara, K., & Saito, K. (2006). Review: genetically modified plants for the promotion of human health. Biotechnology letters, 28(24), 1983-1991.
102. Fernie, A. R., & Schauer, N. (2009). Metabolomics-assisted breeding: a viable option for crop improvement. Trends in Genetics, 25(1), 39-48.
96. Fernie, A. R. (2003). Metabolome characterization in plant system analysis. Functional Plant Biology, 30(1), 111-120.
104. Lei, Z., Huhman, D. V., & Sumner, L. W. (2011). Mass spectrometry strategies in metabolomics. Journal of Biological Chemistry, 286(29), 25435-25442.
105. Tohge, T., & Fernie, A. R. (2009). Web-based resources for mass-spectrometry-based metabolomics: a user’s guide. Phytochemistry, 70(4), 450-456.
109. Obata, T., & Fernie, A. R. (2012). The use of metabolomics to dissect plant responses to abiotic stresses. Cellular and Molecular Life Sciences, 69(19), 3225-3243.
108. Urano, K., Kurihara, Y., Seki, M., & Shinozaki, K. (2010). ‘Omics’ analyses of regulatory networks in plant abiotic stress responses. Current opinion in plant biology, 13(2), 132-138.
116. Shelden, M. C., & Roessner, U. (2013). Advances in functional genomics for investigating salinity stress tolerance mechanisms in cereals. Frontiers in plant science, 4, 123.
118. Tuberosa, R. (2012). Phenotyping for drought tolerance of crops in the genomics era. Frontiers in physiology, 3, 347.
121. International Wheat Genome Sequencing Consortium. (2014). A chromosome-based draft sequence of the hexaploid bread wheat (Triticum aestivum) genome. Science, 345(6194), 1251788.
111. Endo, T. R., & Gill, B. S. (1996). The deletion stocks of common wheat. Journal of Heredity, 87(4), 295-307.
122. Arabidopsis Genome Initiative. (2000). Analysis of the genome sequence of the flowering plant Arabidopsis thaliana. Nature, 408(6814), 796.
2. Santra, D.; Santra, M.; Allan, R.; Campbell, K.; & Kidwell, K. Genetic and molecular characterization of vernalization genes Vrn‐A1, Vrn‐B1, and Vrn‐D1 in spring wheat germplasm from the Pacific Northwest region of the U.S.A. Plant Breeding. 2009, 28, 576–584.
3. Gomez, D.; Vanzetti, L.; Helguera, M.; Lombardo, L; Fraschina, J.; and Miralles, D.J. Effect of Vrn-1, Ppd-1 genes and earliness per se on heading time in Argentinean bread wheat cultivars. Field Crops Research. 2014, 158, 73-81.
4. Goncharov, N. P. Genetics of growth habit (spring vs winter) in common wheat: confirmation of the existence of dominant gene Vrn4. Theoretical and Applied Genetics, 2003, 107(4), 768-772.
5. Grainger, C. M.; & Rajcan, I. Characterization of the genetic changes in a multi-generational pedigree of an elite Canadian soybean cultivar. Theoretical and applied genetics, 2014, 127(1), 211-229.
6. Manavalan, L. P.; Guttikonda, S. K.; Phan Tran, L. S.; & Nguyen, H. T. Physiological and molecular approaches to improve drought resistance in soybean. Plant and Cell Physiology, 2009, 50(7), 1260-1276.
7. Xu, X.; Liu, X.; Ge, S.; Jensen, J. D.; Hu, F.; Li, X.; ... & Li, J. Resequencing 50 accessions of cultivated and wild rice yields markers for identifying agronomically important genes. Nature biotechnology, 2012, 30(1), 105.
8. Tomar, R. S. S.; Deshmukh, R. K.; Naik, K.; Tomar, S. M. S.; and Vinod. Development of chloroplast−specific microsatellite markers for molecular characterization of alloplasmic lines and phylogenetic analysis in wheat. Plant Breed, 2014, 133, 12–18.
9. Song, Q.; Jia, G.; Zhu, Y.; Grant, D.; Nelson, R. T.; Hwang, E. Y.; et al. Abundance of SSR motifs and development of candidate polymorphic SSR markers (BARCSOYSSR_1. 0) in soybean. Crop Sci, 2010, 50, 1950–1960.
10. Tardivel, A.; Sonah, H.; Belzile, F.; and O'Donoughue, L. S. Rapid identification of alleles at the soybean maturity gene E3 using genotyping by sequencing and a haplotype-based approach. Plant Genome, 2014, 7, 1–9.
11. Shi, A.; Chen, P.; Li, D.; Zheng, C.; Zhang, B.; and Hou, A. Pyramiding multiple genes for resistance to soybean mosaic virus in soybean using molecular markers. Mol. Breed, 2009, 23, 113–124.
12. Jun, T. H.; Mian, M. R.; Kang, S. T.; and Michel, A. P. Genetic mapping of the powdery mildew resistance gene in soybean PI 567301B. Theor. Appl. Genet, 2012, 125, 1159– 1168.
13. Palloix, A.; Ayme, V.; and Moury, B. Durability of plant major resistance genes to pathogens depends on the genetic background, experimental evidence and consequences for breeding strategies. New Phytol, 2009, 183, 190–199.
14. Morrell, P. L.; Buckler, E. S.; and Ross-Ibarra, J. Crop genomics: advances and applications. Nat. Rev. Genet, 2011, 13, 85–96.
17. Xu, Y.; Li, S.; Li, L.; Zhang, X.; Xu, H.; & An, D. Mapping QTLs for salt tolerance with additive, epistatic and QTL× treatment interaction effects at seedling stage in wheat. Plant Breeding, 2013, 132(3), 276-283.
18. Goff, S. A.; Ricke, D.; Lan, T. H.; Presting, G.; Wang, R.; Dunn, M.; ... & Hadley, D. A draft sequence of the rice genome (Oryza sativa L. ssp. japonica). Science, 2002, 296(5565), 92-100.
19. Yu, J.; Hu, S.; Wang, J.; Wong, G. K. S.; Li, S.; Liu, B.; ... & Cao, M. A draft sequence of the rice genome (Oryza sativa L. ssp. indica). Science, 2002, 296(5565), 79-92.
20. Schmutz, J.; Cannon, S. B.; Schlueter, J.; Ma, J.; Mitros, T.; Nelson, W.; ... & Xu, D. Genome sequence of the palaeopolyploid soybean. Nature, 2010, 463(7278), 178.
21. Schnable, P. S.; Ware, D.; Fulton, R. S.; Stein, J. C.; Wei, F.; Pasternak, S.; ... & Minx, P. The B73 maize genome: complexity, diversity, and dynamics. Science, 2009, 326(5956), 1112-1115.
23. Castillo, A., Budak, H., Varshney, R. K., Dorado, G., Graner, A., & Hernandez, P. (2008). Transferability and polymorphism of barley EST-SSR markers used for phylogenetic analysis in Hordeum chilense. BMC plant biology, 8(1), 97.
24. Vogel, J. P., Tuna, M., Budak, H., Huo, N., Gu, Y. Q., & Steinwand, M. A. (2009). Development of SSR markers and analysis of diversity in Turkish populations of Brachypodium distachyon. BMC plant biology, 9(1), 88.
26. Saade, S., Maurer, A., Shahid, M., Oakey, H., Schmöckel, S. M., Negrão, S., ... & Tester, M. (2016). Yield-related salinity tolerance traits identified in a nested association mapping (NAM) population of wild barley. Scientific reports, 6, 32586.
27. Filiz, E., Ozdemir, B. S., Budak, F., Vogel, J. P., Tuna, M., & Budak, H. (2009). Molecular, morphological, and cytological analysis of diverse Brachypodium distachyon inbred lines. Genome, 52(10), 876-890.
28. Lucas, S. J., Šimková, H., Šafář, J., Jurman, I., Cattonaro, F., Vautrin, S., ... & Budak, H. (2012). Functional features of a single chromosome arm in wheat (1AL) determined from its structure. Functional & integrative genomics, 12(1), 173-182.
30. Winfield, M. O., Allen, A. M., Burridge, A. J., Barker, G. L., Benbow, H. R., Wilkinson, P. A., ... & Pirani, A. (2016). High‐density SNP genotyping array for hexaploid wheat and its secondary and tertiary gene pool. Plant biotechnology journal, 14(5), 1195-1206. 32. Peleg, Z., Cakmak, I., Ozturk, L., Yazici, A., Jun, Y., Budak, H., ... & Saranga, Y. (2009).
Quantitative trait loci conferring grain mineral nutrient concentrations in durum wheat× wild emmer wheat RIL population. Theoretical and Applied Genetics, 119(2), 353-369. 33. Leonforte, A., Sudheesh, S., Cogan, N. O., Salisbury, P. A., Nicolas, M. E., Materne, M., ... &
Kaur, S. (2013). SNP marker discovery, linkage map construction and identification of QTLs for enhanced salinity tolerance in field pea (Pisum sativum L.). BMC plant biology, 13(1), 161.
35. Masoudi, B., Mardi, M., Hervan, E. M., Bihamta, M. R., Naghavi, M. R., Nakhoda, B., & Amini, A. (2015). QTL mapping of salt tolerance traits with different effects at the seedling stage of bread wheat. Plant molecular biology reporter, 33(6), 1790-1803.
38. Budak, H., Hussain, B., Khan, Z., Ozturk, N. Z., & Ullah, N. (2015). From genetics to functional genomics: improvement in drought signaling and tolerance in wheat. Frontiers in plant Science, 6, 1012.
39. Sheoran, S., Malik, R., Narwal, S., Tyagi, B. S., Mittal, V., Kharub, A. S., ... & Sharma, I. (2016). Genetic and molecular dissection of drought tolerance in wheat and barley. J Wheat Res, 7, 1-13.
41. Shukla, S.; Singh, K.; Patil, R.V.; Kadam, S.; Bharti, S.; Prasad, P.; Singh, N.K.; Khanna-Chopra, R. Genomic regions associated with grain yield under drought stress in wheat (Triticum aestivum L.). Euphytica 2015, 203, 449–467.
42. Kirigwi, F.M.; Van Ginkel, M.; Brown-Guedira, G.; Gill, B.S.; Paulsen, G.M.; Fritz, A.K. Markers associated with a QTL for grain yield in wheat under drought. Mol. Breed. 2007, 20, 401–413.
43. Pinto, R.S.; Reynolds, M.P.; Mathews, K.L.; McIntyre, C.L.; Olivares-Villegas, J.J.; Chapman, S.C. Heat and drought adaptive QTL in a wheat population designed to minimize confounding agronomic effects. Theor. Appl. Genet. 2010, 121, 1001–1021.
44. Quarrie, S.A.; Pekic Quarrie, S.; Radosevic, R.; Rancic, D.; Kaminska, A.; Barnes, J.D.; Leverington, M.; Ceoloni, C.; Dodig, D. Dissecting a wheat QTL for yield present in a range of environments: From the QTL to candidate genes. J. Exp. Bot. 2006, 57, 2627– 2637.
45. Golabadi, M.; Arzani, A.; Mirmohammadi Maibody, S.A.M.; Tabatabaei, B.E.S.; Mohammadi, S.A. Identification of microsatellite markers linked with yield components under drought stress at terminal growth stages in durum wheat. Euphytica 2011, 177, 207– 221.
46. Lopes, M.S.; Reynolds, M.P.; McIntyre, C.L.; Mathews, K.L.; Jalal Kamali, M.R.; Mossad, M.; Feltaous, Y.; Tahir, I.S.A.; Chatrath, R.; Ogbonnaya, F.; et al. QTL for yield and associated traits in the Seri/Babax population grown across several environments in Mexico, in the West Asia, North Africa, and South Asia regions. Theor. Appl. Genet. 2013, 126, 971–984.
47. Maccaferri, M.; Sanguineti, M.C.; Corneti, S.; Ortega, J.L.A.; Ben Salem, M.; Bort, J.; DeAmbrogio, E.; Del Moral, L.F.G.; Demontis, A.; El-Ahmed, A.; et al. Quantitative trait loci for grain yield and adaptation of durum wheat (Triticum durum Desf.) across a wide range of water availability. Genetics 2008, 178, 489–511
48. Salem, K.F.M.; Roder, M.S.; Borner, A. Identification and mapping quantitative trait loci for stem reserve mobilisation in wheat (Triticum aestivum L.). Cereal Res. Commun. 2007, 35, 1367–1374.
49. Bennett, D.; Izanloo, A.; Reynolds, M.; Kuchel, H.; Langridge, P.; Schnurbusch, T. Genetic dissection of grain yield and physical grain quality in bread wheat (Triticum aestivum L.) under water-limited environments. Theor. Appl. Genet. 2012, 125, 255–271.
50. Kumar, S.; Sehgal, S.K.; Kumar, U.; Prasad, P.V.V.; Joshi, A.K.; Gill, B.S. Genomic characterization of drought tolerance-related traits in spring wheat. Euphytica 2012, 186, 265–276
51. Myles, S., Peiffer, J., Brown, P. J., Ersoz, E. S., Zhang, Z., Costich, D. E., & Buckler, E. S. (2009). Association mapping: critical considerations shift from genotyping to experimental design. The Plant Cell, 21(8), 2194-2202.
additive genetic covariance of relatives and population structure. Genetics, 177(3), 1889-1913.
53. Reynolds, N., Latos, P., Hynes-Allen, A., Loos, R., Leaford, D., O'Shaughnessy, A., ... & Costello, I. (2012). NuRD suppresses pluripotency gene expression to promote transcriptional heterogeneity and lineage commitment. Cell stem cell, 10(5), 583-594. 62. Close, T. J., Wanamaker, S. I., Caldo, R. A., Turner, S. M., Ashlock, D. A., Dickerson, J. A.,
... & Wise, R. P. (2004). A new resource for cereal genomics: 22K barley GeneChip comes of age. Plant Physiology, 134(3), 960-968.
64. Walia, H., Wilson, C., Condamine, P., Ismail, A. M., Xu, J., Cui, X., & Close, T. J. (2007). Array-based genotyping and expression analysis of barley cv. Maythorpe and Golden Promise. BMC genomics, 8(1), 87.
66. Garg, B., Puranik, S., Misra, S., Tripathi, B. N., & Prasad, M. (2013). Transcript profiling identifies novel transcripts with unknown functions as primary response components to osmotic stress in wheat (Triticum aestivum L.). Plant Cell, Tissue and Organ Culture, 113(1), 91-101.
67. Meng, C., Quan, T. Y., Li, Z. Y., Cui, K. L., Yan, L., Liang, Y., ... & Liu, S. W. (2017). Transcriptome profiling reveals the genetic basis of alkalinity tolerance in wheat. BMC genomics, 18(1), 24.
68. Poersch-Bortolon, L. B., Pereira, J. F., Nhani Junior, A., Gonzáles, H. H. S., Torres, G. A. M., Consoli, L., ... & Margis-Pinheiro, M. (2016). Gene expression analysis reveals important pathways for drought response in leaves and roots of a wheat cultivar adapted to rainfed cropping in the Cerrado biome. Genetics and molecular biology, 39(4), 629-645.
69. Ma, J., Li, R., Wang, H., Li, D., Wang, X., Zhang, Y., ... & Li, Y. (2017). Transcriptomics analyses reveal wheat responses to drought stress during reproductive stages under field conditions. Frontiers in plant science, 8, 592.
70. Goyal, E., Amit, S. K., Singh, R. S., Mahato, A. K., Chand, S., & Kanika, K. (2016). Transcriptome profiling of the salt-stress response in Triticum aestivum cv. Kharchia Local. Scientific reports, 6, 27752.
74. Caruso, G., Cavaliere, C., Foglia, P., Gubbiotti, R., Samperi, R., & Laganà, A. (2009). Analysis of drought responsive proteins in wheat (Triticum durum) by 2D-PAGE and MALDI-TOF mass spectrometry. Plant Science, 177(6), 570-576.
75. Demirevska, K., Zasheva, D., Dimitrov, R., Simova-Stoilova, L., Stamenova, M., & Feller, U. (2009). Drought stress effects on Rubisco in wheat: changes in the Rubisco large subunit. Acta Physiologiae Plantarum, 31(6), 1129.
76. Kamal, A. H. M., Cho, K., Choi, J. S., Jin, Y., Park, C. S., Lee, J. S., & Woo, S. H. (2013). Patterns of protein expression in water-stressed wheat chloroplasts. Biologia plantarum, 57(2), 305-312.
77. Jiang, S. S., Liang, X. N., Li, X., Wang, S. L., Lv, D. W., Ma, C. Y., ... & Yan, Y. M. (2012). Wheat drought-responsive grain proteome analysis by linear and nonlinear 2-DE and MALDI-TOF mass spectrometry. International journal of molecular sciences, 13(12), 16065-16083.
80. Yang, F., Jørgensen, A. D., Li, H., Søndergaard, I., Finnie, C., Svensson, B., ... & Jacobsen, S. (2011). Implications of high‐temperature events and water deficits on protein profiles in wheat (Triticum aestivum L. cv. Vinjett) grain. Proteomics, 11(9), 1684-1695.
81. Hurkman, W. J., Vensel, W. H., Tanaka, C. K., Whitehand, L., & Altenbach, S. B. (2009). Effect of high temperature on albumin and globulin accumulation in the endosperm proteome of the developing wheat grain. Journal of Cereal Science, 49(1), 12-23.
82. Kamal, A. H. M., Cho, K., Kim, D. E., Uozumi, N., Chung, K. Y., Lee, S. Y., ... & Woo, S. H. (2012a). Changes in physiology and protein abundance in salt-stressed wheat chloroplasts. Molecular biology reports, 39(9), 9059-9074.
83. Gao, L., Yan, X., Li, X., Guo, G., Hu, Y., Ma, W., & Yan, Y. (2011). Proteome analysis of wheat leaf under salt stress by two-dimensional difference gel electrophoresis (2D-DIGE). Phytochemistry, 72(10), 1180-1191.
86. Oh, M. W., Roy, S. K., Kamal, A. H. M., Cho, K., Cho, S. W., Park, C. S., ... & Woo, S. H. (2014). Proteome analysis of roots of wheat seedlings under aluminum stress. Molecular biology reports, 41(2), 671-681.
87. Li, G., Peng, X., Xuan, H., Wei, L., Yang, Y., Guo, T., & Kang, G. (2013). Proteomic analysis of leaves and roots of common wheat (Triticum aestivum L.) under copper-stress conditions. Journal of proteome research, 12(11), 4846-4861.
88. Kamal, A. H. M., Cho, K., Komatsu, S., Uozumi, N., Choi, J. S., & Woo, S. H. (2012b). Towards an understanding of wheat chloroplasts: a methodical investigation of thylakoid proteome. Molecular biology reports, 39(5), 5069-5083.
89. Kim, K. H., Kamal, A. H. M., Shin, K. H., Choi, J. S., Heo, H. Y., & Woo, S. H. (2010). Large-scale proteome investigation in wild relatives (A, B, and D genomes) of wheat. Acta Biochim Biophys Sin, 42(10), 709-716.
91. Cailin, G. E., Yan, D. I. N. G., Zegang, W. A. N. G., Dingzhen, W. A. N., Yulong, W. A. N. G., Shang, Q., & Shishi, L. U. O. (2009). Responses of wheat seedlings to cadmium, mercury and trichlorobenzene stresses. Journal of Environmental Sciences, 21(6), 806-813.
92. Bino, R. J., Hall, R. D., Fiehn, O., Kopka, J., Saito, K., Draper, J., ... & Trethewey, R. N. (2004). Potential of metabolomics as a functional genomics tool. Trends in plant science, 9(9), 418-425.
95. Yuan, J. S., Galbraith, D. W., Dai, S. Y., Griffin, P., & Stewart Jr, C. N. (2008). Plant systems biology comes of age. Trends in plant science, 13(4), 165-171.
99. Wen, W., Li, K., Alseekh, S., Omranian, N., Zhao, L., Zhou, Y., ... & Florian, A. (2015). Genetic determinants of the network of primary metabolism and their relationships to plant performance in a maize recombinant inbred line population. The Plant Cell, 27(7), 1839-1856.
101. Hall, R., Beale, M., Fiehn, O., Hardy, N., Sumner, L., & Bino, R. (2002). Plant metabolomics: the missing link in functional genomics strategies. Plant cell, 14, 1437-1440.
103. Matsuda, F., Hirai, M. Y., Sasaki, E., Akiyama, K., Yonekura-Sakakibara, K., Provart, N. J., ... & Saito, K. (2010). AtMetExpress development: a phytochemical atlas of Arabidopsis development. Plant physiology, 152(2), 566-578.
107. Pandey, M. K., Roorkiwal, M., Singh, V. K., Ramalingam, A., Kudapa, H., Thudi, M., ... & Varshney, R. K. (2016). Emerging genomic tools for legume breeding: current status and future prospects. Frontiers in plant science, 7, 455.
110. Zivy, M., Wienkoop, S., Renaut, J., Pinheiro, C., Goulas, E., & Carpentier, S. (2015). The quest for tolerant varieties: the importance of integrating “omics” techniques to phenotyping. Frontiers in plant science, 6, 448.
112. Erayman, M., Sandhu, D., Sidhu, D., Dilbirligi, M., Baenziger, P. S., & Gill, K. S. (2004). Demarcating the gene-rich regions of the wheat genome. Nucleic acids research, 32(12), 3546-3565.
113. Francki, M. G., Hayton, S., Gummer, J., Rawlinson, C., & Trengove, R. D. (2016). Metabolomic profiling and genomic analysis of wheat aneuploid lines to identify genes controlling biochemical pathways in mature grain. Plant biotechnology journal, 14(2), 649-660.
114. Michaletti, A., Naghavi, M. R., Toorchi, M., Zolla, L., & Rinalducci, S. (2018). Metabolomics and proteomics reveal drought-stress responses of leaf tissues from spring-wheat. Scientific reports, 8(1), 5710.
117. Satismruti, K., Senthil, N., Vellaikumar, S., Ranjani, R. V., & Raveendran, M. (2013). Plant ionomics: a platform for identifying novel gene regulating plant mineral nutrition. American Journal of Plant Sciences, 4(07), 1309.
119. Hartmann, A., Czauderna, T., Hoffmann, R., Stein, N., & Schreiber, F. (2011). HTPheno: an image analysis pipeline for high-throughput plant phenotyping. BMC bioinformatics, 12(1), 148.
120. Weston, D. J., Gunter, L. E., Rogers, A., & Wullschleger, S. D. (2008). Connecting genes, coexpression modules, and molecular signatures to environmental stress phenotypes in plants. BMC Systems Biology, 2(1), 16.
1. Leonard, W. H.; & Martin, J. H. Cereal crops. 1963. (No. SB189 L37).
123. Shah, T.; Tayyaba, A.; Sadia, L.; Mehmood, A.N. Genome editing tools: Advancing crop transformation and overview of tools. Plant Physiology and Biochemistry, 2018,