Article
A System Dynamics Approach to Integrating
Sustainable Land Use with Transportation System
Based on Access Management
Xuecai Xu 1, 2,*, and Xiangjian Luo 1
1 School of Civil Engineering and Mechanics, Huazhong University of Science and Technology, Wuhan, China; e-mail: [email protected]
2 School of Civil and Environmental Engineering, Nanyang Technological University, Singapore; e-mail: [email protected]
* Correspondence: e-mail: [email protected]; Tel.: +86-18986155430
Abstract: The coordination planning between land use and transportation system is an important premise of solving urban transportation problems and realizing land use integration. This study investigates the interactive and feedback relationship between land use and transportation system from the perspective of access management. By integrating the land use and traffic data from Las Vegas Metropolitan area with the system dynamics model, the causal relationship and causal loop diagrams (CLDs) are introduced to analyze the cause-and-effect relationship and quantitative relationship between the factors of the combined system of land use and transportation, and then sub-models partition and system simulation are performed. The systems dynamics model is established by analyzing the relationship between a series of access management techniques, traffic characteristics, and land use features. The results show that system dynamics model can be used as an effective alternative to model the symbiosis relationship of land use and transportation system for urban planning and construction.
Keywords: System Dynamics; Land Use; Transportation Systems; Access Management
1. Introduction
It is well known that urban roadway resources are limited, and it takes enormous capital and time for construction and maintenance. Moreover, the roadway growth speed is far less than that of the travel demand. Therefore, as for the limited roadway resources, by managing the accesses the roadway lifecycle can be extended, and the safety can be increased, while the traffic congestion can be reduced, and the appearance and quality of the environment can be improved. More importantly, access management not only ameliorates the basic functions of roadways, but also preserves the long-term property value and economic viability of adjacent land [1].
Access management (AM) is to control the location, spacing design and operation of driveways, median treatments, median openings, and related auxiliary lanes systematically. The goal of access management is to perform the roadway functional hierarchy in the transportation planning, which provides the accessibility to the adjacent land as well as the safety and efficiency of the transportation system, particularly along arterials and other primary roads [1]. Consequently, a comprehensive access management program is required to support the safe and efficient operation of the main arterials, while providing convenient accesses to the surrounding commercial sites.
On the contrary, without access management, the function and operation of major corridors may deteriorate in a few years, especially for the newly-built roadways. In recent years, this phenomenon has frequently occurred in China. Inadequate access management can not only cause high costs for government and related agencies, but also have a negative impact on the corridor business. With the rapid growth of travel demand, the access management problem is now being considered seriously, as the closely-spaced and poorly-designed major corridors make it difficult for
2 of 16
customers to enter and exit the commercial areas safely and efficiently (the commercial sites at the intersection corner may even be blocked by the queuing traffic). As a result, the newly opened businesses may seek more attractive locations where access is more convenient, safer, and less congested. More customers shall stream into these commercial sites with better accesses. And as the situation keeps going on, the previously developed areas may start to deteriorate due to the inadequate access management, and more future businesses will turn to the better-spaced and better-designed corridors.
These symptoms are caused by inadequate coordination of transportation and land use decisions, and the results may lead to a series of disastrous events that serve as a cycle of functional obsolescence of the major corridors. In the beginning, the accessibility of adjacent land is ameliorated with significant improvements in the corridor, while the improved accessibility increases the value of land and stimulates the real estate development. With the time moving on, the traffic around the land increases and traffic conflicts also increase, leading to deterioration of traffic conditions. As a result, the corridors may need to be improved again to restore the safety and capacity of the system, and repeatedly this loop will continue. As a systematic control method, system dynamics can reflect interaction and feedback features of this loop, and address the accessibility and sustainability of along the major corridor [2]. Furthermore, this loop can be managed effectively by considering both the adjacent land and transport system based on access management program.
Although land use and transportation interaction has been studied over the past 6o years, few has investigated using system dynamics from the perspective of access management. Therefore, the purpose of this study is to propose a system dynamics model that integrates both land use and road transport from the perspective of access management because the interaction and feedback between land use and transportation is consistent with the characteristics of system dynamics, and more importantly system dynamics can deal with qualitative and quantitative features systematically . The model is established with the causality functions and causal loop diagrams (CLDs) by adopting a series of AM techniques, traffic characteristics, land use features and related variables that are considered as model components. The results are beneficial to transportation planning, design and maintenance of roadway system, as well as to local government and agencies to develop policies, regulations, and improvement programs.
2. Literature Review
In transportation areas, so far there have been a variety of models, methods and software focused on the interaction between land use and transportation system. Since the study is based on system dynamics, two major types of literature are summarized, namely, general land use/transportation interaction models and system dynamics approach.
General Land Use/Transportation Models
Over the last 60 years, land use and transportation interaction has been extensively studied [3-6]. Generally, there are four types of land use and transportation models, including econometrics models, heuristic models, simulation models and scenario techniques [7].
As for the econometric models, Vu et al. (2006) [8] explored the effects of access management on accessibility and patronage. Safety and congestion impacts were concentrated along six major commercial corridors in Western Washington State with simultaneous logit model. The findings show that business type and operational variables, corridor and street environment variables, as well as willingness-to-pay measures are significant factors affecting commercial corridors. Xu et al. (2013) [9] identified access management factors associated with safety of urban arterials mid-blocks with panel data simultaneous equation models. The interaction between land use and transport was addressed from the perspective of access management, which is the base of this study. Generally speaking, most of the studies presented econometric models oriented on accessibility and travel efficiency, but due to the assumptions, complicated modeling and harsh terms, it is difficult to put the models into practice and realize the real value.
used to understand land use change at the regional scale and discrete choice models to predict change at the local level. The results showed that land use in the Delhi metropolitan area is intensifying and losing diversity, while linking land use and transportation models is not from real world, but from data-based planning of policy framework. As for the equity based on land use and transportation problem, Lee et al. (2006) [11] proposed bi-level programming model, in which the upper level maximized traffic production incorporating equity constraints, while the lower level combined trip distribution with assignment user equilibrium, and penalty function method with a Genetic Algorithm (GA) based approach was employed to solve the proposed model. The results offered a tool in modeling equity-based transportation and land use development. The study by Li et al. (2014) [12] developed an integrated model of a sustainable land use and transportation system with uncertainty in future population. A two-stage robust optimization model was proposed, in which the first stage was to optimize the land use and transportation system and the second stage was a scenario-based stochastic location and route choice equilibrium problem. The findings showed that the integrated model of sustainable land use and transportation system depends on the level of uncertainty in future population, capital budget for urban development, and confidence levels of the chance constraints significantly. However, Dutta et al. (2014) [13] conducted the calibration of an integrated land use and transportation model using maximum-likelihood estimation (MLE). The performance of the MLE optimization problem was displayed better compared to the Grenoble land-use model. Generally, heuristic algorithms have been widely utilized in this area, but the process is relatively complicated, which may influence the application of the algorithms.
4 of 16
Scenario techniques have been widely used in land use and transportation planning, which provides various constructive dialogues about the future of the communities, and serve as the basis for assertive action to direct the future planning [21]. From the developers’ perceptions of the market for pedestrian-and transit-oriented development, Levine and Inam (2004) [22] discussed the market for transportation-land use integration through a national survey. The survey indicated that respondents prefer land-policy reform based on the expansion of choice in transportation and land use. Bartholomew (2007) [21] summarized 80 scenario planning projects from more than 50 U.S. metropolitan areas, and public participation, methodology and institutional structures were discussed. The study concluded that the institutional structures behind regional land use-transportation scenario planning needs to be bolstered. Meanwhile, Nijkamp et al. (2007) [23] offered a methodological contribution to sustainable mobility policy in the Naples metropolitan area. Scenario analysis was used to design combined land-use/transportation plans, and long-range choice options were evaluated using a hierarchical Regime method. The results are critical to monitor and control in a quantitative way the effects of the policy scenarios proposed for the sustainability objective. Furthermore, in order to analyze the land-use-transportation future, Lemp et al. (2008) [24] compared visioning and modeling methods in Austin metropolitan area as a case study. The results verified that visioning offers the greatest potential for public involvement in identifying regional development goals while the land-use models provide a strong theoretical foundation and allow for interactions with transportation model, and the combination of the two approaches would be beneficial for future planning The current studies tend to take the qualitative direction, but in practice both quantitative and qualitative studies are required.
As far as concerned, there have been some studies on the accessibility consequences of land use and transportation interaction. Bertolini et al. (2005) [25] employed the concept of accessibility as a framework for the interactive design of integrated transport and land use plans in Netherlands. Similar study by Geurs et al. (2010) [26] examined the accessibility benefits associated with land use/transport policy strategies for Netherlands. The land use and transport interaction model TIGRIS XL was used to measure accessibility, which accounted for both changes in generalized transport costs and destination utility. Then Coppola and Papa (2013) [27] proposed accessibility planning tool for land use/transport interaction based on a zone-specific indicator, marginal activity access cost, and the application in Rome validated the proposed tool for zones clusters identified by accessibility to public transport.
As a summary, some scholars summarized the transportation and land use models from different perspectives. Badoe and Miller (2000) [28] summarized the literature on empirical studies of transportation–land-use interaction in North America. From macro and micro aspects the studies are reviewed and found that the data limitations and methodological weakness are the reason why various studies have different impacts on land-use policies. The conclusions recommend providing an integrated transportation-land-use model and taking into account all the major factors and the interactions. From the operation aspect of land use and transportation, Hunt et al. (2005) [4] provided a detailed review of six frameworks (ITLUP, MEPLAN, TRANUS, MUSSA, NTYMTC-LUM and UrbanSim). Iacono et al. (2008) [19] reviewed some of the four important theoretical frameworks for modeling transportation and land use. Aggregate models of spatial interaction, econometric models, simulation models, activity-based travel model, multi-agent models and cell-based models were discussed and criticized. The first two “top-down “frameworks specified the interaction between transportation networks and location based on the behavior of representative individuals, while the last two “bottom-up” frameworks offered an alternative mechanism for representing the dynamics of land use change. Recenly, Acheampong and Silva (2015) [6] provided comprehensive and up-to-date material for both researchers and practitioners interested in land use and transportation interaction modeling. All of the reviews give the direction of our study.
System Dynamics Approach
and systematic approach for land use and transportation problem, and has been widely used all over the world in various fields [2, 7, 29, 30, 31, 32] since presented by Prof. Forrester in 1958.
From the aspect of engineering, Ahmad et al. (2016)[29] summarized the application of SD in electricity sector modeling, including policy assessment, generation capacity expansion, financial instruments, demand side management, mixing methods and finally micro-worlds models. From the aspect of management, Cosenz and Noto (2016) [30] explored and discussed the theoretical and empirical development of SD in the strategic management so as to highlight the main research themes and developmental patterns of the key contributions; From the perspective of environment, public policy and resources, Brent et al., (2017)[31] examined the extent of utilization of SD in South Africa between 2003 and 2014, which is useful to facilitate further discussions on practical applications of SD. The latest study by Currie et al. (2018) [32] applied SD modeling to environmental health decision-making and policy, and revealed that SD modeling was increasingly used but still limited.
In transportation field, Abbs and Bell (1994) [29] made the first attempt to apply system dynamics approach for land use and transportation study and demonstrated that it can be a good alternative. From methodology and application, Haghani et al. (2003) [7,, 30] presented a system dynamics approach to land use/transportation system performance modeling simultaneously. Later study by Shen et al. (2009) [31] applied a system dynamics model for the sustainable land use and urban development in Hong Kong. Transport sector and urban land sector of SD models were established as two sub-systems, and simulated separately. Although the results support compact and high-density development in Hong Kong, the interaction between land use and transportation is the weakness. Pointed to this interaction, Pfaffenbichler et al. (2010) [32] developed a system dynamics model for land use/transport problem with Metropolitan Activity Relocation Simulator (MARS) in VENSIM (one simulation software developed by Ventana Systems, Inc. used for SD), which is capable of analyzing policy combinations at the city/regional level and evaluating their impacts over a 30-year planning period. Shepherd (2014) [2] reviewed six aspects of SD models applied in transportation, including the uptake of alternate fuel vehicles, supply chain management, highway maintenance/construction, strategic policy at urban, regional and national levels, airlines and airports, and the emerging areas. The results verify that SD is better suited to providing a holistic system model dealing with feedbacks and delays in the system.
Summarized from the studies above, most concentrate on either land use/transport, or system dynamics separately or individually, and there have been very limited studies integrating land use and transportation with access management together. Moreover, the current methods are concentrated either on quantitative or qualitative aspect. Thus, this study will fill the gap by integrating land use/transport with accessibility, while addressing the interaction and feedback with system dynamics from both quantitative and qualitative aspects.
3. System Dynamics Methodology
3.1. Fundamental rules
Compared with other alternative techniques, SD can reflect the interaction and feedback between land use and transportation based on access management, as well as addressing qualitative and quantitative features systematically. The qualitative feature is from the causal loop diagrams (CLDs), which can be defined by the feedback loops, influencing factors and cause-and-effect relationship, while with the CLDs the quantitative attribution could be converted from the abstract social and economical phenomena to concrete technical one [2], and then the dynamic behavior model of the main system can be established.
6 of 16
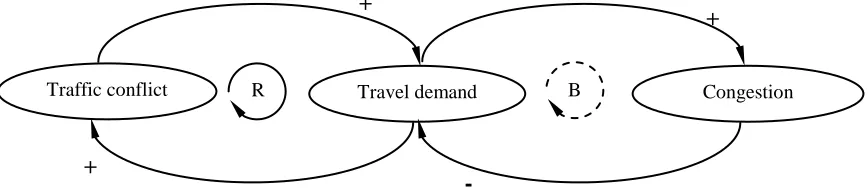
direction that the dependent component varies with the independent one. If the dependent component varies with the independent one at the same direction, the causal link is denoted as “+”, otherwise denoted as “-” at the opposite direction. How to illustrate the method of CLD can be exemplified in Figure 1.
Figure 1 Feedback Loop Structure
In Figure 1, assume two variables, travel demand and traffic conflict, and the feedback loop formed. If the travel demand is increased, the traffic conflicts are increased, or if the traffic conflicts are increased, the travel demand is increased, thus both links are expressed as “+”. Similarly, assume two variables, travel demand and congestion, and the feedback loop formed. An increase in travel demand may increase the congestion chances, and a decrease in travel demand implies the congestion is reduced, so the link is denoted as “+”; contrarily, an increase in congestion may be due to the increase of travel demand, while a decrease in congestion may attribute to the increase of travel demand, thus the link is expressed as “-”.
Moreover, Figure 1 indicates that the two components, traffic conflict and congestion not only affect the traffic travel demand, but are affected by the travel demand. Hence, the travel demand includes two feedback loops: the reinforcing loop (R) and the balancing loop (B). The R loop reflects the continuing trend of growth or decline, which makes the system apart from an equilibrium point, while the B loop features causal relationships, which tends to decrease the discrepancy between the current state and an expected state. More details about fundamental rules of SD can be referred to [2, 7, 31,32].
3.2. Modeling procedure
With the CLDs above, the qualitative features of SD can be revealed from the structure of a system and dynamic behavior, meanwhile the quantitative principles can be reflected with differential variables and equations varying over time, and can be addressed via a stock-flow diagram, which makes the model visualized and understood easily.
Based on the CLDs, the stock-flow diagram can be transferred to provide accumulation and/or evacuation of stock and flow for quantities in the system with the following steps:
Step 1: Key variable identification: main driven force should be identified according to the problem description;
Step 2: Stock identification: the system resources (i.e. stocks) related to the main driven force should be determined;
Step 3: Flow module development: the rates of change should be provided, and the processes dominating each stock should be presented;
Step 4: Qualitative analysis: additional driven force overlooked and other controllable variables should be identified, and causal relationships requiring further analysis with specific approaches should be determined.
Through the steps, the system can be represented in terms of stocks and flows, and the quantification of the process can be represented and computed with the equations or algorithms.
Traffic conflict Travel demand
+
+
+
-
Figure 2 Stock and flow example
Shown from Figure 2, the stock-flow diagram of SD can be represented by 3 major types of variables, stock level variables, rate variables and auxiliary variables. Stock level variables can represent any variable that accumulates or integrates over consecutive time periods, while rate variables denote activities or variables making the stock change. The auxiliary variables are described as identifying rate variables or other auxiliary ones. Each variable is expressed by an equation that is concerned with its level, rate and auxiliary equations. The stock level equation is denoted as a differential equation, while the rest are general algebraic equations. As exemplified by Figure 2, the inflow to a stock represents the traffic flow into certain land, while an outflow from a stock stands for the traffic flow out of the land, and both the inflow rate and outflow rate are controlled by the land types. Thus, the stock level can be described by the following equation:
− +
= 2
1[ ( ) ( )] (1)
)
(t tt Inflows Outflows ds Stockt
Stock (1)
where the t1 and t2 represent starting time and ending time moments respectively, inflow (s) and outflow (s) are the arrival flow and departure flow of the land between the initial time t1 and the current time t2, correspondingly, and stock (t1) stands for the initial traffic volume at time t1. The net rate of the stock can be expressed by the differential equation:
) ( )
( )
(
t Outflow t
Inflow dt
Stock
d = −
(2)
The auxiliary variable, such as congestion load factor, is a function of stock, which can be used to formulate and calibrate the model. Stock level variables, rate variables and auxiliary variables, connected by arrows, are formed into the stock-flow diagram, which can be utilized to establish the cause-and-effect relationships between the model variables by transferring the CLDs information into the differential equations. With these equations, the simulation can be performed with software program VENSIM and represent the dynamic behavior of the system variation.
4. Modeling for Land Use and Transportation
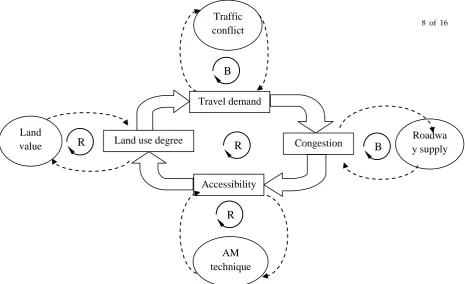
The main structural interrelationships are shown in Figure 3 with four sub-models, and the positive and negative feedback loops can be identified.
Accessibility-Land use degree-Travel demand-Congestion Feedback Loop (positive)
Improved accessibility can make the land use degree (residential or commercial lands by the total lands) reach the higher level, and then attract more travel demand, and finally cause more congestion along major corridors. The increase of accessibility encourages more land use development: on the one hand, the implementation of access management techniques improves the safety and mobility around the adjacent lands; on the other hand, improvement of accesses enhances the commercial and residential lands along the corridors’ safety and efficiency [8]. In this way, the land with more convenient and safer accesses would generate more trips, thus the travel demand would be increased. Although the improvement of accessibility and travel demand has increased the roadway capacity significantly, the growth can’t be infinite, and when the traffic volume reaches the capacity boundary, the roadway mobility would be deteriorated till the congestion occurs. Consequently, the accessibility needs to be improved again to restore the safety and mobility of the system.
Four Sub-models:
Accessibility-AM techniques Feedback Loop (positive)
8 of 16
Figure 3 General Model Structure
Land Use Degree-Land Value Feedback Loop (positive)
The larger the land use degree is, the higher the land value is. The more developed land encourages more patronages to invest more, whether the commercial or residential lands are, thus the land value is increased significantly. In the same way, the higher land value promotes the land use to be developed more efficiently.
Travel Demand-Traffic Conflict Feedback Loop (negative)
The increased traffic generation brings an increase of traffic conflicts. However, as traffic conflicts progress, the trips generated are reduced, thus the travel demand is decreased.
Congestion-Roadway Supply Feedback Loop (negative)
The severe traffic congestion can make the roadway capacity reach its peak, which may bring about the development of new roadways (positive effect). On the other hand, increase of roadway capacity by broadening or expansion of lane-miles alleviates the traffic congestion (negative effect) at least as a whole.
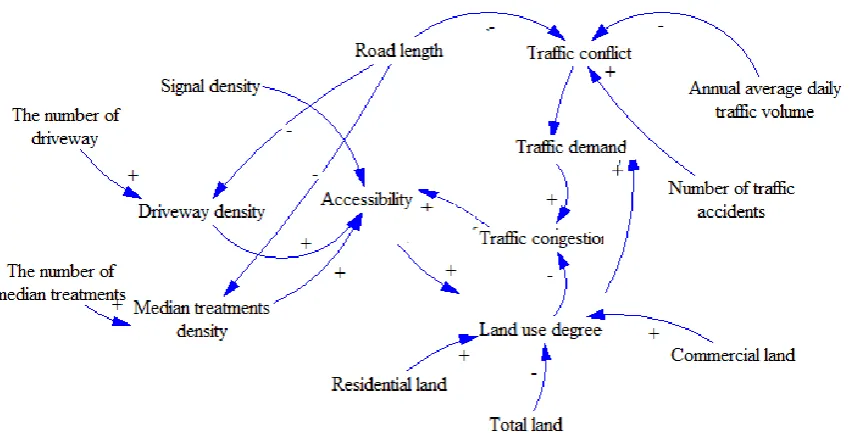
According to the feedback loops, the CLDs of general model and four sub-models can be integrated and formed into the following diagram, as shown in Figure 4.
In Figure 4, on the one hand, accessibility, land use degree and travel demand are considered as the influencing factors of traffic congestion in the general model, i.e., accessibility, land use degree and travel demand are regarded as input in the system model while traffic congestion is treated as output. On the other hand, in the sub-models, accessibility, land use degree and travel demand are considered as dependent variables influenced by sub-factors. For instance, in the travel demand sub-model, travel demand is influenced by traffic conflicts, and considered as the dependent variable, while traffic conflicts are influenced by AADT, number of accidents, road length and so on, which can be considered as independent variables, thus forming into travel demand sub-model loop.
Accessibility
Land use degree Roadwa
y supply
AM technique
s Traffic conflict
Land value
Travel demand
Congestion
R
R
B
B
Figure 4 Causal Loop Diagram
Variables and Parameters
The major variables, parameters, and auxiliary variables in this model system are described as follows.
Level Variables
According to the level equation, the level variables are defined as the quantity accumulated during certain time periods, and in this study two major level variables are considered, land use degree and congestion, since the main purpose is to find out the cause-and-effect relation between land use and transportation.
Rate Variables and Auxiliary Variables
In the level variables equation, the rate variables represent the varying parameter of inflow and outflow, and an auxiliary variable denotes the quantity during a certain period, which can help explain the various factors associated with the model components.
Model Equations
By integrating major variables, parameters and auxiliary variables with SD principles, software VENSIM not only provides the qualitative relations among all the variables as Figure 4, but offers the quantitative equations as follows. The equations are obtained by several trials with the dataset till the optimal ones are achieved, with which the quantitative features of SD can be reflected appropriately.
Accessibility Sub-model
In this sub-model there are several auxiliary variables developed by the following equations:
AY = α0+ α1× MD + α2× 1.5SDY+ α
3× DD (3) where AY=Accessibility; MD=Median-opening density, number of median openings per mile; SDY=Signal density, number of signals per mile; DD=Driveway density, number o driveways per mile.
Equation 3 states that accessibility (AY) can be defined as a function of median density (MD), signal density (SDY), and driveway density (DD).α0 denotes the intercept, andα1,α2, α3stand for the coefficients.
Land Use Sub-model
Based on the causal loop diagram in Figure 4, level variables LUD is defined by the following equation:
10 of 16
L represent the certain time. Rate variable LV (land value) is deduced from the following algebraic equations:
LV = (β0− β1× cos((RL) + 1) + β2× CL − β3× ln(TL0.2) × ln(Time + 2.7183) (5) where: RL=Residential Land Use Degree, proportion of residential land to total land;
CL=Commercial Land Use Degree, proportion of commercial land to total land; TL=Total Land Use Degree (Residential Land plus Commercial Land).
β0 is for the intercept, β1, β2,β3represent the coefficients. Travel Demand Sub-model
In this part there are two major variables: Traffic conflict (TC) and Traffic demand (TD).Each of them can be developed from VENSIM as follows:
TC = (NA × 103⁄(AADT × 365 × LS)) × ln(Time + 2.7183) (6)
TD = δ − α × TC (7) where: TC=traffic conflict; NA=number of accidents; AADT=annual average daily traffic;
LS=length of street; TD=traffic demand; is the intercept, and is the coefficient. Congestion Sub-model
From the causal loop diagram in Figure 4, the level variable Congestion (CN) can be defined as the following equation:
+
= K
L L
K TCN CRdt
TCN (8)
It states that the number of present traffic congestion (TCNk) is the traffic congestion in previous
time period (TCNL) plus the net change during one time period caused by congestion rate. Rate
variable CR(congestion rate) is deduced from the following algebraic equations:
(9) where: TCN=traffic congestion; CR=congestion rate; TD=traffic demand; LUD=land use degree;
is the intercept, , are the coefficients.
5. Parameter Estimation
According to the SD principle, the coefficients of models for the accessibility equation, land use equation, traffic demand equation, and congestions equation are assessed through Ordinary Least Square (OLS) estimation with the corresponding data. The data were collected from 2003 to 2005 in Las Vegas Metropolitan area maintained by the Nevada Department of Transportation, and 356 roadway segments were included from 19 major and minor arterials. More details about the dataset can be referred to [9, 33].
Estimation of the Coefficients for the Accessibility Equations:
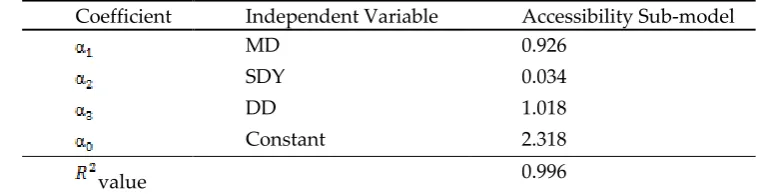
Correlation test was conducted before the final model was obtained. The variables with high correlation, such as, two-way and total median opening density, only one is kept and the other is neglected. Table 1 gives the estimated coefficient values for all the significant variables at 95% confidence interval. R2 value and F value indicate that the estimated equation is meaningful for use.
It can be seen that median-opening density, signal density and driveway density are significant for accessibility, which is consistent with the results in Xu et al. (2013) [9]. The R2 value reflects that
there is high relation between dependent variable and independent variables.
Table 1.Estimation of Coefficients for the Accessibility Equations
Coefficient Independent Variable Accessibility Sub-model
MD 0.926
SDY 0.034
DD 1.018
Constant 2.318
F value 32904.407
Estimation of the Coefficients for the Land use Equations:
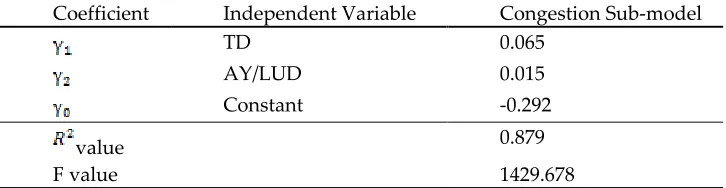
Similarly, land use sub-model, travel demand sub-model, and congestion sub-model have been tested various times before the final equations were determined, and coefficients values are listed from Table 2 to Table 4. The results show that all coefficient values are statistically significant at 95% confidence interval. R2 values and F values also indicate that there lies in high relation between
dependent variable and independent variables. With all the equations provided, the interaction and feedback relations among the variables in Figure 3 and 4 can be verified, which addresses the quantitative features of SD.
Table 2.Estimation of Coefficients for the Land Use Equations
Coefficient Independent Variable Land Use Sub-model
RL -0.044
CL 0.023
TL -1.172
Constant 0.819
value 0.858
F value 786.798
Table 3.Estimation of Coefficients for the Traffic demand Equations
Coefficient Independent Variable Travel Demand Sub-model
TC 0.244
Constant 48.078
value 0.844
F value 19.098
Table 4.Estimation of Coefficients for the Congestion Equations
Coefficient Independent Variable Congestion Sub-model
TD 0.065
AY/LUD 0.015
Constant -0.292
value 0.879
F value 1429.678
6. Simulation Results and Discussion
12 of 16
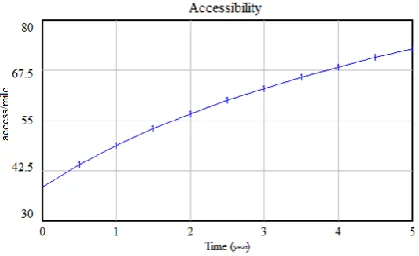
Figure 5 Accessibility Variation Trend
In this accessibility sub-model, four factors play important roles in determining the accessibility: signal density, number of driveway, road length and median treatments. The sensitivity test for each individual factor is performed while holding other variables constant, as the followings:
(1) When the value of signal density is increased by 100%, the value of accessibility is raised by 0.682%;
(2) When the value of driveway is increased by 100%, the value of accessibility is increased by 86.091%;
(3) When the value of median density is increased by 100%, the value of accessibility is increased by 7.5785%;
(4) When the value of road length is increased by 100%, the value of accessibility is decreased by 46.835%;
It can be concluded that the number of driveways has the greatest impact on accessibility, followed by the length of the road (46.835%), which is much greater than the other two variables. The density of traffic signals has little effect on accessibility. In addition, the length of road has a negative impact on accessibility, while the other three are positive. Therefore, it can be suggested that although more driveways can improve accessibility, the number of driveways should be controlled since more driveways may produce more conflicts; longer roadway segments may improve the vehicle mobility instead of accessibility, thus the roadway length should be designed to some appropriate extent, which is consistent with the results by Xu et al. (2013,2015) [9,33]. The density of traffic signals depends on the roadway length and structure to a certain extent, showing less effect on accessibility, which can be understood.
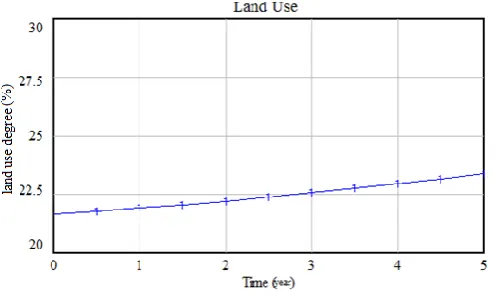
Similarly, the variation trend of land use over time is performed as shown in Figure 6. Although the land use degree varies year by year, the trend is increasing but much gentler compared to that of accessibility trend. As for this land use sub-model, there are three critical variables influencing land use degree: commercial land, residential land and total land. The sensitivity tests are conducted as follows:
(1) When the value of the commercial land is increased by 100%, the value of land is increased by 17.68%;
(2) When the value of the residential land is increased by 100%, the value of land is reduced by 13.24%;
(3) When the value of the total land increased by 100%, the value of land decreased by 92.5%;
Figure 6 Land Use Variation Trend
Figure 7 shows the varying trend of travel demand over time. In this sub-model, travel demand is affected by traffic conflicts, while the latter depends on various factors, such as the number of accidents, AADT, length of street, etc. Suppose that AADT is kept unchanged, the travel demand is decreased year by year due to the increase of traffic conflicts in the model. The increase of traffic conflicts may cause the deterioration of the roadway conditions, thus raising people's travel costs, and finally leading to the travel demand down.
Figure 7 Travel Demand Trend
Consequently, the travel demand is affected by the three factors: the number of accidents, AADT, and length of street. The sensitivity test for each factor is performed as follows:
(1) When the number of accidents is increased by 100%, the value of travel demand is decreased by 10.79%;
(2) When the value of AADT is increased by 100%, the value of travel demand is raised by 5.4%; (3) When the value of the road length is increased by 100%, the value of travel demand is increased
by 5.4%;
14 of 16
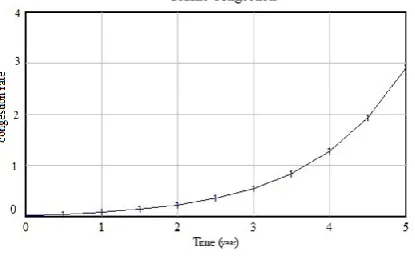
value of traffic congestion is greater than one, the road is under a congested state. The greater the value, the more congested. Shown from Figure 8, after 3.5 years, the roadway begins to be in a state of congestion, and as time goes by, the roadway becomes more and more congested.
Figure 8 Traffic Congestion Trend
In this congestion sub-model, congestion rate is influenced by three factors, namely, travel demand, accessibility and land use degree. The sensitivity test is performed individually as follows: (1) When the value of travel demand is increased by 100%, the value of congestion rate is increased
by 110%;
(2) When the value of accessibility is increased by 100%, the value of congestion rate is raised by 0.03%;
(3) When the value of land use is increased by 100%, the value of congestion rate is decreased by 0.04%;
The sensitivity test shows that travel demand has the greatest impact on traffic congestion, followed by land use, and accessibility. Moreover, the variation direction of travel demand and accessibility is consistent with that of congestion rate, while the land use is opposite. Among the three factors, traffic congestion is contributed to travel demand mostly, implying that travel demand is of utmost and direct source of the congestion, and various counter measures should be taken according to travel demand management. Land use and accessibility, as for the matured corridors, are already standardized, and have no extra alternation, which should be improved as much as possible [1].
7 Conclusions
In this study, the system dynamics model is used to integrate the transportation system and land use in a novel way from the perspective of access management. By combining the real-world data of Las Vegas metropolitan area with the system dynamics model, the causal relationship and CLDs are introduced to analyze the cause-and-effect relationship and quantitative relationship between the factors of the system formed by the land use and transportation system, and then sub-models partition and system simulation are performed. Through the use of a series of AM techniques, traffic characteristics, and land use features, the system dynamics model between land use and transportation system is established.
The findings are summarized as follows:
(1) In this study, accessibility is considered as the driven force of system dynamics, and the driveway, median treatments and the density of traffic signals are selected to reflect accessibility comprehensively. According to the accessibility sub-model, the accessibility is the most sensitive factor to the variation of driveway, followed by median treatments and the signal density, which is uniform to the results of Xu et al. (2013) [9]. Therefore, in order to improve the accessibility of the major corridors, an appropriate number of driveways should be built firstly, and then suitable median types and the density of traffic signals should be taken into account on the basis of economic benefits and efficiency.
planning and transportation planning should be taken into account synergistically, and the interactive relationship between land use and transportation needs to be emphasized. Subsequently, reasonable guidance should be provided to the traffic flow to avoid the over-concentration, and even traffic congestion.
(3) In this study, it is found that travel demand rely on three main factors, the number of accidents, AADT and street length. The simulation results show that, if AADT is kept relatively constant, the travel demand decreases year by year with the increase of traffic conflicts.
(4) To sum up, accessibility, land use and travel demand are integrated into factors that affect traffic congestion. From the above analysis, travel demand has the greatest impact on traffic congestion, followed by accessibility and land use. Therefore, in order to reduce traffic congestion, on the one hand, proper management and control can be conducted and some effective measures can be adopted to reduce unnecessary travel demand; on the other hand, some access management measures should be implemented to improve the accessibility of the region and regulate the traffic flow effectively. Last but not least, land use layout should be managed during the planning period to avoid the unreasonable distribution of traffic flow.
In the end, since the interaction between land use and transportation system is dynamic and complex, this study only investigates part of the interaction from the perspective of access management, whereas other factors, e.g., socio-economic parameters (GDP, income, population etc.) and the network level of service are neglected due to the limitation of the dataset. Moreover, other limitations, such as lack of spatial representation, lack of representation of travel modes, lack of endogeneity analysis among variables, etc. may need further consideration. In the future work, the calibration/validation of the model could be improved with more parameters and data.. Therefore, it is necessary to conduct more in-depth investigation to improve the model such that the performance of the model is approximate to the actual situation.
Author Contributions: Conceptualization, X. Xu. and X. Luo; Methodology, X. Xu; Estimation and Simulation, X. Luo; Formal Analysis, X. Xu and X. Luo; Discussion, X. Luo; Data Curation, X. Xu; Writing-Original Draft Preparation, X. Xu; Writing-Review & Editing, X. Xu; Project Administration, X. Xu; Funding Acquisition, X. Xu.
Funding: This research was funded by Fundamental Research Fund for the Central Universities [HUST:2018KFYYXJJ001].
Acknowledgments: Thanks for the anonymous reviewers’ comments and suggestions.
References
1. Williams, K.M.; Stover, V.G.; Dixon, K.K.; Demosthenes, P. Access Management Manual, 2nd ed; Transportation Research Board, U.S.A., 2014; ISBN:978-0-309-29541-3.
2. Shepherd, S.P. A review of system dynamics models applied in transportation. . Transportmetrica B2014, 2(2), 83-105.
3. Wilson, A.G. Land-use/transport interaction models: past and future. J. Transp. Eco. Policy 1998, 32(1), 3-26.
4. Hunt, J.D.; Kriger, D.S.; Miller, E.J. Current operational urban land-use-transport modeling frameworks: A review. Transp. Rev.2005, 25(3), 329-376.
5. Chang, J.S. Models of the relationship between transport and land-use: A review. Transp. Rev.2006, 26(3), 325-350.
6. Acheampong, R.A.; Silva, E.A. Land use-transport interaction modeling: A review of the literature and future research directions. J. Transp. Land Use2015, 8(3), 11-38.
7. Haghani, A.; Lee, S.Y.; Byun, J.H. A system dynamics approach to land use/transportation system performance modeling Part I: Methodology. J. Adv. Transp. 2003, 37(1), 1-41.
16 of 16
9. Xu, X.; Kwigizile, V.; Teng H. Identifying access management factors associated with safety of urban arterials mid-blocks: A panel data simultaneous equation models approach. Traffic Inj. Prev. 2013, 14(7), 734-742.
10. Srinivasan, S. Linking land use and transportation in a rapidly urbanizing context: A study in Delhi, India.
Transportation2005, 32, 87-104.
11. Lee, D.; Wu, L.; Meng, Q. Equity based land-use and transportation problem. J. Adv. Transp.2006, 40(1), 75-93.
12. Li, Z.C.; Li, Z.K.; Lam, W.H.K. An integrated design of sustainable land use and transportation system with uncertainty in future population. Transportmetrica A 2014, 10(2), 160-185.
13. Dutta, P.; Arnaud, E.; Prados, E.; Saujot, M. Calibration of an integrated land use and transportation model using maximum-likelihood estimation. IEEE Trans. Comput. 2014, 63(1), 167-178.
14. Clay, M.J.; Johnston, R.A. Multivariate uncertainty analysis of an integrated land use and transportation model: MEPLAN. Transp. Res. Part D 2006, 11(3), 191-203.
15. Waddell, P.; Ulfarsson, G.F.; Franklin, J.P.; Lobb, J. Incorporating land use in metropolitan transportation planning. Transp. Res. Part A2007, 41(5), 382-410.
16. Clay, M.J. Developing an integrated land-use/transportation model for small to medium-sized cities: case study of Montgomery, Alabama. Transport. Plan. Tech. 2010, 33(8), 679-693.
17. Farooq, B.; Miller, E.J. Towards integrated land use and transportation: A dynamic disequilibrium based micro simulation framework for built space markets. Transp. Res. Part A2012, 46(7), 1030-1053.
18. Su, H.; Wu, J.; Tan, Y.; Bao, Y.; Song, B.; He, X. A land use and transportation integration method for land use allocation and transportation strategies in China. Transp. Res. Part A2014, 69, 329-353.
19. Iacono, M.; Levinson, D.; El-Geneidy, A. Models of transportation and land use change: A guide to the territory. J. Plan. Lit. 2008, 22(4), 323-339.
20. Waddel, P. Integrated land use and transportation planning and modeling: addressing challenges in research and practice. Transp. Rev.2011, 31(2), 209-229.
21. Bartholomew, K. Land use-transportation scenario planning: promise and reality. Transportation2007, 34, 397-412.
22. Levine, J.; Inam, A. The market for transportation-land use integration: Do developers want smart growth than regulations allow? Transportation2007, 31(4), 409-427.
23. Nijkamp, P.; Borzacchiello, M.T.; Ciuffo, B.; Torrieri, F. Sustainable urban land use and transportation planning: A cognitive decision support system for the Naples metropolitan area. Int. J. Sustain. Transp.
2007, 1(2), 91-114.
24. Lemp, J.D.; Zhou, B.; Kockelman, K.M.; Parmenter, B.M. Visioning versus Modeling: Analyzing the land-use-transportation futures of urban regions. J. Urban Plan. D. ASCE 2008, 134(3), 97-109.
25. Bertolini, L.; Clercq, F. L; Kapoen, L. Sustainable accessibility: a conceptual framework to integrate transport and land use plan-making. Two test-applications in the Netherlands and a reflection on the way forward. Transp. Policy2005, 12, 207-220.
26. Geurs, K.; Zondag, B.; Jong, G.D.; Bok, M.D. Accessibility appraisal of land-use/transport policy strategies: More than just adding up travel-time savings. Transp. Res. Part D2010, 15, 382-393.
27. Coppola, P.; Papa, E. Accessibility planning tools or sustainable and integrated land use/transport (LUT) development: an application to Rome. Procedia Soc. Behav. Sci.2013, 87, 133-146.
28. Badoe, D.A.; Miller, E.J. Transportation-land-use interaction: empirical findings in North America, and their implications for modeling. Transp. Res. Part D2000, 5(4), 235-263.
29. Abbs, K.A.; Bell, M.G.H. System dynamics applicability to transportation modeling. Transp. Res. Part A
1994, 28(5), 373-390..
30. Haghani, A.; Lee, S.Y.; Byun, J.H. A system dynamics approach to land use/transportation system performance modeling Part II: Application. J. Adv. Transp. 2003, 37(1), 43-82.
31. Shen, Q.; Chen, Q.; Tang, B.; Yeung, S.; Hu, Y.; Cheung, G. A system dynamics model for the sustainable land use planning and development. Habitat Int.2009, 33(1), 15-25.
32. Pfaffenbichler, P.; Emberger, G.; Shepherd, S. A system dynamics approach to land use transport interaction modeling: the strategic model MARS and its application. Syst. Dyn. Rev. 2010, 26(3), 262-282. 33. Xu, X.; Kouhpaenejad, A. Simultaneous equation Tobit analysis of arterial road crash rates. P. I. Civil