Pharmacophore 2011, Vol. 2 (4), 73
1
- 87
1
ISSN 2229 – 5402
Pharmacophore
(An International Research Journal)
Available online at http://www.pharmacophorejournal.com/
Original Research Paper
DEVELOPMENT AND VALIDATION OF LC-MS/MS METHOD FOR THE
ESTIMATION OF ACYCLOVIR IN PHARMACEUTICAL DOSAGE FORM
P. Susantakumar
1*
, Ajay Gaur
2, Piush Sharma
31
*
Department of Pharmaceutical Sciences,
Singhania University, Rajasthan, India
2
L.M. College of Sc. & Tech. (Pharmacy),
Jodhpur, India
3
Maharisi Arvind College of Pharmacy,
Amabari, Jaipur, India
ABSTRACT
The objective of this study was to validate a simple, specific, accurate and precise solid phase high performance liquid chromatographic method with Tandem Mass Spectrometry-Waters Quattro Premier XE method for the determination of acyclovir in human plasma using Ganciclovir as Internal Standard (IS). The precision and accuracy data have to fulfill the requirements for quantification of the analytes in biological matrices to generate data for bioequivalence, bioavailability, pharmacokinetic or toxicology investigations. A Hypersil GOLD C18, 5µ column having 4.6 x 50 mm internal diameter in binary gradient mode with flow rate was 0.5 mL/min of mobile phase containing ammonium acetate and acetonitrile were used. The chromatographic separation was achieved by using elution solution consisting of acetonitrile and waters (80:20%, v/v)], diluent solution of methanol and water (50:50%, v/v)] were monitored on a triple quadrupole mass spectrometer, operating in the multiple reaction monitoring (MRM) mode. The method was validated over the concentration range 5.0-5000.0 ng/mL, by using 500 µL plasma samples. Limit of detection and limit of quantification were found 5.0 ng and 30.0 ng respectively. The retention time for Acyclovir and Internal Standard were 1.24 min and 1.65 min respectively and overall chromatography run time was 2.24 minutes. The mean recovery of Acyclovir (89.09%) and IS (98.84%) from spiked plasma samples was consistent and reproducible. The method was validated for linearity, accuracy, precision, specificity, limit of detection, limit of quantification and robustness. The intra- and inter-day precision and accuracy values were found to be within the assay variability limits as per the FDA guidelines. The developed assay method was applied to a clinical pharmacokinetic study in human volunteers.
Keywords: Acyclovir, Ganciclovir, LC-MS/MS, Linearity, Validation.
P. Susantakumar et al. / Pharmacophore 2011, Vol. 2 (4), 210-224 genital and labial herpes and for the acute
treatment of herpes zoster for the treatment varicella (chickenpox) in immunocompetent individuals.1-3 The chemical name for acyclovir is 2-amino-1,9-dihydro-9- [(2- hydroxyethoxy) methyl]-6H-purine-6-one, or 9- [(2-hydroxyethoxy) methyl]- guanine. Its molecular formula is C8H11N5O3, and molecular
weight 225.21 g/mol. The molecular formula of ganciclovir (Internal Standard) is C9H13N5O4 and
of developed method according to ICH guide lines.25
MATERIALS AND METHODS
Instrument
The liquid chromatographic system consisted of Quattro Premier XE mass detector containing Mass Lynx version 4.2 chromatographic data system, auto sampler and column oven. Chromatographic analysis was performed using molecular weight 255.23 g/mol.4 The molecular Hypersil GOLD C18 column with 4.6 x 50 mm structure of acyclovir and ganciclovir were
shown in figure1 and figure 2, respectively.
Acyclovir is commonly used as the free acid form in solid oral dosage forms, whereas the sodium salt is used in parenteral dosage forms.5-6 Acyclovir is normally present in a hydrated form consisting of three acyclovir molecules to two molecules of water, 7 corresponding to a theoretical water content of about 5%, but dose and solubility are normally expressed in units of anhydrous acyclovir.8 Acyclovir is described as „„slightly soluble in water‟‟ in different Pharmacopoeias. The solubility of acyclovir in most of the literature are range from 1.2 to 1.6 mg/mL at room temperature (22 to 250C).9-13 Acyclovir is an ampholyte with both weak acid and basic groups and pKa values are 2.27 and 9.25 at 370C 14 and the partition coefficient (log P) in n-octanol is - 1.57 at 220C.15
This liquid chromatography method was developed and validated for use in bioavailability and bioequivalence studies. Literature survey revealed that numerous HPLC methods have been reported for estimation of acyclovir in pharmaceutical formulations has been reported.16-24 Among chromatographic techniques; the reversed-phase (RP) HPLC was widely used for the analysis. Present study involves development of LC-MS/MS method using simple mobile phase which was sensitive and rapid for quantification of acyclovir in plasma samples as well as subsequent validation
internal diameter in binary gradient mode. Shimadzu electronic balance (Meter Toledo) was used for weighing purpose.
Reagents and Materials
Methanol and acetonitrile of HPLC grade was purchased from E. Merck, Mumbai, India. HPLC grade water was obtained by double distillation and purification through Milli-Q water purification system. Ammonium acetate of HPLC grade was procured from Sigma-Aldrich, Mumbai, India.
Preparation of Solutions
The buffer solution consisting of ammonium acetate diluted to 1000 mL Milli Q-water and adjusted pH 5.0 with formic acid and filtered through 0.22µm membrane filter. The elution solution consisting of acetonitrile and water (80:20%, v/v)], diluent solution of methanol and water (50:50%, v/v)] and mobile phase of ammonium acetate and acetonitrile (25:75%, v/v at pH 5.0) were prepared and filtered through Nylon (0.22µm) membrane sample filter paper and degas. The all solutions were stored at ambient temperature.
Preparation of Drug Stock Solution
P. Susantakumar et al. / Pharmacophore 2011, Vol. 2 (4), 210-224 through Nylon (0.22µm) membrane sample filter
paper and stored in refrigerator between 2-8 0C.
Preparation of Standard Blank and Zero Standard Samples
The standard blank samples were prepared by transferring 0.5 mL screened blank plasma into pre-labeled vials. The zero standard was prepared by adding 20µL of internal standard solution (1.0 µg/mL) into 0.5 mL screened blank plasma into a pre-labeled vial and vortex for 15 seconds.
Preparation of Calibration Curve Solutions and Samples
The calibration curve standards spiking solutions were prepared by adding 20 µL of drug stock solution (1.0 mg/mL) with diluents (Methanol: Water, 50:50%v/v) in different vials and add 20 µL internal standard solution (1.0 µg/mL) and vortex for 15 seconds. Prepare the calibration curve standards by spiking the respective calibration curve standards spiking solutions in screened blank plasma in different vials to obtain final concentration of 5, 10, 30, 50, 100, 500, 1000, 3000 and 5000 ng/mL of acyclovir.
Preparation of Quality Control Solutions and Samples
The quality control spiking solutions were prepared by adding 20 µL of drug stock solution (1.0 mg/mL) with diluents (Methanol: Water, 50:50%v/v) in different vials and add 20 µL internal standard solution (1.0 µg/mL) and vortex for 15 seconds. Prepare the quality control samples by spiking the respective quality control spiking solutions in screened blank plasma in different vials to obtain lower limit of quantification quality control (LLOQ QC), lower quality control (LQC), middle quality control-2 (MQC2), middle quality control-1 (MQC1), higher quality control (HQC) and upper limit of quantification quality control (ULOQ QC) samples of concentrations of 5, 30, 125, 500, 1250 and 5000 ng/mL of Acyclovir, respectively. The LLOQ QC and ULLOQ QC solution were
prepared only for method validation and screening of blank plasma samples.
Preparation of Working Solutions for Stability Testing
The working spiking solutions were prepared for long-term solution stability and short-term solution stability by adding drug stock solution (1.0 mg/mL) with diluents (Methanol: Water, 50:50%v/v) in different vials and vortex for 15 seconds.
Chromatographic Conditions
The high performance liquid chromatography method with Tandem Mass Spectrometry-waters Quattro Premier XE was developed for analysis of acyclovir in human plasma matrix. The mobile phase solution pumped into a Hypersil GOLD C18, 5µ column having 4.6 x 50 mm
internal diameters in binary gradient mode was maintained at 0.5 mL/min flow rate. The injection volume was 10 µL and acquisition time 2.0 minutes was equilibrated with mobile phase flowing through the system. The auto sampler temperature was 5±10C.
Calibration Curve
The calibrated curve and quality control samples were injected into liquid chromatographic system, chromatograms were obtained and peak area ratio was determined for each concentrations of acyclovir. Calibration curve of acyclovir was constructed by plotting peak area ratio versus applied concentrations of acyclovir by using linear calibration function fit curve and weighting method with offset 1/X2.
Method Validation
P. Susantakumar et al. / Pharmacophore 2011, Vol. 2 (4), 210-224 matrix effect, matrix factor, autosampler re-
injection reproducibility and ruggedness experiment.
System suitability
System suitability experiment was performed by injecting six consecutive injections at least once in a day with using aqueous MQC1 and MQC2 solutions. System performance experiment was performed by injecting sequence of injections at the beginning of analytical batch or before any re-injection. The Signal to Noise ratio should be more than or equal to 5.0 for LLOQ QC sample.
Carryover effect
The carryover effect of the autosampler was performed by injecting sequence of injections during the start of the method validation, new equipment, change in configuration or any major malfunction of autosampler.
Separation, specificity/selectivity and sensitivity
Separation, specificity and sensitivity of the analytical method were assessed in relation to interference peaks from endogenous plasma constitutes by comparing their retention times with those of Acyclovir and Internal standard. The specificity of the intended method was established by screening the standard blank plasma (without spiking with drug or internal standard). Ten different batches of plasma out of which, seven normal, one lipidemic and one hemolyzed plasma having anticoagulant and one heparinized plasma as an anticoagulant was screened. The specificity was evaluated by comparing the responses of interfering peak at the retention time of acyclovir and internal standards in the standard blank against the response of the respective extracted LLOQ and aqueous LLOQ. The sensitivity was evaluated by calculating the precision and accuracy of LLOQ (concentration should be equivalent to LLOQ) sample in each of the at least three acceptable precision and accuracy batches individually and in total (between batches).
Matrix effects
The matrix effect for the intended method was assessed by using concentrations equivalent to LLOQ prepared with seven different plasma batches/lots. Process and analyze the samples with freshly spiked calibration curve standards and at least two sets of batch qualifying quality control samples were prepared in previously screened biological matrix.
Matrix factors
The matrix factor was given as the ratio of analysis of the analytical response obtained from analysis of extracted blank matrix samples spiked after extraction with the acyclovir, at four concentrations (low, middle 1&2 and high) and
response obtained from reference solutions. Six batches of human plasma (including hemolytic and lipidemic lot) were processed and after extraction of the blank plasma samples, was spiked with acyclovir at concentration equivalent to those in the low, middle 1&2 and high Quality control extracted samples and internal standard at its working concentration.
Calibration of standard curve (Linearity and range)
The linearity of the method was determined by using standard plots associated with 8 point standard curve including LLOQ and ULOQ. Concentration of calibration curve standards was calculated against the calibration curve and the linearity of the method was evaluated by ensuring the acceptance of precision and accuracy of calibration curve standards. Two consecutive calibration curve standards should not be beyond the acceptance criteria. The lower limit of quantification (LLOQ) was the lowest concentration at which the precision expressed by relative standard deviations (RSD, CV %) is better than 20% and the accuracy (bias) expressed by relative difference of the measured and true value was also lower than 20%.
P. Susantakumar et al. / Pharmacophore 2011, Vol. 2 (4), 210-224
Precision and accuracy
The within-run and between-run percentage mean of precision and accuracy of the acyclovir were measured by the percent coefficient by using 6 replicate samples of variation over the concentration range of LLOQ, low, middle 1&2 and high quality control samples for the three precision and accuracy batches to their nominal values. The acceptable % coefficient of precision and accuracy should be less than 15%. The between and within batch % mean precision and accuracy for LQC, MQC1, MQC2 and HQC samples were within the range of 85.00-115.00% and for the LLOQ QC within the range of 80.00- 120.00% respectively.
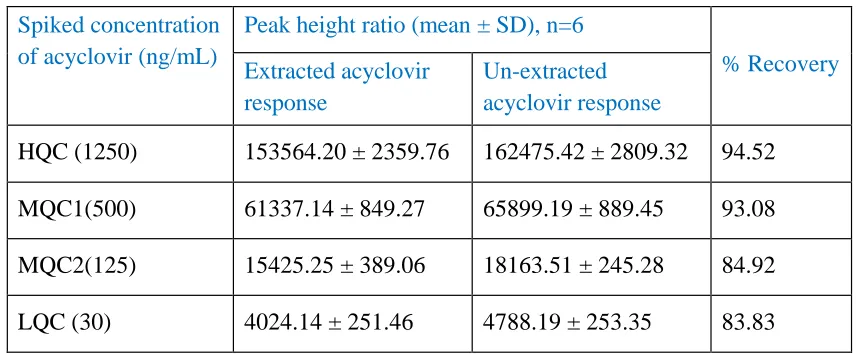
Recoveries
The % mean Acyclovir recoveries was determined by comparing the mean peak area of the 6 replicates of extracted plasma quality control samples at high, middle 1&2 and low concentrations against respective mean peak area of the 6 replicates of un-extracted quality control samples at high, middle 1&2 and low concentrations. A good recovery should be more than 90%. The % mean Internal Standard recovery was determined by comparing the mean peak area of internal standard in the extracted plasma quality control samples at MQC1 and MQC2 concentration against the mean peak area of internal standard in the un-extracted quality control samples at MQC1 and MQC2 concentrations.
Dilution integrity
The dilution integrity of the method was evaluated by diluting the stock solution prepared as spiked quality control sample at concentration 1.5-2 times above the concentration of the highest standard in the calibration curve in the screened biological matrix. Conduct dilution integrity experiment by using six replicates each of diluted quality control (1/2) and diluted quality control (1/10) samples. Process and analyze the diluted quality control samples along
with freshly spiked calibration curve standards and at least two sets of batch qualifying quality controls (at lower and higher).
Ruggedness
Ruggedness of the method was evaluated by using different analyst and different column of the same make and model or different equipment of the same make and model. The ruggedness experiment should meet the acceptance criteria for linearity and intra-batch accuracy & precision.
Stability of Acyclovir and Ganciclovir (IS)
Short term stock solution stability
Short term stock solution stability for acyclovir and internal standard were performed at the stock concentration by using six consecutive injections of aqueous standard equivalent to ULOQ concentration and working concentration respectively after storage of at least 6 hours at ambient temperature. Stability was assessed by comparing the stock dilutions of acyclovir and Internal Standard prepared from the freshly prepared stock solutions (comparison) against stock dilutions of Internal Standard prepared from the stock solutions stored at ambient temperature (stability). Short term stock solution stability was evaluated by comparing the mean response of stability samples against mean response of comparison samples.
Long term stock solution stability
P. Susantakumar et al. / Pharmacophore 2011, Vol. 2 (4), 210-224 (comparison) against stock dilutions of acyclovir
and internal standard prepared from the stock solutions stored at 2-8°C (stability). Long term stock solution stability was evaluated by comparing the mean response of stability samples against mean response ratios of comparison samples.
Working solution stability
Short term stability (at least 06 hours at ambient temperature) and long term stability (at least 04 days at 2-8°C) for working solutions of drug (stock solution ULOQ and LLOQ) and Internal Standard were performed by using six consecutive injections of equivalent aqueous standards prepared from fresh and stored solutions. Short term stability and long term stability of working solution were evaluated by comparing the mean response of stability samples against mean response of comparison samples.
Stability of Drug in Biological Matrix
Perform the matrix stability experiment by using freshly prepared calibration curve standard and two replicates of freshly prepared batch qualifying quality control samples at HQC and LQC levels. Stability studies in biological matrix were conducted in the various conditions at LQC and HQC levels as described below:
Freeze thaw stability
Freeze thaw stability of the spiked quality control samples were determined after 1st and 5th freeze thaw cycles stored at -20±5°C. Six replicates of each HQC and LQC samples were used for assessing each freeze thaw experiment (for first and fifth cycle at both the freezing temperatures). The first freeze-thaw cycle was of at least 24 hours followed by minimum of 12 hours for subsequent cycles. Process and analyze freeze thaw stability samples along with freshly spiked calibration curve and comparison samples (6 replicates of each LQC and HQC) in screened biological matrix. Evaluate the freeze thaw stability on the basis of % change of LQC and
HQC samples. The % Change and % CV of LQC and HQC should be within ± 15.00 and ≤ 15.00 respectively.
Bench top stability
Spiked quality controlled samples (6 replicates of each LQC and HQC) were stored in deep freezer at temperature -20±5°C, which was retrieved after minimum 12 hours of freezing and was kept at ambient temperature on working bench for recommended period of at least 06 hours. Six replicates of each HQC and LQC samples were used for assessing the bench top stability experiment. Upon the completion of recommended period, process and analyze bench top stability samples along with freshly spiked calibration curve and comparison samples (6 replicates of each LQC and HQC) in screened biological matrix. Evaluate the bench top stability on the basis of % change of LQC and HQC samples.
Autosampler re-injection reproducibility
Autosampler re-injection reproducibility was evaluated by re-injecting accepted precision & accuracy batch, which were stored preferably in either autosampler or in refrigerator for at least 24 hours or as per requirement.
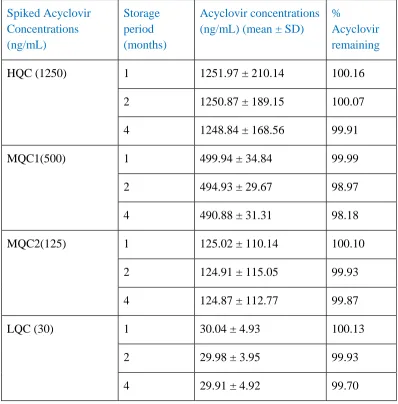
Long Term Stability of Acyclovir and Internal Standard in Biological Matrix
The long-term stability of acyclovir stability samples of LQC, MQC1, MQC2 and HQC and internal standard samples were kept frozen in vials at -20 ± 5 0C for 1, 2 and 4 months (expected duration of the sample storage and analysis) were assessed along with freshly processed calibration and comparison samples (six samples each of LQC, MQC1, MQC2, HQC and internal standard). The initial acyclovir concentration freshly after sample treatment preparation was assumed to be 100%. The selection of the stability duration on the basis of the characteristic of the analyte(s).
P. Susantakumar et al. / Pharmacophore 2011, Vol. 2 (4), 210-224 Stock Solution Verification
The stock solution verification was conducted by preparing the stock solution each of acyclovir and internal standard in diluted by two different analysts. Analysts were prepared two vials (from each stock solution prepared) by spiking 20 µL of working calibration standard and 20 µL of working internal standard level in 960 µL of elution solution. The CV% of response ratio of six replicate injections from stock solutions of acyclovir and for standard was 2.54 and 3.48, respectively.
System Suitability
System performance experiment was performed by injecting six consecutive injections at the beginning of analytical batch or before any re- injection and signal to noise ratio was 29.2 for LLOQ QC sample and %CV of ratio was 9.86, respectively. Injector carryover test was performed and there was no significant injector carryover observed.
Separation, Specificity/Selectivity and Sensitivity
Selected blank human plasma from six different sources and were carried through the extraction procedure and chromatographed to determine the extent to which endogenous human plasma components may contribute to chromatographic interference with the acyclovir or internal standard. One hemolyzed and one lipemic plasma were also checked for specificity along with this run. Figure 03 to 04 shows the typical chromatograms obtained from LC-MS/MS analysis of plasma spiked with internal standard and plasma added with acyclovir, respectively. The retention time of acyclovir and internal standard were approximately 1.24 and 1.65 minutes, respectively. No significant interference was observed in six different lots of human plasma, hemolyzed plasma and lipemic plasma samples. The peaks were completely separated and there was no interference peaks from endogenous substances in plasma that was co- eluted with acyclovir as well as the internal standard. The acyclovir lower limit of quantitation, signal to noise ratio and %CV of
area ratio were 5.0ng/mL, 29.2 and 9.0% respectively. The overall chromatography run time was 2.24 minutes.
Matrix Factor
Samples of the relevant biological matrix from six different sources were collected. The lower calibration standard samples from each source were prepared and injected along with the six replicates of aqueous lower calibration standard level concentrations. The %CV of matrix factor for acyclovir and internal standard were 4.69 and 1.39 and % CV of matrix factor for internal standard normalized was 4.89, respectively.
Calibration of Standard Curve (Linearity and Range):
The calibration curve was constructed between peak height ratios of acyclovir to the internal standard against acyclovir concentrations as given in Figure 05. Linearity was demonstrated by multiple analysis of spiked plasma sample containing Acyclovir between 5.0 to 5000.0 ng/ml calibration ranges. The regression equation of acyclovir concentration over its peak area ratio was found to be y = 0.1383x + 0.012, where x is the concentration of acyclovir and Y is the respective peak area. The regression coefficient (r2) is 0.9998. A good linear relationship with the coefficient of determination (r2) of more than 0.99 was employed for determining of acyclovir concentration in plasma. Back calculations were made from the calibration curves to determine Acyclovir of each calibration standard. The lower limit of quantification (LLOQ) was established at 5.0 ng/mL with the coefficient of variation of 14.3% indicates the sensitivity of the method. Analyzed plasma acyclovir concentrations below the quantification limit were defined as zero ng/mL.
Recovery
P. Susantakumar et al. / Pharmacophore 2011, Vol. 2 (4), 210-224 extracted blank plasma were eluted. The
recovery results were based on a comparison of the LC -MS/MS response from plasma (un- extracted) to those from extracted plasma blank. The mean % recovery for LQC, MQC2, MQC1 and HQC are 83.83, 84.92, 93.08 and 94.52 respectively. The mean % recovery for internal standard is 89.09. The recovery of Ganciclovir (IS) from biological matrix was 98.84%.
Precision and Accuracy:
Between–run accuracy and precision:
The between-run accuracy and precision evaluation were assessed by the repeated analysis of human plasma samples containing different concentrations of acyclovir on separate occasions. A single run consisted of a calibration curve, six replicates of lower limit of quantitation (LLOQ), low, medium (1&2) and high quality control samples and results are expressed as the percentage of accuracy of the analytical method presented in Table II. The between-run % coefficient of variation ranged from 2.77 to 5.56. The between-run % of accuracy value was ranged from 99.12 to 101.25 respectively.
Within-run accuracy and precision:
Analyzing replicate concentrations of acyclovir in human plasma performed within-run accuracy and precision evaluations. The run consisted of a calibration curve plus a total of 30 spiked samples, including six replicates each of the lower limit of quantitation (LLOQ), low, medium (1&2) and high quality control samples. The between-run (inter-day) precision and accuracy of the assay procedure are shown in Table III. The within-run % coefficient of variation ranged from 2.32 to 8.51. The within- run % of accuracy value was ranged from 97.50 to 99.93 respectively.
Dilution Integrity
Dilution quality control was diluted fifth and tenth times in human plasma. Prior to extraction, six samples each of fifth and tenth diluted samples were processed and analyzed with freshly processed calibration samples. The calculated concentrations, including the dilution factor for 1/5th and 1/10th yielded coefficient of variation of 5.16 and 1.92 respectively. Percentage of nominal values for dilution factor
1/5th and 1/10th were 103.88 and 96.71 respectively.
Ruggedness
Different analyst with different column defines ruggedness. The run consisted of a calibration curve and a total of 18 spiked samples, including 6 replicate each of the low, medium and high quality control samples. The % coefficient of variation ranged from 1.03 to 12.12 and the percentage of nominal values ranged from 96.24 to 107.27.
Short Term Stock Solution Stability
Short term stock solution stability at room temperature
Stock solution each of acyclovir and internal standard were stable after approximately 0.6 Hrs and 30 Min at room temperature. For acyclovir and internal standard the % change was -2.56 and -6.18 respectively.
Short term stock solution stability at refrigerator
(2-8 0C)
Stock solution each of acyclovir and internal standard were stable after approximately 08 Hrs and 30 Min at refrigerated temperature 2-8 0C. For acyclovir and internal standard the % change was -1.16 and -0.84 respectively.
Short Term Working Solution Stability
Short term working solution stability at room temperature
One solution each of acyclovir and internal standard solution were stable after approximately 08 Hrs and 30 Min at room temperature. For internal standard the % change found is -4.62.
Short term working solution stability at
refrigerator (2-8 0C)
One solution each of acyclovir at working calibration standard level and internal standard solution at working internal standard solution level were stable after approximately 06 Hrs and 30 Min at refrigerated temperature 2-8 0C For internal standard the % change found was 0.75.
Long Term Tock and Working Solution Stability
P. Susantakumar et al. / Pharmacophore 2011, Vol. 2 (4), 210-224
Long term stock solution stability in refrigerator
between 2-8 0C
Solution each of acyclovir at working curve standard level and internal standard solution at working internal standard level were stable for 165 days. For acyclovir and internal standard, the % change was 2.23 and 1.62 respectively.
Long term working solution stability in
refrigerator between 2-8 0C
Working solution each of acyclovir at working curve standard level and internal standard solution at working internal standard level were stable for 165 days. For acyclovir and internal standard, the % change found is 2.30 and -0.14 respectively.
Bench Top Stability
The bench top stability samples each of low and high QC (stability samples) was kept on bench at room temperature was found stable at approximately 14 Hrs and 30 Min. The % change for LQC and HQC were 2.27 and 5.97 respectively.
Freeze and Thaw stability (at -20 ± 5 0C) The freeze and thaw stability samples each of LQC and HQC were found to be stable in human plasma after four freeze and thaw cycles (at -20 ± 5 0C). The % change for LQC and HQC were 1.85 and 1.05 respectively.
Autosampler Stability
The stability samples each of LQC and HQC was found to be stable for approximately 70 Hrs and 00 Min in autosampler (at 5 ± 3 0C). The % change for LQC and HQC were -0.78 and 0.29 respectively.
Long term stability of Acyclovir and Internal Standard in Biological Matrix (Human Plasma)
Process and analyze freshly spiked calibration curve standards and six replicates of each LQC, MQC (1&2) and HQC samples and internal standard solutions for first day stability assessment and stability was assessed by comparing the stability samples against first day samples. The long-term stability results of the acyclovir in plasma at concentration are given in Table IV. The % acyclovir change found for
LQC, MQC1, MQC2, HQC and internal standard were 2.45, 2.21, 1.89, 3.15 and 3.83 respectively. The % mean long term working solution stability for Acyclovir and Internal Standard samples were in the range of 90-110% and % CV was within 15.00%. The result suggest that acyclovir was stable in human plasma at -20 ± 5 0C for at least 4 months and expected to be more stable at -70±5°C.
DISCUSSION
P. Susantakumar et al. / Pharmacophore 2011, Vol. 2 (4), 210-224 the absence of additional peaks indicates no
interference of the endogenous substances in plasma matrix. The high percentage of recovery of acyclovir was found to be 94.52% indicates that the proposed method is highly accurate.29 The percentage accuracy and precision studies obtained were less than 15% for QC sample and less than 20% for LOQ QC samples revealed that developed method was accurate and precise as per the FDA guideline. The limit of detection and limit of quantitation for acyclovir was found to be 10ng and 30ng, indicates the sensitivity of the method and was highly reproducible with excellent chromatography properties.30 Hence this developed assay method should be applied to estimation of acyclovir in different bioavailability and bioequivalence studies.
CONCLUSION
Proposed study describes new LC-MS/MS method for the estimation of acyclovir in pharmaceutical formulation. The method was validated and found to be simple, sensitive, accurate and precise. Percentage of recovery shows that the method is free from interference of the excipients used in the formulation. Therefore the proposed method can be used for routine analysis of estimation of acyclovir to a clinical pharmacokinetic study in human volunteers.
ACKNOWLEDGEMENT
The authors are very thankful to Singhania University, Rajasthan, India, for financial support given to this study.
Table 1: Recovery of acyclovir in spiked plasma
Spiked concentration of acyclovir (ng/mL)
Peak height ratio (mean ± SD), n=6
% Recovery Extracted acyclovir
response
Un-extracted acyclovir response
HQC (1250) 153564.20 ± 2359.76 162475.42 ± 2809.32 94.52
MQC1(500) 61337.14 ± 849.27 65899.19 ± 889.45 93.08
MQC2(125) 15425.25 ± 389.06 18163.51 ± 245.28 84.92
LQC (30) 4024.14 ± 251.46 4788.19 ± 253.35 83.83
Table 2: Between-run precision and accuracy of the analytical method for acyclovir in plasma
Acyclovir concentrations (ng/mL)
%CV %
Accuracy
Added Measured (mean ± SD)
HQC (1250) 1250.59 ± 142.37 4.16 100.04
MQC1(500) 506.25 ± 167.19 5.20 101.25
MQC2(125) 124.45 ± 38.14 2.77 99.56
LQC (30) 29.68 ± 1.44 4.95 98.33
P. Susantakumar et al. / Pharmacophore 2011, Vol. 2 (4), 210-224
Table 3: Within-run precision and accuracy of the analytical method for acyclovir in plasma
Acyclovir concentrations (ng/mL)
%CV %
Accuracy
Added Measured (mean ±
SD)
HQC (1250) 1249.18 ± 156.07 8.51 99.93
MQC1(500) 496.15 ± 20.07 6.48 99.23
MQC2(125) 124.07 ± 40.04 3.42 99.26
LQC (30) 29.25 ± 1.59 3.58 97.50
LLOQ QC(5) 4.98 ± 0.42 2.32 99.60
Table 4: Stability of acyclovir in spiked plasma stored at -20 ± 5°C
Spiked Acyclovir Concentrations (ng/mL)
Storage period (months)
Acyclovir concentrations (ng/mL) (mean ± SD)
%
Acyclovir remaining
HQC (1250) 1 1251.97 ± 210.14 100.16
2 1250.87 ± 189.15 100.07
4 1248.84 ± 168.56 99.91
MQC1(500) 1 499.94 ± 34.84 99.99
2 494.93 ± 29.67 98.97
4 490.88 ± 31.31 98.18
MQC2(125) 1 125.02 ± 110.14 100.10
2 124.91 ± 115.05 99.93
4 124.87 ± 112.77 99.87
LQC (30) 1 30.04 ± 4.93 100.13
2 29.98 ± 3.95 99.93
P. Susantakumar et al. / Pharmacophore 2011, Vol. 2 (4), 210-224
Figure1: Molecular structure of acyclovir
Figure2: Molecular structure of ganciclovir (Internal Standard)
Figure3: Typical chromatogram of LC-MS/MS analysis of spiked ganciclovir (IS) in
plasma
Figure4: Typical chromatogram of LC-MS/MS analysis of acyclovir and ganciclovir (IS) in
P. Susantakumar et al. / Pharmacophore 2011, Vol. 2 (4), 210-224
10
8
6
4
2
0
0 1000 2000 3000 4000 5000 6000
Concentration (ng/mL)
Figure5: Typical calibration curve of acyclovir in plasma analyzed by LC -MS/MS
REFERENCES
1. Fletcher, C and Bean, B (1985), “Evaluation of oral acyclovir therapy”,
Drug Intell Clin Pharm, 19,518-24. 2. O‟Brien, JJ and Campoli-Richards, DM
(1989),”Acyclovir: an updated review of its antiviral activity, pharmacokinetics properties and therapeutic efficacy”,
Drugs, 37,233-309.
3. Wagstaff, AJ; Faulds, D and Goa, KL (1994), “Acyclovir: a reappraisal of its antiviral activity, pharmacokinetic properties and therapeutic efficacy”,
Drugs, 47, 153-205.
4. Arnal, J and Gonzailwz-alvarez et.al. (2008), “Biowaiver monographs for immediate release solid oral dosage forms: Acyclovir”, J Pharm Sci, Vol. 97, 12.
5. (2005), “Consejo General de Colegios Oficiales de Farmace ´uticos”, Cata´logo de Especialidades Farmace ´uticas, 1316-1317.
6. American Society of Hospital Pharmacists (AHFS), (2004), “AHFS Drug Information”, Bethesda, MD, 765- 775.
7. Kristl, A; Srcic, S; Vrecer, F, Sustar, B and Vojnovic, D (1996), “Polymorphism and pseudopolymorphism: Influencing
the dissolution properties of the guanine derivative acyclovir”, Int J Pharm,
139,231-235.
8. MHRA (2007), “British Pharmacopoeia 2007”, The Stationery Office on behalf of the Medicines and Healthcare products Regulatory Agency (MHRA).
9. Bergstrom, CA; Norinder, U; Luthman, K and Artursson, P (2002) “Experimental and computational screening models for prediction of aqueous drug solubility”,
Pharm Res, 19,182-188.
10.Bergstrom, CA; Strafford, M; Lazorova, L; Avdeef, A; Luthman, K and Artursson, P (2003), “Absorption classification of oral drugs based on molecular surface properties”, J Med Chem, 46,558-570.
11.Kristl A. 1999. Estimation of aqueous solubility for some guanine derivatives using partition coefficient and melting temperature. J Pharm Sci 88:109– 110. 12.Luengo, J; Aranguiz, T; Sepulveda, J;
Hernandez, L and Von Plessing; C (2002), “Preliminary pharmacokinetic study of different preparations of aciclovir with beta-cyclodextrin” J Pharm Sci 91,2593-2598.
13.Von Plessing Rossel, C; Sepulveda Carreno, J; Rodriguez- Baeza, M and Bernabe Alderete, J (2000), “Inclusion
R
esp
o
n
P. Susantakumar et al. / Pharmacophore 2011, Vol. 2 (4), 210-224 complex of the antiviral drug acyclovir
with cyclodextrin in aqueous solution and in solid phase”, Quim Nova, 23,749-752. 14.Balon, K; Riebesehl, BU and Muller, BW
(1999), “Drug liposome partitioning as a tool for the prediction of human passive intestinal absorption”, Pharm Res, 16, 882-888.
15.Kristl, A; Pecar, S and Kmetec, V (1999), “Are calculated log P values for some guanine derivatives by different computer programs reliable?”, Int J Pharm 181, 219-226.
16.Bahrami, G; Mirzaeei, S and Kiani, A (2005), “Determination of acyclovir in human serum by high-performance liquid chromatography using liquid-liquid extraction and its application in pharmacokinetic studies”, J Chromatogr B, 816, 327-31.
17.Bangaru, RA; Bansal, YK; Rao, AR and Gandhi, TP (2000), “Rapid, simple and sensitive high-performance liquid chromatographic method for detection and determination of acyclovir in human plasma and its use in bioavailability studies”, J Chromatogr B Biomed Sci Appl ,739 (2),231-7.
18.Sharma, M; Nautiyal, P; Jain, S and Jain, D (2010), “Simple and rapid RP-HPLC method for simultaneous determination of acyclovir and zidovudine in human plasma”, JAOAC Int., 93(5), 1462-7. 19.Lin, H; Tian, Y; Tian, JX; Zhang, ZJ and
Mao, GG (2010), “Pharmacokinetics and bioequivalence study of valacyclovir hydrochloride capsules after single dose administration in healthy Chinese male volunteers”, Arzneimittelforschung, 60(3), 162-7.
20.Zhang, C and Dong, SN (1993), “Determination of acyclovir in human plasma by RP-HPLC”, Yao Xue Xue Bao, 28(8), 629-32.
21.
Fernández, M; Sepúlveda, J; Aránguiz, T and Von Plessing, C (2003), “Technique validation by liquid chromatography for the determination of acyclovir in plasma”, J Chromatogr B Analyt Technol Biomed Life Sci,. 791(1-2), 357-63.
22.Loregian, A; Gatti, R; Palù, G and De Palo, EF(2001), “Separation methods for acyclovir and related antiviral compounds”, J Chromatogr B Biomed Sci Appl, 764(1-2),289-311.
23.Yoshida, T; Takahashi, R; Imai, K; Uchida, H and Arai, Y(2010) ,“A simple, sensitive determination of ganciclovir in infant plasma by high-performance liquid chromatography with fluorescence detection”, J Chromatogr Sci,48(3),208- 11.
24.Weller, DR; Balfour HH, Jr and Vezina, HE (2009), “Simultaneous determination of acyclovir, ganciclovir, and (R)-9-[4- hydroxy-2-(hydroxymethyl) butyl] guanine in human plasma using high- performance liquid chromatography”,
Biomed Chromatogr, 23(8),822-7.
25.U.S. Department of Health and Human Services Food and Drug Administration Center for Drug Evaluation and Research (CDER) (2001), “Guidance for industry: Bioanalytical method validation”.
26.Yadav, M; Upadhyay, V; Singhal, P; Goswami, S and Shrivastav, PS (2009), “Stability evaluation and sensitive determination of antiviral drug, valacyclovir and its metabolite acyclovir in human plasma by a rapid liquid chromatography-tandem mass spectrometry method”, J Chromatogr B Analyt Technol Biomed Life Sci, 877 (8- 9), 680-8.
P. Susantakumar et al. / Pharmacophore 2011, Vol. 2 (4), 210-224 of acyclovir”, Arzneimittelforschung,
45,508-15.
28.Lin, H; Tian, Y; Tian, JX et. al.(2010),
“Pharmacokinetics and bioequivalence study of valacyclovir hydrochloride capsules after single dose administration in healthy Chinese male volunteers”,
Arzneimittelforschung, 60(3), 162-7. 29.Kanneti, R; Bhavesh, D; Paramar, D;
Shivaprakash, R and Bhatt, PA (2011), “Determination of penciclovir in human plasma by liquid chromatography- electrospray ionization tandem mass
spectrometry: application to a clinical pharmacokinetic study”, Biomed Chromatogr, 25(4),458-65.