Volume-7 Issue-1
International Journal of Intellectual Advancements
and Research in Engineering Computations
A study on basic production control problems at Sri Murugan Industries
and ways of solving them
Prof. N. Devaraj
1, A. Gulab John
2 1Associate Professor /MBA, Nandha Engineering College (Autonomous)
2
ndMBA Nandha Engineering College
ABSTRACT
Production controls are usually based on either mass production. Project planning and scheduling for unique products is not common in most manufacturing plants. This research is on basic production control problems in automobile industries and best way of solving them with reference to SRI Murugan industries. Its primary aim is to determine the basic production control problems in automobile industries and best way if solving them. The researcher also aims to find related to production control problems amo ng others.
INTRODUCTION
The subject of production management is studied under different headings such as production planning and control, production and inventory control and many more. Whatever may be the title of the subject, the contents of the subject are more or less one and the same. Productivity is mainly based on the Production Control. Production control involves raw material consolidation, human resource management and machinery management.
The control of production itself must be carefully planned and implemented indeed the most beautiful production plan cannot be very effective it if or not guaranteed
STATEMENT OF THE PROBLEM
The purpose of this study is to enhance the effectiveness of production system and to control the production issues in the organization.
OBJECTIVE OF THE STUDY
To identify the demographic profile of the respondents
To measure the challenges faced by the production department due to production control
SCOPE OF THE STUDY
This study helps to avoid bottleneck situations in production
This study helps to overcome production scheduling and monitoring problems in production.
LIMITATIONS OF THE STUDY
The data available limited to the SRI Murugan Industries.
The overall data of the SRI Murugan Industries is not available as usual most of the information is collected from the secondary data.
Due to time restrain it was not possible to study in depth
LITERATURE REVIEW
1. The work on literature review by Gungor et al. (1999) (331 articles and books) and Brito et al. (2002) (121 articles, books and web-sites) for their extensive review of literature on product recovery and reverse logistics is remarkable. Product take-back by producers during remanufacturing has been studied extensively by Doppelt et al. (2001). Gray et al. (2006), contributed towards product design in remanufacturing processes. They studied the importance of product design and its control in remanufacturing industry 2. Guintini et al. (2003) have studied about
various reasons for ineffective exploitation of remanufacturing resources for the productivity improvement. They also highlighted the various challenges involved in remanufacturing activities and demonstrated ways in which such challenges could be overcome. A thorough discussion on literature relevant to production planning and control is presented in Guide et al. (1999) [1].
RESEARCH METHODOLOGY
Research Design
A Master plan that specifies the method and procedures for collecting and analysing needed information.
Descriptive Research
Descriptive research design was used for the study, it is a fact finding investigation with adequate interpretation.
Sample Design
Sampling is the process of selecting a sufficient number of elements from the population. A Sample Design is a definite plan for obtaining a sample from the sampling frame. It refers to the technique or the procedure the researcher would adopt in
selecting some sampling units from which inferences about the population is drawn.
Probability Sampling
Probability sampling is a sampling technique where the samples are gathered in a process that does give all the individuals in the population equal chances of being selected.
Simple Random Sampling
A simple random sample is a subset of a statistical population in which each member of the subset has an equal probability of being chosen.
Size of The Sample
The Sample size is 100.
DATA COLLECTION
Primary Data
These are data which are collected for the first time directly by the Researcher for the Specific study undertaken by him. In this research primary data are collected directly from the Respondent by using Questionnaire [3].
Secondary Data
These are data which are already collected and used by someone preciously. In this research review of Literature, Details of the research are collected from the Internet.
STATISTICAL TOOLS USED
To analyse and interpret collected data the following simple percentage and ranking were used.
Simple Percentage Analysis
Hentry Garrett Ranking
Garrett’s ranking technique to find out the most significant factor which influences the respondents; Garrett’s ranking technique was used. As per this m ethod, respondents have been asked to assign the rank for all factors and the
outcomes of such ranking have been converted into score value with the help of the following formula:
Percent Position = 100 (Rij – 0.5) Nj
Where Rij = Rank given for the ith variable by
jth respondents
Nj= Number of variable ranked by jth
respondents.
DATA ANALYSIS
The Respondents participated in the research are from diversified background with age group, educational qualification, marital status, year of experience and income level.
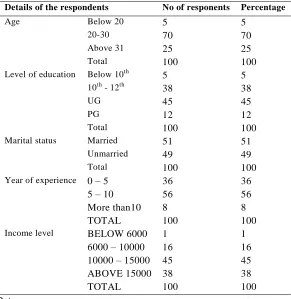
Table No 1: Demographic profile of the respondents
Details of the respondents No of responents Percentage
Age Below 20 5 5
20-30 70 70
Above 31 25 25
Total 100 100
Level of education Below 10th 5 5
10th - 12th 38 38
UG 45 45
PG 12 12
Total 100 100
Marital status Married 51 51
Unmarried 49 49
Total 100 100
Year of experience 0 – 5 36 36
5 – 10 56 56 More than10 8 8 TOTAL 100 100
Income level BELOW 6000 1 1
6000 – 10000 16 16 10000 – 15000 45 45 ABOVE 15000 38 38 TOTAL 100 100 Source: Primary Data
INTERPRETATION
From this study, it is evident that Age Group of the 70% of the respondents are between 21 – 30 years, 45% of the respondents have the Educational Qualification of UG, 51% respondents
Table No 2: Rank the problems faced by the respondents
S.No Problems Total score Rank
1 Equipment and material availability 2832 2
2 Scheduling with regards to project work 2646 3
3 Financial resources 503 8
4 Flexibility in time duration 3024 1
5 Risk assessment 1380 6
6 Monitoring production equipment 1004 7
7 Lead time 2235 4
8 Management system 1836 5
Source: Primary data
INTERPRETATION
From the above table it is evident that flexibility ranked as no.1 with a total score of 3024, Equipment and material availability ranked as no 2 with the total score of 2832, Scheduling with regards to project work ranked as no 3 with the total score of 2646, Lead time ranked as no 4
with the total score of 2235, Management system ranked as no 5 with the total score of 1836, Risk assessment ranked as no 6 with the total score of 1380, Monitoring production equipment ranked as no 7 with the total score of 1004, Financial resources ranked as no 8 with the total score of 503.
FINDINGS
The respondents ranked flexibility in time duration as no.1 with a total score of 3024.
The respondents ranked Scheduling with regards to project work as no 3 with the total score of 2646
The respondents ranked Lead time as no 4
2832
2646
503
3024
1380
1004
2235
1836
SUGGESTIONS
The flexibility in time duration can be overcome when the production process is pre-planned.
Equipment and raw material can be overcome when the raw materials is produced within the organization.
Greater sense of control and improving working condition for disabled employees.
Lead time can be reduced by ordering inventory more often.
CONCLUSION
There are different deficits in the planning of the battery assembly for a quality-oriented system.
Especially the consideration and integration of quality assurance systems in the very early assembly planning phase presents several challenges. With the help of the presented approach, quality critical product and process characteristics can be defined and appropriate quality assurance systems can be derived and described in a measurement equipment catalogue. A planning supporting configuration can integrate the quality assurance systems listed, because its requirements are taken into account when qualifying existing and adapting new measurement equipment. Finally, by this approach, the competitiveness of batteries can be improved and serve as serious solution for individual mobility.
REFERENCES
[1].Roland Berger Strategy Consultants: Powertrain 2020, The Li-Ion Battery Value Chain – Trends and implications. Stuttgart; 2011
[2].Yoshino A. Development of the Lithium-Ion Battery and Recent Technological Trends. Lithium-Ion Batterie – Advances and Applications. 1st. ed. 2014, 1-20.
[3].Fink, H.: Lithium-Ion Batteries go Automotive – Trends, Technologies, Value chain. E-mobile BW Spitzencluster Technologietag 2013. Stuttgart; 2013