Volume 9, Issue 08, 2019
80
Available at www.jpbms.info
Research article
Developing an UPLC-MSMS Method to
Quantify a Novel Anticancer Chalcone BOC26P
for Its Pharmacokinetic Study
In vivo
Lina Lin
1, Lexing Chen
1, Danyi Lu
2, Jun Xu
1*, Shaohui Cai
1*Author affiliations
1International Cooperative Laboratory of Traditional Chinese Medicine Modernization and Innovative Drug
Development of Chinese Ministry of Education (MOE), School of Pharmacy, Jinan University, 601 Huangpu Avenue West, Guangzhou 510632, China
2Shenzhen Key Laboratory for Molecular Biology of Neural Development, Guangdong Key Laboratory of
Nanomedicine, Institute of Biomedicine and Biotechnology, Shenzhen Institutes of Advanced Technology, Chinese Academy of Sciences, 1068 Xueyuan Boulevard, University Town of Shenzhen, Xili Nanshan, Shenzhen 518055, China
*These authors contributed equally to this work.
Address reprint requests to
Doctor Jun Xu, School of Pharmacy, Jinan University, No. 601 Huangpu Avenue West, Guangzhou 510632, China. Doctor Shaohui Cai, School of Pharmacy, Jinan University, No. 601 Huangpu Avenue West, Guangzhou 510632, China.
E-mail address: [email protected]; [email protected]
Abstract:
Objective BOC26P is a potent anticancer candidate which inhibits microtubule polymerization and shows strong cytotoxic activity against numerous cancer cell lines and drug resistant cell lines. To support the pharmacokinetic study of BOC26P, a rapid, selective and reproducible UPLC-MS/MS method was developed.
Method Dexamethasone sodium phosphate (DSP) was used as an internal standard (IS). Following protein precipitation by using methanol-acetonitrile solution (1:1, v/v) with an internal standard DSP, the processed
samples were chromatographed on an UPLC X Bridge 71 TM C8 column (4.6 mm × 100 mm, 3.5 μm) with a mobile
phase that consisted of acetonitrile and 2mmol/L ammonium acetate aqueous solution (containing 0.25% ammonia) with a gradient elution pumped at a flow rate of 0.4 mL/min. Mass spectrometric detection was
performed in the positive electrospray ionization mode by multiple reaction monitoring (m/z 428.84→198.92 and
472.90→434.93 for BOC26P and DSP, respectively). The quantification of BOC26P in rat plasma was fully verified.
Results The linearity was established in the range of 50 to 2000 ng/mL(r2≥0.99). The recovery of BOC26P from
spiked plasma were ranged from 96.7% to 110.5%. This method showed acceptable accuracy (3.7% to 6.3%) and precision (1.5% to 3.1%) both of intra- and inter-day.
Conclusion The developed method was successfully applied for three intravenous dose (2, 5, 12.5 mg/kg BOC26P) pharmacokinetics in male and female rats.
Key words
BOC26P, pharmacokinetics, liquid chromatography, tandem mass spectrometry.https://doi.org/10.5281/zenodo.3362987
Volume 9, Issue 08, 2019
81
INTRODUCTION
icrotubules are closely related to many physiological functions of cells, and the dynamic balance of microtubule systems is necessary for cells to carry out many critical cellular functions. Recombination of the microtubule network is required for cell life cycle and cell division[1,2]. The destruction of the microtubule arrangement and the
increase/decrease in the number of microtubules are associated with disordered cell proliferation[3]. Destruction of the cytoskeleton composed of microtubules will lead to lysis of
vascular endothelial cells, ultimately leading to ischemic necrosis of tumor tissue[4,5]. Drugs
targeting microtubules have promising application prospects for cancer therapy.
The inhibitory sites of tubulin are the paclitaxel site, the vinblastine site, the colchicine site, and the Lauliumalide site[6]. Currently, combretastatin A-4P (CA4P) has been approved for clinical
trials as Colchicine binding site inhibitor[7]. Zhu C et al.[8] designed a series of o-aryl chalcone
compounds synthesized with the natural product curcumin as the parent molecule, and found that OC26 is ofmost active in killing several cancer cell lines, including ovarian carcinoma cells, ileocecum carcinoma cells, lung carcinoma cells and breast carcinoma cells.. They also found that OC26 binds to the colchicine site of tubulin to inhibits microtubule aggregation[8]. However,
the further application of OC26 is restricted due to its poor water-solubility. Thus, BOC26P, a water-soluble phosphate derivative of OC26, was generated and then examinated for its potential usage in chemotherapy[9]. Similar with OC26, BOC26P excerted potent in vitro
cytotoxicity against many cancer cell lines and drug-resistant cells (reference[9] and unpublished
data from our lab). BOC26P did not directly jnhibit tubulin aggregation, but was hydrolyzed by alkaline phosphatase (ALP) to release OC26 in vitro and in vivo. Nevertheless, the antitumor effect of BOC26P was superior than OC26 in an A549 xenograft model[9], suggesting other
factors, such as tumor microenviroment, may contribute to the in vivo activity of BOC26P. To promote the developmental process of BOC26P as a new anticancer drug, it is necessary to understand its pharmacokinetic profile in vivo. Currently, no accurate and reproducible analytical method has been established and verified to quantify BOC26P. Ultraperformance liquid chromatography tandem mass spectrometry (UPLC-MS/MS) is a powerful analytical technique for determination of analyte(s) in biofluid due to its inherent high efficiency, sensitivity and selectivity. Thus, we first established and fully verified an UPLC-MS/MS method to determine BOC26P based on the US FDA, EU and China guidelines. Subsequently, the developed method was applied to the pharmacokinetic study of BOC26P.
EXPERIMENTAL
EXPERIMENTAL MATERIALS
CHEMICALS AND REGENTS
BOC26P (Lot:20180807, purity: 99.1%) was produced from WuXi AppTec (Shanghai, China). Dexamethasone sodium phosphate (DSP, Lot:B27W6E1, purity: ≥98%) was purchased from Sigma Aldrich (St. Louis, MO, USA). DSP was used as an internal standard (IS). HPLC grade acetonitrile (Lot: WXBC7149V) was purchased from Sigma Aldrich (St. Louis, MO, USA). HPLC grade ammonium acetate (Lot: 176608) was procured from Fisher Chemical (Pittsburgh, USA). HPLC grade ammonia (Lot: H1817095, purity: 25%) was procured from Aladdin (Shanghai, China). All other chemicals were analytical grade. Ultrapure water was from a Mill-Q Advantage A10 (Billerica, MA, USA) water purification system. Drug-free whole blood was collected from adult and healthy male and female Sprague-Dawley rats provided by the Laboratory Animal Services Division of the institute, and plasma was separated after centrifuging the collected blood at 3000 rpm for 10 min. The plasma samples from male and female rats were pooled separately and stored at -80°C till use.
Volume 9, Issue 08, 2019
82
UPLC–MS/MS with ACQUITY I-Class UPLC and a Xevo TQ-S triple quadrupole mass spectrometer (Waters Corp., Milford, MA, USA) equipped with an electrospray ionization (ESI) interface were used to analyze the compounds. The UPLC system was comprised of a Binary Solvent Manager (BSM) and a Sample Manager with Flow-Through Needle (SM-FTN). The UNIFI 1.6.1 software (Waters Corp., Milford, MA, USA) was used for data acquisition and instrument control.
ANIMAL
Eighteen healthy male and female Sprague-Dawley (SD) rats (Weight:200e used to analyze the compounds. The UPLC system was comprised of a Binary Solvent Manager (BSMa SPF animal room of Laboratory Animal Research Center in Sichuan Greentech Biotechnology Co., Ltd. (Sichuan, China). The jugular vein puncture technique was established without surgery and anesthesia We first removed the rat neck hair using a medical depilatory cream, and then puncture it under the clavicle from the head to the heart in the rat's jugular sinus using a 1 mL syringe. Finally, 150 μL of blood was collected at each time point. The operator can complete the blood collection within the tolerances allowed by the blood collection time. The operation complies with the requirements of the Good Laboratory Practice (GLP). All animal protocols were approved by an institutional review board and animal ethics committee before performing the research. All experiments, euthanasia and disposal of carcasses were carried out as per the guidelines of local ethics committee for animal experimentation.
UPLC–MS/MS CONDITION
BOC26P and DSP (IS) were separated using a Waters XBridgeTM C8 column (4.6 mm × 100 mm
i.d.; 3.5 μm, Waters, USA) maintained at 50℃. The initial mobile phase consisted of pure acetonitrile (eluent B) and water (eluent A) containing 2 mM ammonium acetate and 0.025% ammonia with gradient elution at a flow rate of 0.4 mL/min. The gradient elution program was as follows: 0-0.3 min, 10% A, Curve 6; 0.3-1.2 min, 10-20% A, Curve 1; 1.2-1.6 min, 20-90% A, Curve 6; 1.6-2.2 min, 90% A, Curve 6; 2.2-3.5 min, 90-10%A, Curve 1. The total run time of the analytes was 3.5 min and the injection volume was 1 μL. After each injection, the sample manager underwent a needle wash with 10% methanol.
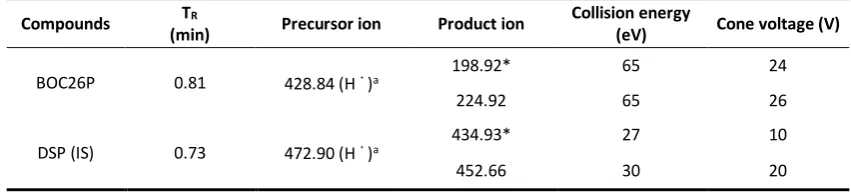
The mass spectrometric detection was performed on a triple-quadrupole mass spectrometer equipped with an ESI interface in a positive mode. The optimal MS parameters were as follows: desolvation gas flow, 650 L/h; cone gas flow, 150 L/h; desolvation temperature, 550℃; source temperature, 150℃; capillary voltage, 3 kV. The multiple reaction monitoring (MRM) mode of m/z 428.84 → 198.92 for BOC26P and m/z 472.90 → 434.93 for IS was used as quantitative analysis, and m/z 428.84 → 224.92 for BOC26P and m/z 472.90 → 452.66 for IS was used as auxiliary qualitative analysis (Fig. 1). Collision energy and cone voltage of each ion pairs are shown in Table 1.
Table 1 The mass spectrometry parameters of BOC26P and IS.
Compounds TR
(min) Precursor ion Product ion
Collision energy
(eV) Cone voltage (V)
BOC26P 0.81 428.84 (H﹢)a 198.92* 65 24
224.92 65 26
DSP (IS) 0.73 472.90 (H﹢)a 434.93* 27 10
452.66 30 20
Volume 9, Issue 08, 2019
83
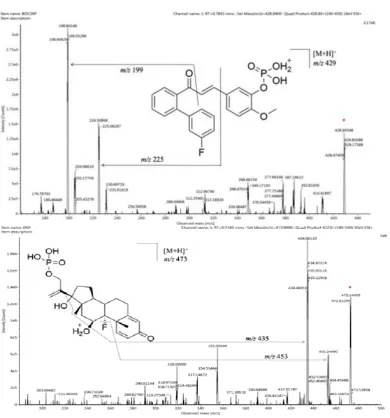
Fig. 1 Product ion spectra of BOC26P (a) and DSP (IS, b).
PREPARATION FOR CALIBRATION STANDARDS AND QUALITY CONTROL SAMPLES
Three or more stock solutions of BOC26P with a concentration of about 1 mg/mL in 10% methanol were prepared, and then were diluted a certain concentration with the corresponding solvent, separately analyzed and calculated the RSD of the peak area. Two of them were selectd until RSD <15%. One for preparing standard curves and one for preparing quality control samples. Stock solutions of IS (1.0 mg/mL) were prepared in 10% methanol. The solutions were vortex-mixed and stored at 4℃. The calibration standards were prepared by mixing blank rat plasma with appropriate amounts of BOC26P. Calibration standards (CC) were prepared by spiking 2.5 μL of working solution into 22.5 μL interference free rat plasma, as a bulk to achieve final concentrations of 50, 80, 100, 250, 500, 1000, 2000 ng/mL. Quality-control (QC) samples were prepared by the same way as the calibration standards, with concentrations of 50 ng/mL for Lower limit of quantification quality control (LLOQ QC), 100 ng/mL for Low quality control (LQC), 500 ng/mL for Middle quality control (MQC) and 2000 ng/mL for Highest quality control (HQC).
PRETREATMENT OF PLASMA SAMPLES
Volume 9, Issue 08, 2019
84
ng/mL). Samples were gently mixed using a bench top Eppendorf MixMate® at 3000 rpm for 3 minutes, followed by centrifugation at 13000 rpm for 10 minutes to remove any particulates. In order to reduce the solvent effect, 70 μL of the supernatant was mixed with 70 μL of high-purity water, and the precipitate was removed by centrifugation at 13000 rpm for 10 min. For the analysis, 1 μL of each supernatant was injected into the UPLC-MS/MS system.
METHOD VALIDATION
The validation was conducted according to the recommendations of the CHN NMPA (National Medical Products Administration)[10] and in compliance with the principles of Guidance for
Industry Bioanalytical Method Validation by the US FDA[11] , the European Medicines Agency[12]
and International Conference on Harmonization of technical requirements for registration of pharmaceuticals for human use (ICH)[13]. Six replicates (n = 6) of QC samples were processed at
each concentration to validate selectivity, linearity and LLOQ, residue, accuracy and precision, matrix effect, extraction recovery, dilution integrity and stability.
The selectivity of the method was determined to evaluate potential chromatographic interference. For this purpose, multiple reaction monitoring (MRM) chromatograms of samples under the following conditions were compared: blank drug-free rat plasma, blank plasma spiked with mixed IS, blank plasma spiked with mixed BOC26P and IS, and plasma sample from rat with internal standards. Interfering peaks were defined as areas > 20% of the LLOQ level peak area for each analyte.
The matrix effect on the respective analyte exanimated at two concentration levels (LQC and HQC) by comparing the peak areas of the post-extracted spiked QC samples with those of corresponding peak area obtained from standard solutions which were prepared by diluting the stock solutions with 50% methanol. In general, the acceptable RSD bias was set within ± 15%. The calibrations were analyzed in triplicate on three consecutive days to evaluate the linearity of this method. Calibration curves were prepared by plotting peak area ratios (drug/respective internal standard) versus nominal plasma concentrations. Seven calibration concentration levels in the range of 50 - 2000 ng/mL for BOC26P should be used for each calibration curves, in addition to the blank sample (processed matrix sample without analyte and without IS) and a zero sample (processed matrix with IS). Linear weighted least squares analysis was performed and a weighting factor of 1/X2 was adopted. A correlation coefficient (R2) > 0.99 was expected in
all calibration curves. RSD for calibration samples except LLOQ, were recommended to be less than 15%. The LLOQ was defined as the lowest concentration for which a precision of less than 20% was obtained over six measurements. The signal to noise ratio (S/N) of LLOQ samples exceeded 10.
A blank sample was inserted under the highest concentration sample for each standard curve injection sequence. The peak areas of the LLOQ sample, the highest concentration sample, and the blank incubation solution sample in the six standard curves were recorded. The peak area of the blank sample should not exceed 20% of the lower limit of quantitation.
The intra- and inter-day precision and accuracy of the method were assessed by the determination of QC samples at four concentration levels on the same day and latter three days using daily obtained calibration curves. The precision and accuracy were expressed by the RSD and RE, respectively, which the acceptable values of RE were required to be within ± 15%, except for the LLOQ within ±20%, and the RSD were required to be below 15%, except for the LLOQ with a limit of 20%.
Extraction recovery was estimated at two QC concentrations (LQC and HQC) by comparing the peak areas of QC samples with those of corresponding peak area obtained from standard solutions which were prepared by diluting the stock solutions with 50% methanol.
Volume 9, Issue 08, 2019
85
The stock solution and working solution stability were performed by comparing the area response of the stability samples stored at 4℃ for 15 days with the sample prepared from the fresh stock solution. Two levels of QC samples (LQC and HQC) were used to evaluate the stability of all analytes in rat plasma under different storage conditions. It contained short-term stability of the QC samples at room temperature for 4 h, long-term stability of the QC samples after storage at -80℃ for 20 days, post-preparation stability of the QC samples kept in the autosampler at room temperature for 48 h, and freeze-thaw stability after three complete freeze and thaw cycles ( -80℃ to room temperature as one cycle). The acceptable bias considered stable was within ±15%.
PHARMACOKINETIC APPLICATION
The current method was applied to a pharmacokinetic study. Eighteen healthy male and female SD rats were randomly divided into three groups by statistical software Stata 15, each contained 6 rats and received 2, 5, 12.5 mg/kg BOC26P (dissolved in pure water for injection) by intravenous administration. Blood samples (approximately 150 μL) were collected from the jugular vein before and 0.083, 0.167, 0.333, 0.5, 1, 1.5, 2.5, 4, 8 and 24 h after administration. The blood sample was placed in the heparin sodium anticoagulation tube and mixed for 8 times and then buried in ice. The sample was transported to the chemical analysis laboratory at 2-8℃
within 30 min after sample collection and centrifuged at 3000 rpm for 8 min at 4℃. The supernatant was frozen at -80℃. Rats are given drinking water after administration. The rats were intraperitoneally injected with 5% glucose solution at a dose of 2 mL/kg after 2 hours administration. Pharmacokinetic parameters were calculated using the Drug and Statistics software (DAS, version 3.2.4, Jinan University of Medicine, Guangzhou, China) and statistical significance was determined by the Stata software (version 15, Jinan University of Medicine, Guangzhou, China).
RESULTS AND DISCUSSION
SELECTION OF INTERNAL STANDARD COMPOUNDS
A structurally relevant, similar in polarity compound was selected as an internal standard to minimize the experimental variability. In the early stage of the method, propranolol, curcumin and DSP were selected as candidate internal standard compounds for analysis. The response of propranolol under positive ion mode is good, the compound is stable, but its extraction efficiency is not as good as that of DSP (close to BOC26P). Curcumin has no peak at the elution gradient of BOC26P. Since DSP satisfies all the requirement as an internal standard, it is selected as an internal standard compound.
OPTIMIZING THE LC-MS/MS CONDITIONS
Optimizing chromatographic conditions is critical for biological analysis. Through properly separating analytes and IS from endogenous or exogenous matrix components, high sensitivity, symmetrical peak shape and appropriate retention times can be achieved to improve quantitative limits and reproducibility[14]. The mobile phase plays a crucial role in capturing
Volume 9, Issue 08, 2019
86
detection of this compound is susceptible to impurities in pure water, a gradient of 0.3~1.2 min with 10% A ~ 20% A and 1.2~1.6 min with 20% A ~ 90% A is inserted in the elution gradient. The results showed that the retention times were approximately 0.81 min for BOC26P and 0.73 min for IS, respectively.
Both positive and negative ion mode with full scans analysis were performed on BOC26P and IS. The result showed that lower background noise and higher signal intensity of BOC26P and IS were observed by ESI positive mode. To obtain the most stable and the highest signal of the analytes, the MS parameters were optimized, such as desolvation gas flow, desolvation temperature, capillary voltage, collision energy and cone voltage. The others were set up from the recommended values for the instrument. The ions at m/z 428.84 [M+H]+ and m/z 472.90 [M+H]+ were the peaks in the MS spectra which had highest intensity of BOC26P and IS, respectively. After fragmentation in the collision cell, both BOC26P and IS have the product at m/z 96, which was the most stable and abundant ions. In order to avoid the detection of BOC26P and IS from being interfered with each other, we chose other highly product ions as quantitative ions. Fig.1 shows spectrum of BOC26P and IS with their chemical structures.
METHOD DEVELOPMENT AND VALIDATION
SELECTIVITY
BOC26P and IS in rat plasma are well separated using our developed method. The detection of BOC26P and IS does not interfere with each other. The average interference of the blank plasma endogenous substance to be tested was calculated to be 5.6%, and the interference coefficient to the internal standard was 0.1%. The MRM chromatogram of the sample is shown in Fig.2.
Volume 9, Issue 08, 2019
87
LINEARITY AND RESIDUE
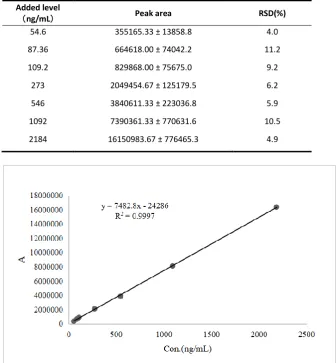
There were good linear regressions of the peak area ratios versus concentrations for BOC26P over the range of 50 to 2000 ng/mL in plasma. The mean back calculated concentrations of BOC26P in the calibration standards, together with accuracy and precision, are shown in Table 2. The precision for all calibrators, including LLOQ, were demonstrated to be less than 11.2%. Regression analysis showed that a weighting factor of 1/X2 fitted for all calibration curves, with
coefficients of determination (R2) in the range of 0.9990 to 0.9997 (Fig.3). The residue of
BOC26P is less than 20% of the LLOQ peak area (37370 ± 2763 < 79562 ± 4193). According to the guidelines, there is no residue in the method for detecting BOC26P.
Table 2. Peak area and RSD of BOC26P for calibration samples (N = 3). Added level
(ng/mL) Peak area RSD(%)
54.6 355165.33 ± 13858.8 4.0
87.36 664618.00 ± 74042.2 11.2
109.2 829868.00 ± 75675.0 9.2
273 2049454.67 ± 125179.5 6.2
546 3840611.33 ± 223036.8 5.9
1092 7390361.33 ± 770631.6 10.5
2184 16150983.67 ± 776465.3 4.9
Fig.3 Standard curve of BOC26P in rat plasma.
PRECISION, ACCURACY, MATRIX EFFECT, RECOVERY AND DILUTION RELIABILITY
Volume 9, Issue 08, 2019
88
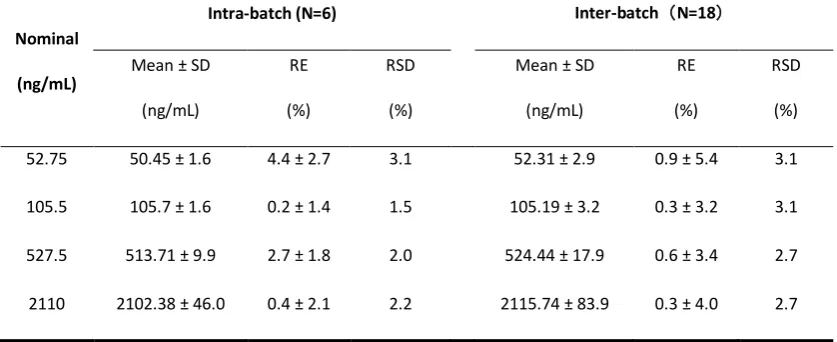
Table 3 Accuracy and Precision of the UPLC-MS/MS method to determine BOC26P in rat plasma.
Nominal
(ng/mL)
Intra-batch (N=6) Inter-batch(N=18)
Mean ± SD
(ng/mL)
RE
(%)
RSD
(%)
Mean ± SD
(ng/mL)
RE
(%)
RSD
(%)
52.75 50.45 ± 1.6 4.4 ± 2.7 3.1 52.31 ± 2.9 0.9 ± 5.4 3.1
105.5 105.7 ± 1.6 0.2 ± 1.4 1.5 105.19 ± 3.2 0.3 ± 3.2 3.1
527.5 513.71 ± 9.9 2.7 ± 1.8 2.0 524.44 ± 17.9 0.6 ± 3.4 2.7
2110 2102.38 ± 46.0 0.4 ± 2.1 2.2 2115.74 ± 83.9 0.3 ± 4.0 2.7
Table 4 Matrix effect and recovery of BOC26P in rat plasma by UPLC-MS/MS.
Matrix effects (N=6) Recovery (N=6)
Nominal (ng/mL) MF (%) CV (%) Extraction recovery (%) RSD (%) 105.5 107.7
1.6 103.6 ± 6.9 6.6
109.5 111.5 107.4 107.7 110.7 2110 102.3
2.0 100.9 ± 3.9 3.9
103.5 100.3 104.3 104.5 103.0 STABILITY
The stability of stock solution, working solution, short-term, post-preparation, freeze-thaw and long-term were showed in Table 5. All the results in the stability study indicated that BOC26P was stable in stock solution and working solution stored at 4 ℃ for 20 days, and was stable in plasma samples kept in the four different conditions since the RE in concentration was ranged from -10% to 12.6%. The IS was stable in stock solution, and IS working solution should be prepared freshly.
Table 5 Stability of determining BOC26P in rat plasma under storage condition by UPLC-MS/MS(N=6).
Stability study Nominal
(ng/mL) Mean ± SD
RE (%)
RSD (%)
Stock solution stability of BOC26P
(4℃, 15 days) 1055000 1037382.5 ± 27123.7 -1.1 ± 2.9 2.7
Stock solution stability of IS
(4℃, 15 days) 1221000 1223637.93 ± 21348.6 7.3 ± 6.5 5.9
Volume 9, Issue 08, 2019
89
(room temperature, 4 hours) 21100 23262.00 ± 20.9 0.3 ± 3.3 1.9
Short-term stability (room temperature,4 hours)
105.5 104.2 ± 1.9 -1.2 ± 2.0 1.8
2110 2212 ± 39.5 4.9 ± 2.1 1.8
Post-preparation stability (room temperature,2 days)
52.75 54.19 ± 1.5 2.7 ± 3.0 2.7
2110 2341 ± 32.0 11.0 ± 1.6 1.4
Freeze-thaw stability (-80°C,3 cycles)
105.5 96.56 ± 1.4 -8.5 ± 1.5 1.5
2110 2116 ± 96.0 0.3 ± 5.0 4.6
Long-term stability (-80°C,20 days)
105.5 103.1 ± 2.4 -2.3 ± 2.5 2.3
2110.0 2206 ± 52.5 1.0 ± 0.1 2.4
PHARMACOKINETIC APPLICATION
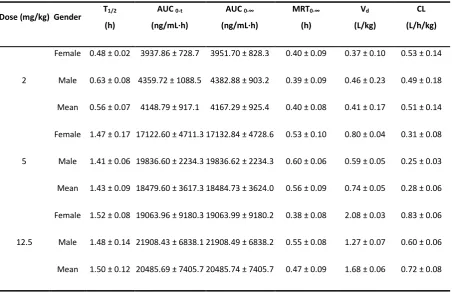
The validated UPLC-MS/MS method was successfully applied to characterize the pharmacokinetics of BOC26P in rats after intravenous administration. Initial four time-point samples were diluted with pooled plasma to bring within quantitation range. The mean plasma concentration-time profiles of BOC26P are shown in Fig.4. The main pharmacokinetic parameters were listed in Table 6, including AUC0 i, AUC0 A, T1/2, Vd, CL and MRT0-V. The main
pharmacokinetic parameters, including T1/2, Vd and MRT0-n, between the male and female
individuals were compared by Stata15 using ANOVA method. There was no significant difference (P>0.05) in pharmacokinetics parameters between male and female individuals, proving that there was no sexual difference in pharmacokinetics of BOC26P in SD rats.
Table 6 Main pharmacokinetic parameters of non-compartmental model analysis of BOC26P in rat plasma with single tail vein administration.
Dose (mg/kg) Gender T1/2
(h)
AUC 0-t
(ng/mL·h)
AUC 0-∞
(ng/mL·h)
MRT0-∞
(h)
Vd
(L/kg)
CL
(L/h/kg)
2
Female 0.48 ± 0.02 3937.86 ± 728.7 3951.70 ± 828.3 0.40 ± 0.09 0.37 ± 0.10 0.53 ± 0.14
Male 0.63 ± 0.08 4359.72 ± 1088.5 4382.88 ± 903.2 0.39 ± 0.09 0.46 ± 0.23 0.49 ± 0.18
Mean 0.56 ± 0.07 4148.79 ± 917.1 4167.29 ± 925.4 0.40 ± 0.08 0.41 ± 0.17 0.51 ± 0.14
5
Female 1.47 ± 0.17 17122.60 ± 4711.3 17132.84 ± 4728.6 0.53 ± 0.10 0.80 ± 0.04 0.31 ± 0.08
Male 1.41 ± 0.06 19836.60 ± 2234.3 19836.62 ± 2234.3 0.60 ± 0.06 0.59 ± 0.05 0.25 ± 0.03
Mean 1.43 ± 0.09 18479.60 ± 3617.3 18484.73 ± 3624.0 0.56 ± 0.09 0.74 ± 0.05 0.28 ± 0.06
12.5
Female 1.52 ± 0.08 19063.96 ± 9180.3 19063.99 ± 9180.2 0.38 ± 0.08 2.08 ± 0.03 0.83 ± 0.06
Male 1.48 ± 0.14 21908.43 ± 6838.1 21908.49 ± 6838.2 0.55 ± 0.08 1.27 ± 0.07 0.60 ± 0.06
Volume 9, Issue 08, 2019
90
Fig.4 Mean plasma concentration-time curves of different doses of BOC26P after intravenous administration to Rats were as follow: blood concentration-time curve at a dose of 2 mg/kg (A), blood concentration-time curve at a dose of 5 mg/kg (B), blood concentration-time curve at a dose of 12.5 mg/kg (C). Each Point Represents the Mean ± SD (N = 6).
CONCLUSIONS
Volume 9, Issue 08, 2019
91
establishment of quantitative analysis methods for other biological samples of BOC26P to support the development of BOC26P as an antitumor candidate compound.
ACKNOWLEDGEMENT
This work was supported by University's Characteristic Innovation Natural Science Project of Guangdong Provincial (No: 2018KTSCX033) and Southern Medical University research start-up plan (No: CX2018N014). We thank Professor Xianzhang Bu (Sun Yat-sen University) for synthesizing BOC26P, and thank Sichuan Greentech Biotechnology Co., Ltd. for providing GLP labs.
REFERENCES
1.Mollay C, Wechselberger C, Mignogna G, et al. Bv8, a small protein from frog skin and its homologue from snake venom induce hyperalgesia in rats. Eur. J. Pharmacol 1999;374(2):189-196.
2.Schweitz H, Bidard J N, Lazdunski M. Purification and pharmacological characterization of peptide toxins from the black mamba (Dendroaspis polylepis) venom. Toxicon. 1990;28(7):847-856.
3.Borisy G G, Olmsted J B, Marcum J M, et al. Microtubule assembly in vitro. Purification of assembly-promoting factors. Eur. J. Biochem. 2010;78(1):167-174.
4.Thorpe, P. E. Vascular Targeting Agents as Cancer Therapeutics. Clin Cancer Res. 2004;10(2):415-427.
5.Liu Z P, Liu Y N, Ji Y T. Tubulin Colchicine Binding Site Inhibitors as Vascular Disrupting Agents in Clinical Developments. Curr Med Chem. 2015, 22(11):1348-60.
6.Lu Y, Jianjun Chen, Min Xiao, et al. An Overview of Tubulin Inhibitors That Interact with the Colchicine Binding Site. Pharm Res. 2012; 29(11):2943-2971.
7.Rustin, G. J S. Phase I Clinical Trial of Weekly Combretastatin A4 Phosphate: Clinical and Pharmacokinetic Results. J. Clin. Oncol. 2003;21(15):2815-2822.
8.Zhu C , Zuo Y , Wang R , et al. Discovery of Potent Cytotoxic Ortho-Aryl Chalcones as New
Scaffold Targeting Tubulin and Mitosis with Affinity-Based Fluorescence. J Med Chem. 2014;57(15):6364.
9.Zhu C , Wang R , Zheng W , et al. Synthesis and evaluation of anticancer activity of BOC26P, an ortho-aryl chalcone sodium phosphate as water-soluble prodrugs, in vitro, and, in vivo. Biomed Pharmacother. 2017;96:551-562.
10.National Pharmacopoeia Commission. Pharmacopoeia of the People's Republic of China [M]. Part 4. Beijing: China Medical Science and Technology Press, 2015: Appendix 363-365. 11.Food and Drug Administration, U.S. Department of Health and Human Services. Guidance for Industry Bioanalytical Method Validation, 2018.
12.European Medicines Agency, Guideline on bioanalytical method validation,2011.
13.Validation of Analytical Procedures: Text and Methodology Q2(R1), International Conference on Harmonization of Technical Requirements for Registration of Pharmaceuticals for Human Use, 2005.
14.Ye W, Chen R, Sun W., et al. Determination and pharmacokinetics of engeletin in rat plasma by ultra-high performance liquid chromatography with tandem mass spectrometry. J Chromatogr B. 2017;1060:144-149.
Article citation: Lina Lin, Lexing Chen, Danyi Lu, Jun Xu, Shaohui Cai.Developing an UPLC-MSMS method to
quantify a novel anticancer chalcone BOC26P for its pharmacokinetic study in vivo.J Pharm Biomed Sci.
2019;09(08):80-92. Available at htp://www.jpbms.info
Volume 9, Issue 08, 2019
92
Disclaimer: Any views expressed in this paper are those of the authors and do not reflect the official policy or position of the Department of Defense.
Source of funding: This work was supported by University's Characteristic Innovation Natural Science Project of Guangdong Provincial (No: 2018KTSCX033) and Southern Medical University research start-up plan (No: CX2018N014). We thank Professor Xianzhang Bu (Sun Yat-sen University) for synthesizing BOC26P, and thank Sichuan Greentech Biotechnology Co., Ltd. for providing GLP labs.
Abbreviations: ANOVA, analysis of variance; AUC, Area under Curve; CE, Collision energy; CL, Intrinsic Clearance; CV, Cone voltage; DSP, Dexamethasone sodium phosphate; ESI, Electrospray ionization; IS, Internal standard;
MRM, Multiple reaction monitoring; MRT0-∞, Mean Residence Time; MS, Mass spectrometry; m/z, Mass-to-charge
ratio; RSD, Relative standard deviation; RE,Relative error; S/N, Signal-Noise Ratio; T1/2, Half-life; UPLC,