Fatema et al. World Journal of Engineering Research and Technology
ESTIMATION OF CO2 EMISSION FROM WIDELY USED BUILDING
MATERIALS AND GREEN CONCRETE ALONG WITH THEIR
COMPARISON
Fatema Tuz Zahura*1, Asif Rahman Khan2, Md. Nazmul Huda Sarker3 and Apu Roy4
1
Assistant Professor, Department of Civil Engineering, Ahsanullah University of Science
and Technology, 141 and 142, Love Road, Tejgaon Industrial Area, Dhaka-1208.
2,3,4
B. Sc. Engg. (Civil), Department of Civil Engineering, Ahsanullah University of
Science and Technology, 141 and 142, Love Road, Tejgaon Industrial Area, Dhaka-1208.
Article Received on 18/10/2017 Article Revised on 09/11/2017 Article Accepted on 30/11/2017
ABSTRACT
Bangladesh is a developing country. The construction sector is
growing rapidly in Bangladesh which ultimately emits a great amount
of greenhouse gases. As the process of manufacturing, transporting of
buildings materials and installing, constructing of buildings consume
greatenergy and emit large quantity of greenhouse gas specially CO2,
so the construction of buildings has a very important impact on the
environment. This paper covers the aspect onhow to choose a material
for green concrete. It presents the feasibility of the usage of
byproductmaterials like fly ash, ground granulated blast furnace slag, recycled concrete or
manufacturing aggregates inconcrete and geopolymer concrete. In our study we used
different empirical equations for the determination of CO2 emissions from widely used
building materials. Then that calculatedCO2emissions was reduced by percentage for various
green concrete materials. The difference between the emission of CO2 from widely used
building materials and green concrete is also discussed. Dhaka, the capital of Bangladesh is
one of the most polluted city, where the building construction site contributes the CO2
emission in a greatamount. If this emission of CO2 cannot be controlled right now, it will
become a threat for theinhabitants of this city. So, the use of green concrete is gradually
becoming anindispensable ingredient for the building materials in this mega city. wjert, 2018, Vol. 4, Issue 1, 01 -20.
World Journal of Engineering Research and Technology
WJERT
www.wjert.org
ISSN 2454-695X
Original Article
SJIF Impact Factor: 4.326
*Corresponding Author
Fatema Tuz Zahura
Fatema et al. World Journal of Engineering Research and Technology
KEYWORDS: Green Concrete (Fly Ash, ground granulated blast furnace slag,
Geopolymer),Greenhouse gas (CO2).
1. INTRODUCTION
The size of construction industry all over the world is growing at faster rate. The huge
construction growth boosts demand for construction materials. On the other hand, aggregates
are the main constituent of concrete. Due to continuously mining the availability of
aggregates has emerged as a problem in recent times. To overcome this problem, there is
need to find replacement to some extent becauseit has been studied that only fromcement
profile, 0.9 tons of CO2 is produced per ton ofcement production.[1] Nowadays, there is a
solution to some extent and the solution is known as “Green Concrete”. Green concrete has
nothing to do with color. It is a concept of thinking environment into concrete considering
every aspect from raw materials manufacture over mixture design to structural design,
construction, and service life.[2] It was first invented in the year 1998 by Dr. WG in
Denmark.[3] In 1997, the Kyoto Conference took place. In that conference several guidelines
were laid down by the participating countries of that conference after discussing the
environmental conditions of that time. The guidelines – Kyoto Protocol, as they are called,
needed the countries to cut down their CO2 emissions to a certain degree as assigned. The
given goal had to be achieved by the year 2012.[4] From then many countries started to focus
on different available options but Denmark targeted on cement and concrete production as
Denmark’s total CO2 emission comes from cement and concrete production near 2%.[4] Green
construction materials are composed of renewable, rather than non-renewable resources.
Green materials are environmentally responsible because impacts are considered over the life
of the product. Recycled materials that the Industry has found to perform favorably as
substitutes for conventional materials include: fly ash, granulated blast furnace slag, recycled
concrete, demolition waste, geopolymer etc.[5] Generation and use of recycled materials
varies from place to place and from time to time depending on the location and construction
activity as well as type of construction projects at a given site. However green concrete is
expected to fulfil some environmental obligations. For example, in accordance with the
Kyoto Protocol of 1997, CO2 emission needs to be reduced by 21 %.[6] Again the use of
inorganic residual products from industries other than the concrete industry needs to be
increased 20% approximately.[7] In our paper we estimate the emission of CO2 from different
types of widely used building materials like cement, brick, steel etc. and green concrete like
Fatema et al. World Journal of Engineering Research and Technology
different elevations. Then we compare the results of CO2 emission from widely used building
materials and green concrete.
2. METHODOLOGY
In order to carry necessary calculations for our study, plan of buildings are chosen. Three
different plans of different storey building namely four storey building, seven storey building
and ten storey building have been chosen. The general consideration that will be followed to
collect different types of data of bricks, cement, sand, steel, glass etc. are given
systematically as types of fuel used for burning (wood, gas, coal) ,amount of the fuel used for
burning, working hour for production and electricity used for production andamount of fuel
required for transportation and sieving. There might be other factors (paint and water uses
etc.) to be considered but we will consider the major factors of carbon emission and energy
consumption. All the building materials are considered to be available locally & the analysis
is mainly focused on Bangladeshi building materials. A table comprising of different data for
various building materials will be prepared in order to carry out the project work smoothly.
Focus should be given on the emission data selection criteria. There are six criteria that have
been applied for the selection of CO2 emission values for individual materials[8] namely
Compliance with approved methodologies, System boundaries, Origin of data, Age of data
sources, Operating CO2 emission& Carbon dioxide emission factors. The emission factors
have been used from unit conversion fact sheet by MIT (2007)[9] and Guidance for Voluntary,
Corporate Greenhouse Gas Reporting: Data by New Zealand (Fuel combustion emission
factors 2008).
2.1.1 Location of the Buildings
The location of building is important as distance is one of the important parameter for
empirical formulas. The distance along with their type of building is given below:
(a) Case I
Storey Number: 4
Number of Floor: 3rd floor with Ground Floor
Type: Officers Dormitory Building
Location: The construction Site is near Aftab Nagar, Dhaka
Area of Building: Length = 17.25 m; Width = 8 m
Fatema et al. World Journal of Engineering Research and Technology
(b)Case II
Storey Number: 7
Number of Floor: 6th floor with Ground floor
Type: Residential Building
Location: The construction Site is near Banasree, Dhaka
Area of Building: Length = 129 ft; Width = 77 ft
Per Floor Height: 10 ft
(c) Case III
Storey Number: 10
Number of Floor: 9th floor with Ground floor
Type: Residential Building
Location: The construction Site is near Badda, Dhaka
Area of Building: Length = 129 ft; Width = 77 ft
Per Floor Height: 10 ft
2.1.2 Building Materials Location (a) Brick:
Company Name: Abdul Monem Auto Bricks ltd
Location: Gazaria, Munshijanj
(b) Cement:
Company Name: Shah Cement
Location: Muktarpur, Munshiganj.
(c). Steel:
Company Name: Abulkhair Steel
Location: West Muktarpur, Munshiganj
(d). Sand:
Location: Sunamganj district
(e). Timber:
Location: Sundarban of Bangladesh.
2.2 Calculation Procedure
Fatema et al. World Journal of Engineering Research and Technology
2.2.1 Estimation of different widely used building materials
At first the main focus will be given on the estimation of different building materials. The
commonly known widely used building materials that will be estimated in our calculation are
Cement, Aggregate, Sand, Brick, Steel, Timber & Concrete. The total amount of building
materials used during the construction will be determined separately for respective widely
used building materials.
2.2.2 Determination of CO2 emissions from widely used building materials:
In this phase our prime goal is to determine the emission of CO2from different widely used
building materials.
The formulae that will be used in determining the emission of CO2 are given below. These
empirical equations were developed by S. Khusru& M. A. Noor for any location of
Bangladesh.
(i) Brick Profile
Cradle to grave emission=380.25+0.21(db1 +db2) (g CO2 /single brick)[8] …………. (1)
Where
db1 = distance in km from brick field to construction site;
db2 = distance in km from construction site to brick chips processing site.
(ii) Cement Profile
Cradle to Gate Emission
CEM- I = 870 + 50 dc (kg CO2/ton)[8] ………(2)
(2) Where dc = total distance in km from cement factory to market and market to
construction site.
(iii) Steel Profile
Total life cycle emission (max) =800+ 0.05 (dst1 +dst2) +8.1h +1.03L + 0.04A (Kg CO2
/ton)[8]………(3)
Where
dst2 =distance in km from market to construction site;
Fatema et al. World Journal of Engineering Research and Technology
h=hoisting height of the crane in meter for one ton of steel element transfer;
L=derricking length of the crane in meter for one ton of steel element transfer.
(iv) Sand Profile
Cradle to gate emission =0.05 +50 dst1 (g CO2/kg)[8] ……… (4)
Where dst1 =total distance in km from sand processing unit to market and from market to
construction site.
(v) Aggregate Profile
Life Cycle CO2 Emission: 65+ 50 (da + dad), (g CO2/kg)[8]………..(5)
Where, da = total distance in km from processing unit to market and from market to
construction site;
dad = distance in km from construction site to disposal site.
(v) Timber Profile
Cradle to grave emission =0.12t/v +3.45 +0.05 (dt1+dt2) (kg CO2/ cft)[8]………. (6)
Where,
t = no of trees cut;
dt1=distance in km from wood to saw mill;
dt2=distance in km from sawmill to construction site;
V=volume of timber cut in cubic feet.
2.2.3 Minimization of CO2 emissions by using Green Concrete
In this phase, the focus will be given on the minimization of the emissions of CO2 by using
the alternatives of traditional ingredients of building materials. It would be better to state
earlier that all traditional building materials cannot be exchanged or alternated totally due to
maintain the code for the construction of buildings. However by reducing some traditional
ingredients of building materials and replacing them with the alternatives of traditional
Fatema et al. World Journal of Engineering Research and Technology
The way to minimize the emissions of CO2 by means of Green Concrete is discussed below:
(i)Ground Granulated Blast Furnace Slag (GGBFS): 55% of GGBS can reduce the embodied
the CO2 content of a typical C12/40 concrete from approximate 115 kg CO2/ton to
approximate 60 kg CO2 /ton.[10]
(ii) Pulverized Fly Ash (PFA):30% of Fly Ash can reduce the embodied the CO2 content of a
typical C12/40 concrete from approximate 115 kg CO2 /ton to approximate 85 kg CO2
/ton.[10]
(iii) Manufacturing of Aggregates:The fine and coarse aggregates are assumed to be locally
quarried basalt and river sand. The emission of CO2 can be minimized by multiplying the
determined total amount of emitted CO2 gas from the buildings with the factors of emissions.
The factors of emission is given below:
Table 1: Factor of emissions.[11]
Activity Emission factor Unit
Concrete batching 0.0033 kg CO2-e/m3
Concrete transport 0.0094 kg CO2-e/m3
On site placement activities 0.009 kg CO2-e/m3
(iv) Geopolymer: As substitute materials of OPC, 19–29% reductions in CO2-e are feasible
in geopolymer concrete.[11,12]
3. CALCULATION
3.1 Estimation of widely used building materials
Six building materials namely brick, cement, sand, aggregate, steel and timber has been
estimated as they contribute in the emission of CO2 to the environment. Table-2 shows the
summation of these six widely used building materials from three storey, seven storey and ten
storey building respectively.
Table 2: Quantity of estimated building materials.
Ingredients Case No
I II III
Brick (Nos) 42371 694941 1011813
Cement (Bag) 2311 13247 16496
Sand (cft.) 6600.5 33000 42212
Aggregate (cft.) 6518 50847 63266
Steel (kg) 27087.85 174060 219892
Fatema et al. World Journal of Engineering Research and Technology
3.2 Determination of CO2 emissions from widely used building materials
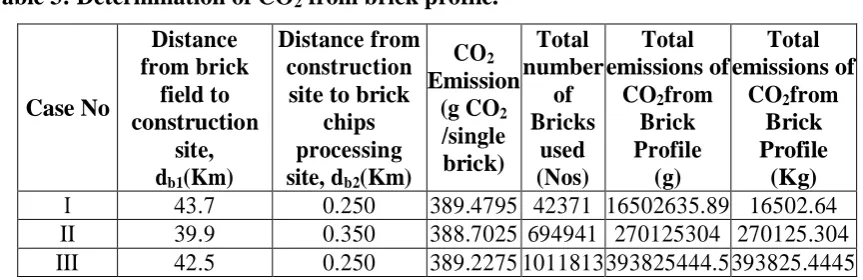
3.2.1 Brick Profile
The amount of CO2 that was emitted during the construction of building is formulated in
Table 3.
Equation-1was used to determine the emission of CO2.
Table 3: Determination of CO2 from brick profile.
Case No Distance from brick field to construction site, db1(Km)
Distance from construction site to brick
chips processing site, db2(Km)
CO2
Emission (g CO2
/single brick) Total number of Bricks used (Nos) Total emissions of
CO2from
Brick Profile
(g)
Total emissions of
CO2from
Brick Profile
(Kg)
I 43.7 0.250 389.4795 42371 16502635.89 16502.64
II 39.9 0.350 388.7025 694941 270125304 270125.304
III 42.5 0.250 389.2275 1011813 393825444.5 393825.4445
3.2.2 Cement Profile
Equation-2 was used to determine the emission of CO2 which is represented in Table 4.
Table 4: Determination of CO2 from cement profile.
Case No
Total distance from cement factory to market and market to construction site, dc(Km)
CO2
Emission (kg CO2/ton)
Total cement used (Bags) Total cement used (cft) Total cement used (Ton) Total emissions of CO2from
Cement Profile(Kg)
I 35.2 2630 2311 2888.75 123.19 323989.7
II 29.1 2325 13247 16558.75 706.13 1641752.40
III 34.5 2595 16496 20620 879.32 2281829.42
3.2.3 Steel Profile
Equation-3 was used to determine the emission of CO2 which is represented in Table 5.
Table 5: Determination of CO2 from steel profile.
Case No. Distance from rerolling mills to market, dst1 (Km) Distance in km from market to construction
site, dst2
(Km)
Hoisting height of the Crane for one
ton of steel element transfer, h (m)
Derricking length of the crane for one ton of steel
element transfer, L (m)
CO2
Emission (kg CO2/ton)
Total steel used (Ton) Total emissions of CO2from
Steel Profile (Kg)
I 34.6 0.400 6.096 7.62 858.9762 27.08785 23267.82
II 28.5 0.500 6.096 7.62 858.6762 174.060 149461.18
Fatema et al. World Journal of Engineering Research and Technology
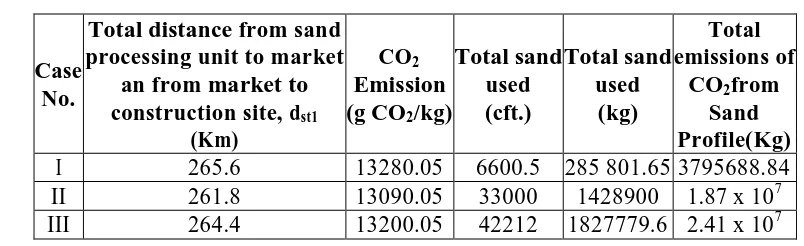
3.2.4 Sand Profile
Equation 4 was used to determine the emission of CO2 which is represented in Table 6.
Table 6: Determination of CO2 from sand profile.
Case No.
Total distance from sand processing unit to market
an from market to construction site, dst1
(Km)
CO2
Emission (g CO2/kg)
Total sand used (cft.) Total sand used (kg) Total emissions of
CO2from
Sand Profile(Kg)
I 265.6 13280.05 6600.5 285 801.65 3795688.84
II 261.8 13090.05 33000 1428900 1.87 x 10⁷
III 264.4 13200.05 42212 1827779.6 2.41 x 10⁷
3.2.5 Aggregate Profile
Equation 5 was used to determine the emission of CO2 which is represented in Table 7.
Table 7: Determination of CO2 from aggregate profile.
Case No.
Total distance from processing
unit to market and from market
to construction site, da (Km)
Distance in km from construction
site to disposal site, dad(Km)
CO2
Emission (g CO2/kg)
Total aggregate used (cft) Total aggregate used (Kg) Total emissions of
CO2from
Aggregate Profile(Kg)
I 20.2 3.4 1245 6518 299176.2 37247.37
II 22.2 2.8 1315 50847 2333877.3 3069048.650
III 23.4 3.2 1395 63266 2903909.4 4050953.613
3.2.6 Timber Profile
Equation-6 was used to determine the emission of CO2 which is represented in Table 8.
Table 8: Determination of CO2 from timber profile.
Case No.
Distance From wood to saw mill,
dt1(Km)
Distance From sawmill to construction
site, dt2(Km)
No of trees cut, t Volume of timber, v (cft) CO2 Emission (kg CO2/
cft)
Total timber used (cft)
Total emissions of CO2from
Timber Profile (Kg)
I 282 15 21 9450 18.30 9170.63 167822.53
II 282 21 100 45000 18.60 44070.45 819710.37
III 282 25 150 67500 18.80 66189.46 1244379.50
Fatema et al. World Journal of Engineering Research and Technology
Table 9: Total emission of CO2 from widely used building materials.
Building Materials Case No
I II III
Brick (Kg) 16502.64 270125.304 393825.4445
Cement (Kg) 323989.7 1641752.40 2281829.42
Steel (Kg) 23267.82 149461.18 188876.50
Sand (Kg) 3795688.84 1.87 x 10⁷ 2.41 x 10⁷
Aggregate (Kg) 37247.37 3069048.650 4050953.613
Timber (Kg) 167822.53 819710.37 1244379.50
Total (Kg) 4.36 x 10⁶ 2.47 x 10⁷ 3.23 x 10⁷
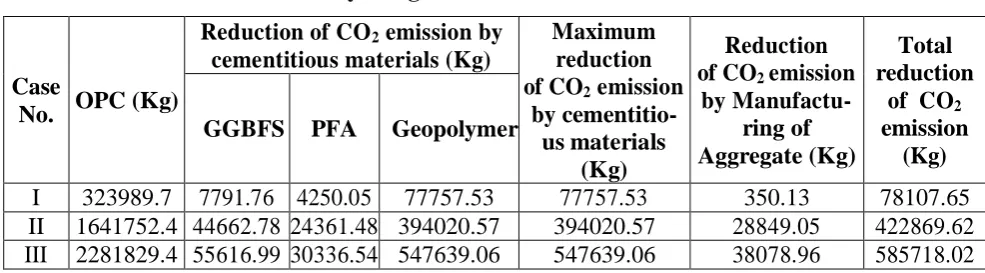
3.3 Minimization of CO2 emissions by using Green Concrete
It is true that we cannot replace every materials of ordinary building materials like
Reinforcement, Sand etc. as they are the indispensable ingredients of building materials. But
it is possible to replace a little portion of some building materials like cement, aggregate etc.
which will help to minimize the emission of CO2 in a great extent.
If ordinary Portland cement is replaced by 55%Ground Granulated Blast Furnace Slag
(GGBFS), it can reduce the embodied CO2 content from approximate 115 kg CO2 /ton to
approximate 60 kg CO2 /ton. 30% of Fly Ash can also reduce the embodied CO2 content from
approximate 115 kg CO2 /ton to approximate 85 kg CO2 /ton.[9] On the other hand as a
substitute material of OPC, 19%–29% reductions in CO2 emissions are feasible in
geopolymer concrete. However, we will consider the maximum reduction for both GGBFS
and PFA and average reduction for geopolymer. In case of manufacturing aggregates, we will
multiplied the total amount with the provided emission factor. Table 10 shows the amount of
reduction of CO2 emission due to the use of green concrete.
Table 10: Reduction of CO2 by using Green Concrete.
Case
No. OPC (Kg)
Reduction of CO2 emission by
cementitious materials (Kg)
Maximum reduction of CO2 emission
by cementitio- us materials
(Kg)
Reduction of CO2 emission
by Manufactu- ring of Aggregate (Kg)
Total reduction
of CO2
emission (Kg) GGBFS PFA Geopolymer
I 323989.7 7791.76 4250.05 77757.53 77757.53 350.13 78107.65
II 1641752.4 44662.78 24361.48 394020.57 394020.57 28849.05 422869.62
III 2281829.4 55616.99 30336.54 547639.06 547639.06 38078.96 585718.02
In the above table, it is seen that in case of cementitious materials, geopolymer as a substitute
material of OPC, reduces the highest amount of CO2 among all other substitute materials.
Fatema et al. World Journal of Engineering Research and Technology
material. Table 11 shows the total emission of CO2 after the minimization of CO2 emission
by using green concrete.
Table 11: Total emission of CO2 after using green concrete.
Case No.
CO2 emission from
Widely used building materials (Kg)
Minimized CO2
emission
CO2 emission after using
Green Concrete (Kg)
I 4.30 x 10⁶ 78107.658 4.23 x 10⁶
II 2.47 x 10⁷ 422869.626 2.43 x 10⁷
III 3.23 x 10⁷ 585718.021 3.17 x 10⁷
4. RESULT AND DISCUSSION
4.1 Comparison of the emission of CO2 among various building materials
In our study we have mainly focused on the emission of CO2 from widely used building
materials from cradle to grave condition that means during the whole period of construction
of a building. It is found that in all cases the emission of CO2 is greater from sand than other
building materials of building like cement, steel, aggregate, timber and brick. It is because in
our calculation the formulas that have been used in order to determine the emission of CO2
are based on the distance of different building materials from production site to construction
site as well as different constant coefficient. Tough the distance of timber source found for
our calculation is maximum, but CO2 is emitted quite less from timber while sand emits
maximum CO2. It is because the distance of sand source and timber source is almost equal
but the coefficients of sand are higher than timber. Hence, sand plays the vital role in the
emission of CO2 to the environment from the construction sector of building in our
calculation. The other building materials can also play the important role of the emission of
CO2 depending on their distances from production sector to construction sector along with
their term of higher constant coefficient.
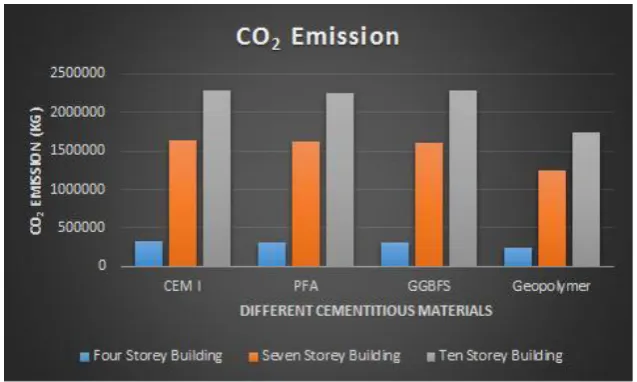
4.2 Comparison of the emission of CO2 for various cementitious materials
After determining the emission of CO2from widely used building materials we substitute the
widely used building materials with the less used building materials and calculate the
reduction of emission of CO2by the less used building materials like ground granulated blast
furnace slag (GGBFS), pulverized fly ash (PFA), geopolymer etc. Figure 1 shows the
emission of CO2 from different binding materials namely ordinary Portland cement,
pulverized fly ash, ground granulated blast furnace slag and geopolymer of three separated
Fatema et al. World Journal of Engineering Research and Technology
PFA is used as a substitute of OPC, it reduces a small quantity of CO2 emission. GGBFS can
reduce the CO2 emission more than PFA. But Geoploymerreduces the greatest amount as
substitute materials of cement.
Fig 1: CO2 emission from different cementitious materials.
4.3 Drawbacks of less used cementitious materials
However, the substitute cementitious materials have the advantage over OPC that they can
reduce the CO2 emission but they have some major drawbacks. The drawbacks are: Sources
of substitute materials are not readily available in Bangladesh. So, Current specification
doesn’t cater to adopt the use of blast furnace slag as a substitute. The Geopolymer concrete
(GPC) needs higher temperature curing. Ambient temperature cured GPC has quite lower
strength and durability. The properties of GPC are highly depends on the casting curing
condition (it is very sensitive to the moisture, temperature, pressure etc.). Also efflorescence
is also a big problem for GPC. The quality of fly ash can affect the quality and strength of
Cement concrete.Poor quality fly ash can increase the permeability of the concrete and cause
damage to the building.
4.4 Comparison of the emission of CO2between widely used building materials and less
used building material (Green Concrete)
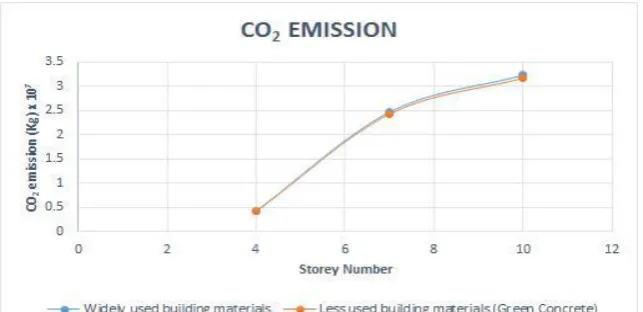
Now, if we look onto the overall emission of CO2for both widely used building materials and
less used building materials it can be said that green concrete technology reduce the emission
of CO2in a great extent. Figure 2 shows the overall CO2 emission from different storey
Fatema et al. World Journal of Engineering Research and Technology
Fig 2: Overall CO2 emission from different storey building.
From the above figures it is found that the emission of CO2 from green concrete is quite less
than the widely used building materials. So, it is better to start the use of green concrete
extensively as a substitute material of widely used building materials in order to prevent
environment from the grabs of pollution by building construction sector.
4.5 Graphical representation of the emission of CO2
Finally figure 3 represents the behavior of the emission of CO2. That means how they are
emitted to the environment. From figure 3, the curve that is obtained is non-linear. It is due to
the different locations of buildings that have been selected in our calculation. Because the
parameter that controls the emission of CO2 from building construction depends on the
distance of the building ingredients from it’s the production zone to building construction
zone. So, if the three buildings are placed at the same place, the curve will be linear only
then. Except this, the curve will be always non-linear if the locations differ from each other.
It is also observed from the behavior of the curve that green concrete minimizes the
emissions of CO2 and as it reduces a fixed amount of percentage from the total emissions of
CO2 from the widely used building materials, so the curve of green concrete will always
depend on the behavior of the curve of widely used building materials that means if the curve
of widely used building materials is linear, the curve of green concrete will also be
Fatema et al. World Journal of Engineering Research and Technology
Fig 3: Graphical representation of the emission of CO2.
Appendix A Case I
Storey Number: 4
Type: Officers Dormitory Building
Location: The construction Site is near Aftab Nagar, Dhaka
Area of Building: Length = 17.25 m; Width = 8 m
Per Floor Height: 3.20 m
Table A1: Footing Dimension.
Name Dimension Name Dimension
F1 2.70 m X 2.70 m F4 1.70 m X 3.275 m
F2 2.50 m X 2.50 m F5 2.20 m X 4.025 m
F3 1.80 m X 1.80m F6 2.20 m X 3.975 m
Table A2: Grade Beam Dimension.
Name Dimension
GB1 0.25 m X 0.30 m
GB2 0.25 m X 0.30 m
Table A3: Column (Ground Floor to Roof Floor).
Name Dimension
C1 0.25 m X 0.25 m
C2 0.25 m X 0.25 m
Table A4: Beam (Ground Floor Beam to Roof Floor Beam & Stair Beam).
Name Dimension Name Dimension
FB1 0.30 m X 0.25 m FB4 0.30 m X 0.25 m
FB2 0.30 m X 0.25 m SB 0.30 m X 0.25 m
Fatema et al. World Journal of Engineering Research and Technology
Slab: (Ground Floor to Roof Floor)
Area = 173.688 m2
Thickness = 0.115 m
Stair: (Ground Floor)
Initial Landing: Length = 2.68 m; Width = 1.33 m; Height = 0.12 m
Step: Length = 1.34 m; Width = 0.25 m; Height = 0.15 m
Stair: (1st Floor to 3rd Floor)
Landing: Length = 2.68 m; Width = 1.33 m; Height = 0.12 m
Initial Landing: Length = 2.68 m; Width = 1.33 m; Height = 0.12 m
Step: Length = 1.34 m; Width = 0.25 m; Height = 0.15 m
Stair: (Roof Floor)
Landing: Length = 2.68 m; Width = 1.33 m; Height = 0.12 m
Appendix B Case II
Storey Number: 7
Type: Residential Building
Location: The construction Site is near Banasree, Dhaka
Area of Building: Length = 129 ft; Width = 77 ft
Per Floor Height: 10 ft
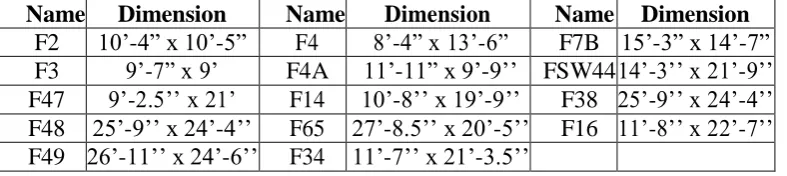
Table B1: Footing Dimension.
Name Dimension Name Dimension Name Dimension
F2 10’-4” x 10’-5” F4 8’-4” x 13’-6” F7B 15’-3” x 14’-7”
F3 9’-7” x 9’ F4A 11’-11” x 9’-9’’ FSW44 14’-3’’ x 21’-9’’
F47 9’-2.5’’ x 21’ F14 10’-8’’ x 19’-9’’ F38 25’-9’’ x 24’-4’’
F48 25’-9’’ x 24’-4’’ F65 27’-8.5’’ x 20’-5’’ F16 11’-8’’ x 22’-7’’
Fatema et al. World Journal of Engineering Research and Technology
Table B2: Column (Ground Floor to 6th Floor) Dimension.
Name Dimension Name Dimension
C1 - C2 20”x15” (G.F - 6th) C3 - C4 25”x12” (G.F - 6th)
C5 30”x12” (G.F - 5
th
)
& 25”x12” (6th
) C5A
25”x15” (G.F - 5th
) &
20”x15” (6th
)
C6
35”x12” (G.F - 3rd
)
& 30”x12” (4th
- 5th)
&25”x12” (6th
)
C7A
30”x15” (G.F - 5th
) &
25”x15” (6th
)
C7B & 25”x15” (125”x18” (G.F) st
- 6th) C8
35”x12” (G.F - 5th
)
& 30”x12” (6th
)
C9 35”x12” (G.F - 5
th
)
& 30”x12” (6th
) C9A
35”x15” (G.F - 3rd
)
& 30”x15” (4th
- 6th)
Table B3: Grade Beam Dimension.
Name Dimension Name Dimension
GB1- GB7 12” X 18” GB9 – GB12 12” X 18”
GB8 10” X 18” GB13 – GB14 10” X 18”
GB15 - GB18 12” X 18”
Table B4: Beam (Ground Floor Beam) Dimension.
Name Dimension Name Dimension
B1 – B11 21 in B17 10 in X 21 in
B12 21 in B18 12 in X 21 in
B13 – B16 21 in B19 – B23 10 in X 21 in
Table B5: Beam (1st Floor Beam to 6th Floor Beam).
Name Dimension Name Dimension
B24 – B38 21 in B48 10 in X 24 in
B39 24 in B49 10 in X 21 in
B40 – B47 21 in B50 10 in X 24 in
B51 – B54 21 in
Slab: (1st Floor to 6th Floor)
Length = 112.17 ft; Width = 47 ft; Thickness = 5.5 in
Stair: (Ground Floor)
Initial Landing: Length = 9 ft; Width = 5 ft; Height = 5 in
Step: Length = 5 ft; Width = 10 in; Height = 6 in
Stair: (1st Floor to 6th Floor)
Landing: Length = 9 ft; Width = 5 ft; Height = 5 in
Initial Landing: Length = 9 ft; Width = 5 ft; Height = 5 in
Fatema et al. World Journal of Engineering Research and Technology
Stair: (Roof Floor)
Landing: Length = 9 ft; Width = 5 ft; Height = 5 in
Table B6: Shear Wall Dimension.
Name Dimension
SW1Below Ground Level 12 in X 87 in
SW1 Ground Floor to above 10 in X 85 in
SW3Below Ground Level 19 in X 57 in
SW3 Ground Floor to above 12 in X 50 in
SW4Below Ground Level 12 in X 57 in
SW4 Ground Floor to 6th 10 in X 55 in
SW4 7th Floor 10 in X 30 in
SW2Below Ground Level 7 ft 11 in X 12 ft 6 in
SW2 Ground Floor to above 7 ft 8 in X 12 ft 6 in
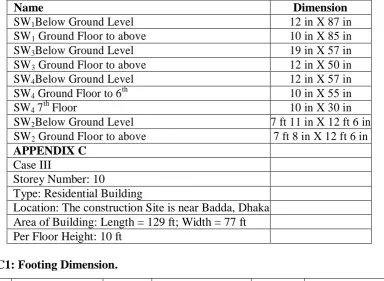
APPENDIX C
Case III
Storey Number: 10
Type: Residential Building
Location: The construction Site is near Badda, Dhaka Area of Building: Length = 129 ft; Width = 77 ft Per Floor Height: 10 ft
Table C1: Footing Dimension.
Name Dimension Name Dimension Name Dimension
F2 10’-4” x 10’-5” F4 8’-4” x 13’-6” F7B 15’-3” x 14’-7”
F3 9’-7” x 9’ F4A 11’-11” x 9’-9’’ FSW44 14’-3’’ x 21’-9’’
F47 9’-2.5’’ x 21’ F14 10’-8’’ x 19’-9’’ F38 25’-9’’ x 24’-4’’
F48 25’-9’’ x 24’-4’’ F65 27’-8.5’’ x 20’-5’’ F16 11’-8’’ x 22’-7’’
F49 26’-11’’ x 24’-6’’ F34 11’-7’’ x 21’-3.5’’
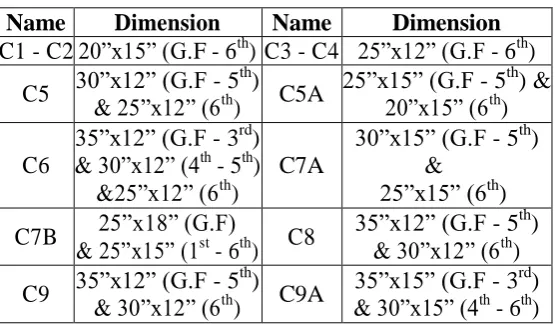
Table C2: Column (Ground Floor to 9th Floor) Dimension.
Name Dimension Name Dimension
C1 - C2 20”x15” (G.F - 9th) C3 - C4 25”x12” (G.F - 9th)
C5 30”x12” (G.F - 5
th
)
& 25”x12” (6th
– 9th) C5A
25”x15” (G.F - 5th
)
& 20”x15” (6th
– 9th)
C6
35”x12” (G.F - 3rd
)
& 30”x12” (4th
- 5th)
&25”x12” (6th
– 9th)
C7A 30”x15” (G.F - 5
th
)
& 25”x15” (6th
– 9th)
C7B 25”x18” (G.F)
& 25”x15” (1st
- 9th) C8
35”x12” (G.F - 5th
)
& 30”x12” (6th
– 9th)
C9 35”x12” (G.F - 5
th
)
& 30”x12” (6th
– 9th) C9A
35” x 15” (G.F - 3rd
)
& 30”x15” (4th
Fatema et al. World Journal of Engineering Research and Technology
Table C3: Grade Beam Dimension.
Name Dimension Name Dimension
GB1- GB7 12” X 18” GB9 – GB12 12” X 18”
GB8 10” X 18” GB13 – GB14 10” X 18”
GB15 - GB18 12” X 18”
Table C4: Beam (Ground Floor Beam) Dimension.
Name Dimension Name Dimension
B1 – B11 10 in X 21 in B17 10 in X 21 in
B12 12 in X 21 in B18 12 in X 21 in
B13 – B16 10 in X 21 in B19 – B23 10 in X 21 in
Table C5: Beam (1st Floor Beam to 9th Floor Beam) Dimension.
Name Dimension Name Dimension
B24 – B38 10 in X 21 in B48 10 in X 24 in
B39 10 in X 24 in B49 10 in X 21 in
B40 – B47 10 in X 21 in B50 10 in X 24 in
B51 – B54 10 in X 21 in
Slab: (1st Floor to 9th Floor)
Length = 112.17 ft; Width = 47 ft; Thickness = 5.5 in
Stair: (Ground Floor): Initial Landing: Length = 9 ft; Width = 5 ft; Height = 5 in
Step: Length = 5 ft; Width = 10 in; Height = 6 in
Stair: (1st Floor to 9th Floor): Landing: Length = 9 ft; Width = 5 ft; Height = 5 in
Initial Landing: Length = 9 ft; Width = 5 ft; Height = 5 in
Step: Length = 5 ft; Width = 10 in; Height = 6 in
Stair: (Roof Floor): Landing: Length = 9 ft; Width = 5 ft; Height = 5 in
Shear Wall
Name Dimension
SW1Below Ground Level 12 in X 87 in
SW1 Ground Floor to above 10 in X 85 in
SW3Below Ground Level 19 in X 57 in
SW3 Ground Floor to above 12 in X 50 in
SW4Below Ground Level 12 in X 57 in
SW4 Ground Floor to 8th 10 in X 55 in
SW4 9th Floor 10 in X 30 in
SW2Below Ground Level 7 ft 11 in X 12 ft 6 in
Fatema et al. World Journal of Engineering Research and Technology
5. CONCLUSION
Global warming is one of the major threats to the environment till date. Production of
concrete is one of the vital factors for global warming as it accounts for 30% of the total CO2
released in the atmosphere.[11] This can be minimized by eco-friendly substitute known as
green concrete. In this post we have discussed about all the raw materials for the substitute of
conventional concrete to go green. The Green Concrete is a recycled and light weight
substances obtained from demolished site and waste of industries. The other one is green
cement like fly ash, silica fume and high reactivity met kaolin (HRM). The widely used is fly
ash. These green materials have almost same mechanical properties and fire resistant factor as
conventional concrete. It has better thermodynamic, environmental and durability properties.
It is also cost effective and the construction is faster. Use of concrete product like green
concrete in future will not only reduce the emission of CO2 in environment and
environmental impact but it is also economical to produce. It is true that Dhaka is one of the
most pollutant city in the world. And the emission of CO2 play the vital role to pollute this
city. Our study shows that building sector is also responsible to emit a large number of CO2
to the environment. If this emission rate can be reduced in a handsome amount, it will be
helpful to save this city, Dhaka from being polluted. However, we try to show a comparison
of the emission of CO2 between the widely used building ingredients and some other alternate
building materials of it. It is found that the alternate materials can reduce a little portion of the
emission of CO2 from the total amount. But this reduction amount can be increased if some
steps would be taken in course of different time. As the emission of CO2 is dependent on the
distance of the building materials from cradle to grave of a building construction, so if the
distance is reduced then the total emission can be automatically reduced. For example, in our
study it is proved that sand emits the most emission of CO2 and it is because the distance of
sand is comparatively more than other building materials. So, if this sand can be collected
from the nearby of the construction site, the emission will be not as more as our study. So, it
becomes inevitable to keep the distance short in order to reduce the total emission of CO2
from building sector. And if proper substitute materials can be introduced, the emission also
can be reduced in a great amount.
REFERENCES
1. https://www.researchgate.net/publication/266912818_GREEN_CONCRETE_EFFICIEN
T_ECO-FRIENDLY_CONSTRUCTION_MATERIALS.
Fatema et al. World Journal of Engineering Research and Technology
3. https://theconstructor.org/concrete/green-concrete/5566/.
4. Ananth Kamath K & Mohammad Suhail Khan, Green Concrete, Imperial Journal of
Interdisciplinary Research (IJIR), 2017; 3(1): Page 685.
5. http://www.yashkrishi.com/GreenConcrete.asp.
6. http://www.kyotoprotocol.com.
7. http://citeseerx.ist.psu.edu/viewdoc/download?doi=10.1.1.518.5475&rep=rep1&type=pdf.
8. Noor, Amin, Bhuiyan, Chowdhury and Kakoli 4th Annual Paper Meet & 1st Civil
Engineering Congress, December 22-24, 2011, Dhaka, Bangladesh (eds).
9. (http://web.mit.edu/mit_energy).
10.https://www.devb.gov.hk/filemanager/en/content_680/6_mr_stephen_leung_carbon_di
oxide_emissions_of_concrete.pdf.
11.Collins F. Inclusion of carbonation during the life cycle of built and recycled concrete:
influence on their carbon footprint. Int J Life Cycle Assess, 2010; 15(6): 549–56.
12.Flower DJM, Sanjayan JG. Greenhouse gas emissions due to concrete manufacture. Int J
![Table 1: Factor of emissions.[11]](https://thumb-us.123doks.com/thumbv2/123dok_us/8359804.1670676/7.595.144.460.361.421/table-factor-of-emissions.webp)