T E C H N I C A L A D V A N C E
Open Access
The segmentation of bones in pelvic CT
images based on extraction of key frames
Hui Yu
1, Haijun Wang
1*, Yao Shi
1, Ke Xu
2, Xuyao Yu
3and Yuzhen Cao
1Abstract
Background:Bone segmentation is important in computed tomography (CT) imaging of the pelvis, which assists
physicians in the early diagnosis of pelvic injury, in planning operations, and in evaluating the effects of surgical treatment. This study developed a new algorithm for the accurate, fast, and efficient segmentation of the pelvis.
Methods:The proposed method consists of two main parts: the extraction of key frames and the segmentation
of pelvic CT images. Key frames were extracted based on pixel difference, mutual information and normalized correlation coefficient. In the pelvis segmentation phase, skeleton extraction from CT images and a marker-based watershed algorithm were combined to segment the pelvis. To meet the requirements of clinical application,
physician’s judgment is needed. Therefore the proposed methodology is semi-automated.
Results:In this paper, 5 sets of CT data were used to test the overlapping area, and 15 CT images were used to
determine the average deviation distance. The average overlapping area of the 5 sets was greater than 94%, and the minimum average deviation distance was approximately 0.58 pixels. In addition, the key frame extraction efficiency and the running time of the proposed method were evaluated on 20 sets of CT data. For each set, approximately 13% of the images were selected as key frames, and the average processing time was approximately 2 min (the time for manual marking was not included).
Conclusions:The proposed method is able to achieve accurate, fast, and efficient segmentation of pelvic CT image
sequences. Segmentation results not only provide an important reference for early diagnosis and decisions regarding surgical procedures, they also offer more accurate data for medical image registration, recognition and 3D reconstruction.
Keywords:CT segmentation, Pelvis, Key frame extraction, Skeleton, Marker-based watershed algorithm
Background
Recently, traffic accidents, falls and other serious high-energy trauma have often led to pelvic fractures. Researches show that the incidence of heavy-vehicle in-jury has increased over the years [1] and patients with pelvic fractures who present in shock have a mortality of 30–50% [2]. Pelvic fracture is the third most common cause of death in traffic trauma [3]. Rapid and accurate diagnosis and treatment are not only important to re-duce the mortality caused by pelvic fractures, but also helpful for the functional reconstruction and correction of deformities of the pelvis. Medical imaging and pro-cessing are crucial in the process of diagnosis and
treatment. The computed tomography (CT) images and 3D reconstruction by CT are commonly used to display the anatomical structure of pelvis and characteristics of the lesions [4]. Analysis based on CT images is import-ant for the description of pelvic anatomy, the planning of surgical procedures and the evaluation of the post-operative effects [5]. And the most important step of analysis is bone segmentation, which is crucial to quanti-tatively evaluate the degree of fracture, detect the location of bleeding, and judge the condition of injury [6]. Therefore, the accuracy of segmentation will affect the doctor’s judgment of the disease, the selection of the best surgical approach, etc.
At present, the pelvic region is manually marked for sur-gical procedures in the clinic. This process is time-consuming and error prone [7]. Therefore, it is necessary * Correspondence:[email protected]
1Department of Biomedical Engineering, Tianjin University, Tianjin, China Full list of author information is available at the end of the article
to propose a fast, accurate, and efficient method for pelvic segmentation.
Image segmentation is a hot topic in medical image processing. Recently, various segmentation methods have been proposed [8], some of which are based on thresholding [9–12]. The central idea of threshold seg-mentation is to transform the segseg-mentation problem into pixel classification problem. Considering the fact that bone mineral density is heterogeneous, the connec-tion between the femoral head and acetabulum is narrow, and a weak edge can be caused by disease, it is difficult to select a universal threshold. Other methods are based on the region growing technique, in which pixels with similar properties are set up as a region [13–15]. However, this method requires a long time and a large amount of space. In recent years, classifi-cation and clustering have also been used for medical image segmentation, and the relevant research focuses on the improvement of robustness [16–18]. Methods based on deformable models [19–25] and active shape models [26–30] have become a hot topic. For example, Calder et al. [20]proposed a segmentation method based on level set. Truc et al. [21] included density distance en-hancement in a C-V model, and Martinez et al. [22] ap-plied multi-scale edge detection to adjust a geometric model. Wu et al. [26] combined the active shape model with template matching, and Li et al. [27] combined the active shape model with a clustering model. However, most segmentation algorithms put more attention to the characteristics of a single CT image, so that the characteristics of CT sequences are usually ignored. Although there are many existing algorithms for medical image segmentation, an effective and accurate algorithm for the segmentation of pelvic CT image sequences has not been proposed. To assist doctors in diagnosis and treatment, an accurate segmenta-tion of pelvic structure is essential. However, con-sidering factors such as individual differences among different patients, bone mineral density un-evenness, and narrowing of the hip joint space, it is difficult to rely only on gray scale information for accurate segmentation.
This paper proposes a novel segmentation method based on CT images of the pelvis. In the sequence of CT slices, because of the small shooting distance, the morphological characteristics between two adjacent CT images have high similarity. Thus, the key frames can be extracted. And the results of key frames are used to direct the segmentation of the remaining pel-vic CT images according to the watershed algorithm based on skeleton markers. The proposed method greatly decreases the diagnostic time, and it’s helpful for the early diagnosis of patients, selection of surgi-cal planning, etc.
Methods
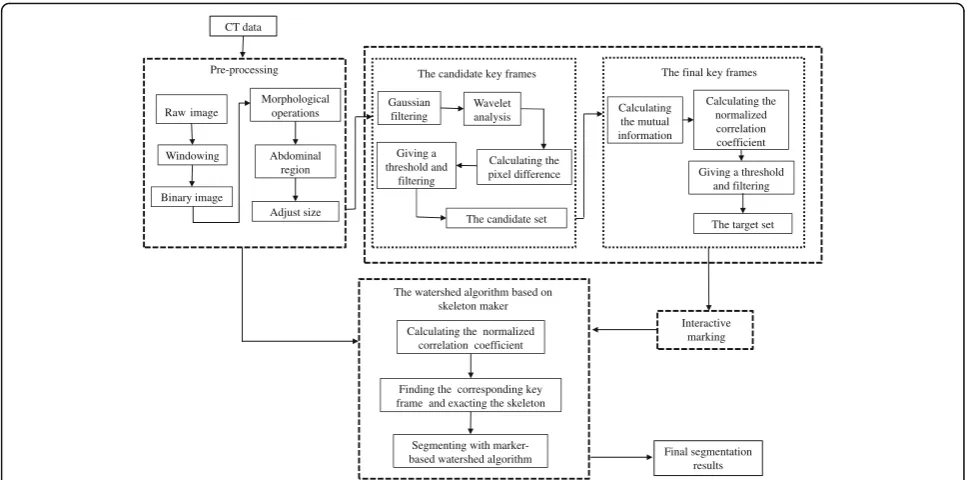
In this algorithm, we will select some CT images as key frames by using the method of key frame extrac-tion. Then, experts will manually mark key frames to appoint the bone topological structure of these CT images. The segmentation results of key frames will be applied to describe the bone topology of other im-ages. Next, the bone topology of the CT images will be used as a marker, and the watershed algorithm based on skeleton markers will be used to realize the automatic segmentation of pelvic structure. The algo-rithm consists of four parts: pre-processing of the CT image, key frame extraction in the CT image se-quence, interactive marking and the watershed algo-rithm based on skeleton markers. The pretreatment process is used to denoise, extract regions of interest, and resize the image, reducing the amount of data in a single CT image. The CT sequence key frame extraction process is divided into two steps, and this process is used to re-duce the number of CT images required for manual seg-mentation. In addition, the aim of interactive marking is to specify the bone topology of key frames. By matching key frames, the bone topology of each CT image can be acquired so that the accuracy of pelvic segmentation can be guaranteed. Finally, based on the interactive marking of key frames, the watershed algorithm based on skeleton markers is used to automatically segment all the CT im-ages. The overall schematic diagram of the algorithm is shown in Fig. 1. In the following sections, the method is explained in detail.
Dataset
The dataset has been obtained from Tianjin Medical University General Hospital and Tianjin Nankai Hospital. Data has been randomly collected from 20 patients with traumatic pelvic injuries. These patients are in the 35- to 60-year age range and both sexes account for half. For each CT image sequence, the size of the planning CT im-ages in the axial plane is 512 × 512 pixels, with 1 mm image resolution and 2–7 mm slice thickness. Besides, a total of 245 images are collected from each patient.
Pre-processing
Pre-processing removes surrounding artifacts from the original image, such as the CT platform and cables. Moreover, the image size is also adjusted in this process. The pelvis area is segmented from the original image as follows:
facilities, convert the data in the image using (1) with data compression to 256 Gy levels.
f xð Þ ¼
0
x− c−w
2 h i 255 w 255
x≤c−w
2
c−w
2<x<cþ
w
2
x≥cþw
2 8 > > > < > > > :
ð1Þ
Here, f is a bitmap gray value, x is image data, w is window width, andcis window level.
2. Create a binary version of the original image according to (2).
f xð Þ ¼ 01
x¼0
else ð2Þ
3. Apply morphological operations to the binary image so that the different objects can be separated and that the object which has the largest area is the pelvis. Next, all the pixels in this object will be set to 1, and others become 0. The binary image is called the“mask image”.
4. Conduct an image convolution with the mask image and the original image, removing the CT
platform, artifacts and other interference. At this time, the image is reserved for only the pelvis region; the remainder has been set to 0.
5. Adjust the size of the image by cutting out the non-pelvis area as much as possible. From now on, the pre-processed image is called the“input image”.
The method of key frame extraction
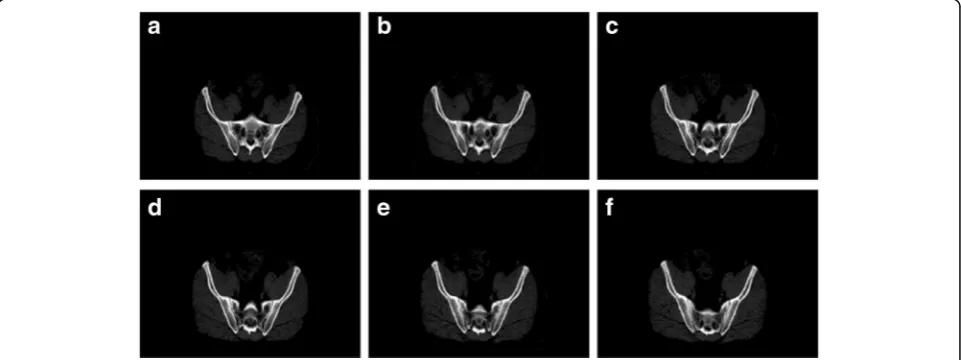
After pre-processing, key frame extraction from the CT image sequence becomes the focus of the method. In this paper, key frames refer to the CT images of a CT sequence that have obvious changes in bone structure. As we can see from Fig. 2, there are four consecutive CT images. The first two CT images have similar bone structures. From the graph, we also find that the bone structure of (c) has obvious topological differences from the previous im-ages. (b) has three bone topologies, while (c) has four ob-vious bone topologies. Therefore, (c) can be selected as a key frame. The method of key frame extraction consists of two steps. The first step is to obtain the candidate key frames. The last step is to obtain the final key frames.
To obtain candidate key frames, we extract the approximate region of bone as a region of interest so that the computation can be reduced. The pixel difference of the adjacent images is used to deter-mine whether a new candidate key frame is required. The pixel difference of the adjacent images is de-fined as (3).
CT data Pre-processing Raw image Windowing Adjust size Binary image Morphological operations Abdominal region Interactive marking The watershed algorithm based on
skeleton maker
Calculating the normalized correlation coefficient
Finding the corresponding key frame and exacting the skeleton
Segmenting with
marker-based watershed algorithm Final segmentation results Gaussian filtering Wavelet analysis Calculating the pixel difference The candidate key frames
Giving a threshold and
filtering
The candidate set
Calculating the mutual information Calculating the normalized correlation coefficient The final key frames
Giving a threshold and filtering
The target set
Dif ¼yjþ1−yj ð3Þ
The greater the value is, the lower the degree of similarity is. Therefore, when the pixel difference of the adjacent images is greater than the threshold, it is considered that the difference between the adjacent images is large and that the similarity is not obvious. Thus, a new candidate key frame is added to the can-didate set.
To summarize, the extraction of candidate key frames is implemented as follows:
1. Use a Gaussian filter on the input image.
2. Perform wavelet analysis of the filtered image and conduct image reconstruction using the approximation matrix.
3. CalculateT1based on (4).
4. Create a binary image based on (5).
5. Convolute the binary image with the filtered image and the resulting image is called the“interesting image”.
6. Sort the interesting images in accordance with the spatial order and import CT data{y1, y2, y3,⋯, yL}.
7. Fori= 1 toL‐1
Calculate the pixel difference of the adjacent images
If the difference is greater thanT2
thei+ 1image is added to the candidate set
Endif
Endfor
8. The candidate set of key frames {g1,g2,g3,⋯,gl} is gained.
During the extraction of the candidate key frames,T1 is the mean value of the reconstructed image of the non-zero area. It is defined as (4) and used to create a binary image. (4) and (5) are combined to obtain the ap-proximate region of bones. In particular, the key frames in the candidate set are the pre-processed images and not the reconstructed images.
T1¼ XN−1
x¼0 XM−1
y¼0
f xð ;yÞ=½NM−Zeros Sð Þ ð4Þ
Where f(x,y) is a bitmap gray value, N is the width of image, and M is the height of image. S = {(x, y) |f(x,y) = 0} is the set of background pixels and zero
pixels. Zeros(S) is the notation used for the cardinality of set S.
Mask xð ;yÞ ¼ 10
f xð ;yÞ>T1
f xð ;yÞ≤T1 ð5Þ
Where Mask(x,y)is the binary image of reconstructed image.
To illustrate the key frame extraction process, we will use data of Patient 1 to explain the process in detail. After generating the interesting images, these images are numbered from 1 to 245 according to the anatomic structure. Figure 3 shows the pixel difference value of the example. To avoid missing key frames,T2is defined as (6), and it is described in blue in Fig. 3. After the extraction of the candidate set, there are 196 CT images to be selected out.
T2¼0:7mean Difð Þ ð6Þ
To obtain the target key frames, mutual information [31] and the normalized correlation coefficient [32] are utilized. The mutual information is defined as (7), and the normalized correlation coefficient is defined as (8). The mutual information reflects the gray correlation of the image; a greater mutual information value indicates that the gray difference of the two images is smaller. However, there is a lack of spatial location information so that redundant key frames will be extracted only when using mutual information. Thus, the normalized correlation coefficient is proposed to reduce the redundant key frames; a greater normalized correlation coefficient value indicates that the two images have higher similarity. The experimental results show that using the normalized correlation coefficient can effectively reduce the number of redundant key frames.
I xð ;yÞ ¼ X a∈f1;b∈f2
Pf1f2ða;bÞlog Pf1f2ða;bÞ=Pf1ð ÞaPf2ð Þb
ð7Þ
WherePf1ðaÞis the probability density of imagef1, and
R xð ;yÞ ¼
X
M−1
i¼0 X
N−1
j¼0
f1ð Þi;j−f1
f2ð Þi;j−f2
ffiffiffiffiffiffiffiffiffiffiffiffiffiffiffiffiffiffiffiffiffiffiffiffiffiffiffiffiffiffiffiffiffiffiffiffiffiffiffiffiffiffiffiffiffiffiffiffiffiffiffiffiffiffiffiffiffiffiffiffiffiffiffiffiffiffiffiffiffiffiffiffiffiffiffiffiffiffiffiffiffiffiffiffiffi X
M−1
i¼0 XN−1
j¼0
f1ð Þi;j−f1 2XM−1
i¼0 X
N−1
j¼0
f2ð Þi;j −f2
2
v u u t
ð8Þ
Here, f1(i,j) is the pixel value of image f1, f2(i,j) is the pixel value of imagef2, f1 is the average gray value of
imagef1, and f2is the average gray value of imagef2. The extraction of the target set from the candidate set is illustrated as follows:
1. Import the candidate set{g1,g2,g3,⋯,gl}.
2. Fori= 1 tol‐1
Calculate the mutual information
If (I(i+ 1,i)≤T3)
thei+ 1image is added to the intermediate set Endif
Endfor 3. Forj= 1tok‐1
Calculate the normalized correlation coefficient
If (R(j+ 1,j)≤T4)
thej+ 1image is added to the target set
Endif
Endfor
4. The target set of key frames {k1,k2,k3,⋯,kt} is gained.
The mutual information value of the candidate set is shown in Fig. 4. In this case, T3 is the mean mutual information value and is shown in blue. In addition, when the mutual information value of adjacent candidate key frames is less thanT3, the candidate key frames will be selected out to calculate the normalized correlation coefficient. As we can see from Fig.5, there
is no significant change in the bone topology of these images in the intermediate set, and these images can use the segmentation results of the same key frame as the reference. Therefore, it is necessary to take measures to remove redundant key frames in the intermediate set. Figure 6 shows the normalized correlation coefficient value of images in the intermediate set. T4 is the mean normalized correlation coefficient and is shown in blue. An image will be chosen as a key frame in the target set when the normalized correlation coefficient is less than
T4. Finally, there are 31 images in the target set.
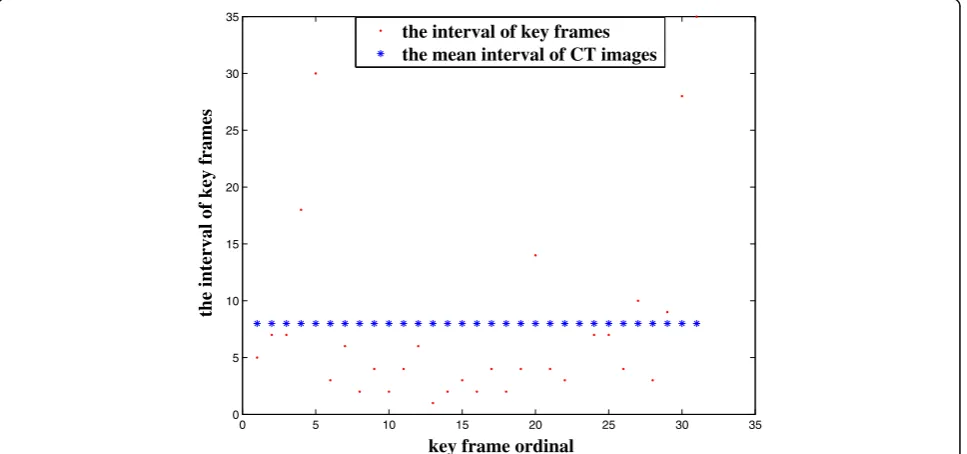
To describe the distribution of the key frames in the CT image sequence, Fig. 7 shows the interval between key frames. And the interval refers to the difference of each key-frame slice from the previous key-frame slice. At the same time, we equidistantly extract 31 images from the CT image sequence as a reference. It is found that the key frames are not evenly distributed. As a re-sult, we can draw a conclusion that the key frames can effectively reflect the changes in pelvic structure and that it is meaningful to extract key frames.
Based on the above procedure, the target set of key frames {k1,k2,k3,⋯,kt} can be extracted. After the extraction of key frames, the number of CT images required for manual marking is greatly reduced.
Interactive marking
For each image in the target set, the first step is creating a binary version of the image. Next, marker points are obtained by extracting the skeleton from the binary image. The method of extracting the skeleton is introduced in the next section. Finally, the initial contours can be automatically generated through the watershed algorithm based on skeleton markers, which will also be introduced in next section. However, the results may be inconsistent with the topological structure of the human pelvis so that the segmentation
0 50 100 150 200 250
0 0.5 1 1.5 2 2.5 3 3.5
4x 10 5
image ordinal
the pixel difference
the pixel difference threshold
results of this automatic algorithm cannot meet the requirements of clinical guidance. Therefore, the resulting image will be provided to experts, who will manually add or remove marker points to correct the initial contours. The segmentation results of key frames will be used to segment other CT images.
The watershed algorithm based on skeleton marking The method is divided into two parts: skeleton extraction and the marker-based watershed algorithm. Before segmentation, it is first necessary to search for the key frame matching the CT image. When a CT image is processed, the corresponding key frame image is obtained by calculating the normalized correlation co-efficient between the CT image and key frames in the target set. In the corresponding key frame image, the bone region segmentation results will be regarded as
foreground, and the remaining region will be regarded as background. Next, the skeleton of foreground and background can be obtained via skeleton extraction. On the other hand, the gradient image of CT image should be gained. Then, using skeleton image mark the gradient image and shield the original minimum pixels in gradi-ent image. Therefore, the new gradigradi-ent image will be ac-quired. Finally, the segmentation results are obtained by using watershed transform for the new gradient image.
Skeleton extraction
The skeleton can provide information about the size and shape of targets in an image [33]. In this paper, we use the skeleton to describe location and topology information for pelvic bones. The method of thinning is used for skeleton extraction [34]. Whether or not a boundary point is converted into a background point is
0 20 40 60 80 100 120 140 160 180 200
1 1.05 1.1 1.15 1.2 1.25 1.3 1.35 1.4
image ordinal
the mutual information
the mutual information threshold
Fig. 4The mutual information value of candidate key frames for Patient 1
determined by the neighboring relations, and the iterative process is ended up with a pixel width. Supposing that the foreground pixel value is 1, the background pixel value is 0, n(p1) is the number of non-zeros in the neighborhood, and s(p1) is the total number of adjacent pixels from 0 to 1. Figure 8 shows the relationship between a pixel p1 and eight-neighboring pixels. Whether a point can be removed or not depends on the eight adjacent points. In this paper, we consider mainly the following three cases [35]: υ1 indicates whether the deletion will cause re-gion splitting or not; υ2 indicates whether it is the east, south, or northwest border; υ3 indicates whether it is the north, west, or southeast border. These values can be described as in (9).
υ1¼fp1j2≤n pð Þ1 ≤6;s pð Þ1 ¼1g
υ2¼fp1jp2p4p6¼0;p8p4p6¼0g υ3¼fp1jp2p4p8¼0;p8p2p6¼0g
ð9Þ
D1¼fp1jp1¼1;p1∈υ1;p1∈υ2g
D2¼fp1jp1∈υ1;p1∈υ3g
ð10Þ
The skeleton extraction algorithm is divided into two steps. First, the boundary pixels that satisfy the condition D1 in the whole image are sought. The pixel
0 5 10 15 20 25 30 35
0 5 10 15 20 25 30 35
key frame ordinal
the interval of key frames
the interval of key frames the mean interval of CT images
Fig. 7The interval between key frames in the target set for Patient 1
0 10 20 30 40 50 60 70 80 90
0.3 0.4 0.5 0.6 0.7 0.8 0.9 1
image ordinal
the normalized correlation coefficient
the normalized correlation coefficient threshold
points that we find are the ones that can be deleted. The pixels are converted to the background points after traversing the whole image. Then, the boundary pixels that meet condition D2 in the transformed image are sought. Similarly, the pixels are converted after traversing the whole image. After this process is the next iteration, until there are no points that can be deleted between the two steps. In addition, the two conditions are presented as in (10).
As for key frames, the skeleton of the foreground (IF) and background (IB) can be generated by utilizing the skeleton extraction algorithm. The skeleton is shown as
SH=Skel(IF,IB) and it will be the marker points for the marker-based watershed algorithm.
The marker-based watershed algorithm
The marker-based watershed algorithm [36] is based on a gradient image. Therefore, creating a gradient image is the first step in this process. In this method, the gradient image is obtained using the Sobel operator. The convo-lution templates (Sx,Sy) can be described as follows:
Sx¼
1 2 1
0 0 0
−1 −2 −1
2 4
3
5 Sy ¼ 12 00 −−12 1 0 −1 2
4
3
5 ð11Þ
The gradient of pixel p1can be gained by calculating the convolution of the templates and the eight neighboring pixels in Fig.8. The solution is as follows:
Gx¼p9þ2p2þp3−ðp7þ2p6þp5Þ
Gy¼p9þ2p8þp7−ðp3þ2p4þp5Þ
ð12Þ
The gradient image can be described as ∇f(x,y), and
∇f(x,y) = [GX,GY]T, whereGxis the gradient along theX direction, andGyis the gradient along theYdirection.
The skeleton SH is used to mark the gradient image
∇f(x,y) At the same time, the original minimum pixels in gradient image will be shielded. In other words, in the marked gradient image, the local minimal value corresponds to the pixel region that is the non-zero area in the skeleton image. Finally, segmentation of the pelvic structure is achieved by using the watershed transform for the marked gradient image.
Results
The proposed segmentation method is tested on 20 patients. Each patient has 245 pelvic CT images. Patient 1 is used as an example to display the results from different stages of the method and they are presented in this section as follows.
Figure 9 shows the pre-processing results for the ex-ample. The results show that the edges of bone tissue are clearly defined by the window technology. Therefore, adjusting the window is necessary. In addition, the pelvis area can be extracted completely from the CT image after the removal of artifacts, platforms, etc.
Figure10shows the results obtained by the watershed algorithm based on skeleton markers. The results show that the distribution of pelvic structure can be well described by the skeleton and that the pelvic structure can be segmented accurately in a single CT image using this method.
Figure 11 shows the segmentation results of four CT images that are consecutive in the anatomic structure by the proposed method. The results show that the distribution of pelvic structure is well described by the
marker points that were obtained from the
corresponding key frame. Furthermore, the results also indicate that the proposed method can reliably segment the CT image sequence.
Figure 12 shows the segmentation results using the proposed method in fracture areas. (a), (b), (c) and (d) Fig. 8The relationship between neighboring pixels
are consecutive and these images are from Patient 3. These images show the segmentation results of CT images with sacrum bone fracture. (e), (f ), (g) and (h) are also consecutive and they are from Patient 7. And they display the contours of bones in ischium bone fracture area. As can be seen from Fig. 12, the proposed method can accurately segment the fracture area.
Table 1 shows the number of key frames in each CT sequence. The results show that the ratio between the number of key frames and the total CT sequence number is approximately 13%. Thus, the number of
images that need to be manually marked will be greatly reduced by extracting key frames.
Discussion
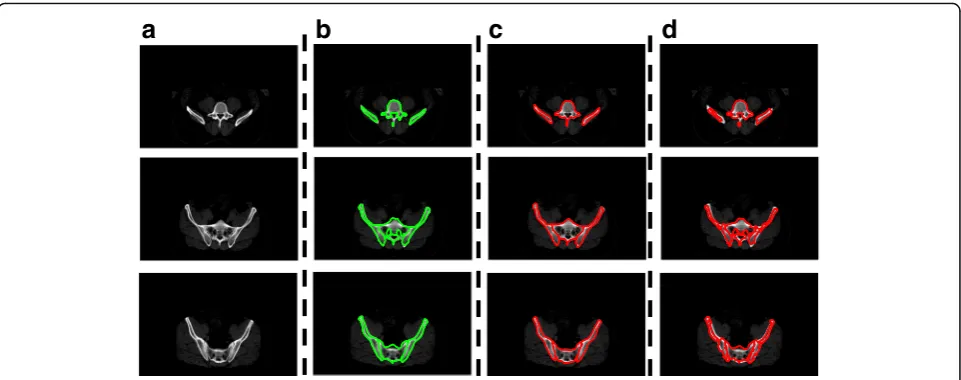
In this section, some measures are taken to evaluate the performance of the proposed algorithm. A quantitative comparison is performed between the manual segmentation and the computed segmentation. In addition, a three-dimensional display of the segmented bone structure is rendered. Besides, the performance of the watershed algorithm based on skeleton markers and gradient vector flow (GVF) is compared. And the Fig. 10Example results of Patient 1 obtained by the watershed algorithm based on skeleton markers. (a) is the input image as well as the pre-processed image. (b) is the skeleton image the for foreground and indicates the location of the pelvic structure. (c) is the skeleton image for the background and indicates the location of the other structures. (d) is the segmentation result and it is shown in the pre-processed image. The automatically segmented pelvic structure contours are displayed in red
a
b
c
d
running time of the proposed algorithm is also an im-portant index.
Evaluation measures
The overlapping area and the mean deviation distance are used to quantify the accuracy [37]. In this section, 245 CT images will be manually segmented by experts for each patient and the results will be the ground truth.
S1 represents surface obtained by the proposed method and S2 represents surfaces obtained by experts manually. Besides, L1represents a set of contour points obtained by the proposed method andL2represents a set of contour points manually obtained by experts. As for two surfaces, we define A1as the area for surface S1and A2as the area for surfaceS2.
The overlapping area O of two surfaces S1 and S2 is defined as:
O¼A1∩A2 A2
100% ð13Þ
The mean deviation distance Mad of two contour points setsL1andL2is defined as:
Mad¼ 1 K
XK
n¼1
d lðn;L2Þ ð14Þ
Where ln denotes each contour point inL1,Kdenotes the total number of contour points in L1. Deviation distance refers to the distance between the contours obtained by the proposed algorithm and the ground truth. The deviation distance between L1 and L2is defined as:
Fig. 12Example of segmentation results using proposed method in the fracture area. (a), (b), (c) and (d) are from Patient 3. (e), (f), (g) and (h) are from Patient 7. The segmentation results of the proposed method are shown in the original image. The manual segmentation results by experts are displayed in blue while the automatically segmented pelvic structure contours are displayed in red
Table 1Shows the number of key frames in each CT sequence
Images Total no. of CT images
Total no. of the candidate set
Total no. of the target set
Patient 1 245 178 28
Patient 2 245 153 32
Patient 3 245 148 30
Patient 4 245 164 33
Patient 5 245 157 33
Patient 6 245 177 31
Patient 7 245 169 32
Patient 8 245 163 27
Patient 9 245 157 31
Patient 10 245 182 35
Patient 11 245 178 31
Patient 12 245 159 27
Patient 13 245 170 30
Patient 14 245 170 33
Patient 15 245 144 29
Patient 16 245 138 27
Patient 17 245 169 31
Patient 18 245 173 33
Patient 19 245 165 29
Patient 20 245 154 30
Table 2Shows the segmentation results and the overlapping area of CT images from five patients’
Images The average overlapping area
Accurate Fair Unacceptable
Patient 1 96.3% 95.1%(233/245) 3.7%(9/245) 1.2%(3/245)
Patient 2 94.1% 93.5%(229/245) 4.5%(11/245) 2%(5/245)
Patient 3 97.4% 96.7%(237/245) 2.9%(7/245) 0.4%(1/245)
Patient 4 94.8% 94.7%(232/245) 4.1%(10/245) 1.2%(3/245)
d lðn;L2Þ ¼ minli∈L2kln−lik2 ð15Þ
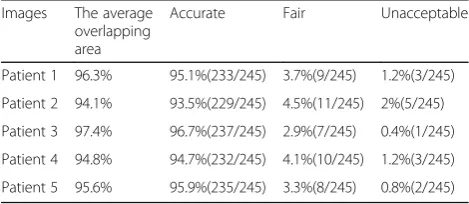
Five patients of the 20 patients are randomly selected, and their CT images are used to calculate the overlapping area O. The shapes presenting with an overlapping area of more than 90% are classified as “accurate”, the shapes presenting with an overlapping area of 90–80% are classified as “fair”, and the shapes presenting with an overlapping area of less than 80% are classified as“unacceptable”[37].
Table 2 shows the segmentation results and the overlapping area of CT images from five patients’. The results show that the average overlapping area of all the data is more than 94%. More than 93.5% of the results are classified as “accurate”, and less than 2% of the results are classified as“unacceptable”. The unacceptable results may be caused by blurred edges of bones, uneven gray value of bones, lack of appropriate key frames, etc.
Figure13shows the mean deviation distance of fifteen testing images. These images are randomly selected from Patient 1 to Patient 5.The maximum mean deviation distance is 5.03 pixels, and the minimum mean deviation distance is approximately 0.58 pixels. Without the impact of the method, an unsmooth
contour may also lead to a large mean deviation distance. The results show that the proposed method is reliable for accurate pelvic segmentation.
After segmented sequences of CT slice images are obtained, a three-dimensional model of pelvic bone structure can be reconstructed utilizing these segmented bone structures. In addition, three-dimensional visualization may be used for further validating the accuracy of the proposed method. The segmentation re-sults are visually inspected as shown in Fig. 14. As can be seen from this figure, the three-dimensional structure of pelvic bone is clearly presented and the detected frac-ture exits in the pelvic region.
The gradient vector flow (GVF) model
In this section, the segmentation performance using the watershed algorithm based on skeleton markers and the GVF model is compared. The GVF model was introduced by Xu and Prince [38] in 1998. In relation to the traditional snake model, the sensitivity of the initial curve position and the convergence of the concave area are improved. In this paper, the segmentation results of the key frames are taken as the initial curve in the GVF model.
Figure 15 shows the example of segmentation results using the two methods. As can be seen from Fig. 15b, the results of key frames cannot accurately describe the edges of pelvic bones in intervening images. However, the contours of bones in key frames can offer location and topology information of pelvic bones in the intervening images. Location information can be used to indicate the possible areas of bones and the topology information can be used to indicate the possible number of bones. From Fig. 15d, we can find that the information given by key frames cannot make GVF
0 5 10 15
0.5 1 1.5 2 2.5 3 3.5 4 4.5 5 5.5
CT image ordinal
the mean deviation distance (Pixels)
Fig. 13The mean deviation distance of fifteen testing images
model obtain good segmentation results. Through this comparison of the segmentation results, it can be found that the watershed algorithm based on skeleton markers has better segmentation effect than the GVF model.
Algorithm running time
In this section, the test environment is as follows: the CPU is Inter-Core i3–2120 3.3 GHZ, the system mem-ory is 4 GB, and the programming environment is MatLabR2014. Table 3 shows the running time of the proposed method except for the time of manual mark-ing. As we can see from the graph, the average running time is approximately 2 min for one patient with 245 CT images.
Interactive marking has an approximate time of 30 s for each key frame image because the experts only need to manually add or remove a small number of marker points. The experimental results show that there are approximately 30 CT images that are selected for manual marking. Therefore, the proposed method takes approximately 15 min for one patient with 245 CT
images. Such performance suggests a considerable reduction in processing time compared with manual segmentation.
In conclusion, the proposed method not only ensures the accuracy of pelvic segmentation but also reduces the time of segmentation.
Conclusions
A novel segmentation method based on CT image sequences of the pelvis is presented in this paper. The key parts of the method are the method of key frame extraction and the watershed algorithm based on skeleton markers. By using the method of key frame extraction, the number of manually marked CT images decreases to approximately 30. Based on the method of skeleton extraction, the distribution of pelvic structure can be well described in key frames. Considering that anatomical structures have characteristics of spatial continuity, the skeleton can be used to describe the location and topological information of pelvic bones in other CT images. Appling the watershed algorithm based on skeleton markers can achieve accurate, fast and efficient segmentation of pelvic structure. And segmentation results not only provide an important reference for early diagnosis and decisions regarding surgical procedures, they also offer more accurate data for medical image registration, recognition and 3D reconstruction.
In this paper, the performance of the proposed method depends on the accuracy of key frame extraction. When a crucial CT image is not selected, the accuracy of segmentation using the method will be
a
b
c
d
Fig. 15Example results using the watershed algorithm based on skeleton markers and the GVF model. These testing images are from Patient 1. (a) is the input image as well as the pre-processed image. (b) is the manual segmentation results of the corresponding key frame, and the edges are shown in green. (c) is the automatic segmentation results of the watershed algorithm based on skeleton markers, and the edges are shown in red. (d) is the segmentation results of the GVF model, the edges are shown in red and they are shown in the pre-processed image
Table 3Shows the Running Time of the Proposed Method
Procedure Average Running
Time
Pre-processing 27.657s
Extraction of candidate key frames 36.288s
Extraction of final key frames 45.482s
The watershed algorithm based on skeleton markers
21.834s
affected. In addition, the performance is also affected by blurred edges of bones, variation of bones, etc. since the watershed algorithm is applied.
Future work will focus on the following points: 1) Propose a more efficient method to extract key frames. This method should ensure that the key frames are not redundant and that crucial CT images will not be missing. In addition, the running time of the method should also be considered. 2) Apply this method to segment other organs. 3) Using this method to process MRI and ultrasound images. 4) Explore a method for 3D reconstruction relying only on the key frames.
In conclusion, the proposed method is able to achieve accurate, fast, and efficient segmentation of pelvic CT image sequences.
Abbreviations
CT:Computed tomography; GVF: The gradient vector flow (GVF) model
Acknowledgments
The dataset used for this project was provided by Tianjin Medical University General Hospital and Tianjin Nankai Hospital.
Funding
This work was supported by the National Natural Science Foundation of China (NSFC) under Grant 61475116.
Availability of data and materials
The datasets generated and analysed during the current study are available from the corresponding author on reasonable request.
Authors’contributions
HY and HW conceived and designed the experiments; HW performed the experiments; YS and XY analyzed the data; KX and YC provided dataset and medical guidance; HW wrote the manuscript. All authors read and approved the final manuscript.
Ethics approval and consent to participate
The dataset used for this project was provided by Tianjin Medical University General Hospital and Tianjin Nankai Hospital. And the study was approved by the Ethical Committee of Tianjin Medical University General Hospital and was conducted under the Declaration of Helsinki.
Competing interests
The authors declare that they have no competing interests.
Publisher’s Note
Springer Nature remains neutral with regard to jurisdictional claims in published maps and institutional affiliations.
Author details
1Department of Biomedical Engineering, Tianjin University, Tianjin, China. 2Department of Orthopedic, Tianjin Medical University General Hospital, Tianjin, China.3Department of Radiation Oncology, Tianjin Medical University Cancer Institute & Hospital, Tianjin, China.
Received: 2 August 2017 Accepted: 4 May 2018
References
1. Naumann RB, Dellinger AM, Zaloshnja E, Lawrence BA, Miller TR. Incidence and total lifetime costs of motor vehicle-related fatal and non-fatal injury by road user type in the United States. Traffic Inj Prev. 2010;11(4):353. 2. Management of Exsanguinating Pelvis Injuries:An algorithm for the
management of exsanguinating pelvic trauma.http://www.trauma.org/index. php/main/article/668/.Accessed 20 May 2008.
3. Fulkerson EW, Egol KA. Timing issues in fracture management: a review of current concepts. Bull Hosp Jt Dis. 2009;67(1):58.
4. Zhao JB, Liu J. Application value of three-dimensional CT reconstruction in diagnosis and treatment of pelvic fracture-dislocation. China J Orthop Traumatol. 2006;19(7):403–4.
5. Foshager MC, Walsh JW. CT anatomy of the female pelvis: a second look. Radiographics A Rev Publ Radiol Soc North America Inc. 1994;14(1):64–6. 6. Najarian K, Vasilache S, Smith R, et al. Accurate pelvic fracture detection for
X-ray and CT images: US, US 8538117 B2[P]. 2013.http://www. freepatentsonline.com/8538117.pdf.
7. Dalinka MK, Arger P, Coleman B. CT in pelvic trauma. Orthop Clin N Am. 1985;16(3):471–80.
8. Collier DC, Burnett SS, Amin M, Bilton S, Brooks C, Ryan A, Roniger D, Tran D, Starkschall G. Assessment of consistency in contouring of normal-tissue anatomic structures. J Appl Clin Med Phys. 2003;4(1):17–24.
9. Norouzi A, Rahim MSM, Altameem A, Saba T, Rad AE, Rehman A, Uddin M. Medical image segmentation methods, algorithms, and applications. IETE Tech Rev. 2014;31(3):199–213.
10. Li Y. Bone segmentation in human CT images. J Biomed Eng. 2004;21(2):169. 11. Natsheh AR, Ponnapalli PV, Anani N, Benchebra D. Segmentation of bone
structure in sinus CT images using self-organizing maps. In: IEEE international conference on imaging systems and techniques: 2010; 2010. p. 294–9. 12. Aguirreramos H, Avinacervantes JG, Cruzaceves I. Automatic bone
segmentation by a Gaussian modeled threshold. In: Medical Physics: Fourteenth Mexican Symposium on Medical Physics: 2016; 2016. p. 883–94. 13. Janc K, Tarasiuk J, Bonnet AS, Lipinski P. Genetic algorithms as a useful tool
for trabecular and cortical bone segmentation. Comput Methods Prog Biomed. 2013;111(1):72–83.
14. Mehnert A, Jackway P. An improved seeded region growing algorithm. Pattern Recogn Lett. 1997;18(10):1065–71.
15. Vasilache S, Ward K, Cockrell C, Ha J, Najarian K. Unified wavelet and gaussian filtering for segmentation of CT images; application in
segmentation of bone in pelvic CT images. Bmc Med Inform Decis Making. 2009;9(Suppl 1):1–8.
16. Nguyen NT, Branzan-Albu A, Branzan-Albu A. A new segmentation method for MRI images of the shoulder joint. In: Computer and robot vision, 2007 CRV '07 fourth Canadian conference on: 2007; 2007. p. 329–38.
17. Kim E, Li H, Huang X. A hierarchical image clustering cosegmentation framework. In: Computer Vision and Pattern Recognition, vol. 2012; 2012. p. 686–93. 18. Camastra F, Vinciarelli A. Machine learning for audio, image and video
analysis: theory and applications. London: Springer; 2008.
19. Mantas J. Methodologies in pattern recognition and image analysis—a brief survey. Pattern Recogn. 1987;20(1):1–6.
20. Calder J, Tahmasebi AM. A variational approach to bone segmentation in CT images. Proc SPIE Int Soc Opt Eng. 2011;7962(3):346–54.
21. Truc PTH, Lee S, Kim TS. A density distance augmented Chan-Vese active contour for CT bone segmentation. In: Conference: international conference of the IEEE engineering in Medicine & Biology Society IEEE engineering in Medicine & Biology Society Conference, vol. 2008; 2008. p. 482–5. 22. Martínez F, Romero E, Dréan G, Simon A, Haigron P, De CR, Acosta O.
Segmentation of pelvic structures for planning CT using a geometrical shape model tuned by a multi-scale edge detector. Phys Med Biol. 2014;59(6):1471. 23. Chen L, Chen Y, Wang Z, Zhao W, Chen J. Segmentation of the pelvic bone
using a generalized gradient vector convolution field snake model. J Med Imaging Health Inform. 2015;5(7):1482–7.
24. Gao Y, Shao Y, Lian J, Wang AZ, Chen RC, Shen D. Accurate segmentation of CT male pelvic organs via regression-based deformable models and multi-task random forests. IEEE Trans Med Imaging. 2016;35(6):1532–43. 25. Kardell M, Magnusson M, Sandborg M, Carlsson GA, Jeuthe J, Malusek A.
Automatic segmentation of pelvis for brachytherapy of prostate. Radiat Prot Dosim. 2016;169(1–4):398.
26. Wu J, Davuluri P, Ward K, Cockrell C, Hobson R, Najarian K. A new hierarchical method for multi-level segmentation of bone in pelvic CT scans. Annual International Conference of the IEEE Engineering in Medicine and Biology Society. 2011; 2011(4):3399–3402.
27. Li D, Zang P, Chai X, Cui Y, Li R, Lei X. Automatic multiorgan segmentation in CT images of the male pelvis using region-specific hierarchical appearance cluster models. Med Phys. 2016;43(10):5426.
29. Chen X, Bagci U. 3D automatic anatomy segmentation based on iterative graph-cut-ASM. Med Phys. 2011;38(8):4610.
30. Bakir H, Charfi M, Zrida J. Automatic active contour segmentation approach via vector field convolution. Signal Image Video Proc. 2016;10(1):1–10. 31. Steuer R, Kurths J, Daub CO, Weise J, Selbig J. The mutual information:
detecting and evaluating dependencies between variables. Bioinformatics. 2002;18(suppl_2):S231–40.
32. Gao GZ, Zhongwu LI, Lifu YU. Application of the normalized cross correlation coefficient in image sequence object detection. Comput Eng Sci. 2005;27(3):38–40.
33. Cornea N D, Silver D, Min P. Curve-skeleton properties, applications, and algorithms. IEEE Transactions on Visualization & Computer Graphics. 2007; 13(3):530.
34. Shu C, Mo Y. Morphological thinning based on image's edges. In: International conference on communication technology proceedings: 1998, vol. 1; 1998. p. 5.
35. Hui YU, Changsheng QU, Jinhang LI. Method for hand profile extraction in complicated conditions. Comput Eng Appl. 2015;51(14):170–4.
36. Wiese T, Yao J, Burns JE, Summers RM. Detection of sclerotic bone metastases in the spine using watershed algorithm and graph cut. Proc SPIE. 2012;8315(6):36.
37. Wu J, Belle A, Hargraves RH, Cockrell C, Tang Y, Najarian K. Bone segmentation and 3D visualization of CT images for traumatic pelvic injuries. Int J Imaging Syst Technol. 2014;24(1):29–38.