R E S E A R C H A R T I C L E
Open Access
Automatic migraine classification via
feature selection committee and machine
learning techniques over imaging and
questionnaire data
Yolanda Garcia-Chimeno
1,2*, Begonya Garcia-Zapirain
1,2, Marian Gomez-Beldarrain
3,
Begonya Fernandez-Ruanova
3and Juan Carlos Garcia-Monco
4Abstract
Background: Feature selection methods are commonly used to identify subsets of relevant features to facilitate the construction of models for classification, yet little is known about how feature selection methods perform in diffusion tensor images (DTIs). In this study, feature selection and machine learning classification methods were tested for the purpose of automating diagnosis of migraines using both DTIs and questionnaire answers related to emotion and cognition – factors that influence of pain perceptions.
Methods: We select 52 adult subjects for the study divided into three groups: control group (15), subjects with sporadic migraine (19) and subjects with chronic migraine and medication overuse (18). These subjects underwent magnetic resonance with diffusion tensor to see white matter pathway integrity of the regions of interest involved in pain and emotion. The tests also gather data about pathology. The DTI images and test results were then introduced into feature selection algorithms (Gradient Tree Boosting, L1-based, Random Forest and Univariate) to reduce features of the first dataset and classification algorithms (SVM (Support Vector Machine), Boosting (Adaboost) and Naive Bayes) to perform a classification of migraine group. Moreover we implement a committee method to improve the
classification accuracy based on feature selection algorithms.
Results: When classifying the migraine group, the greatest improvements in accuracy were made using the proposed committee-based feature selection method. Using this approach, the accuracy of classification into three types improved from 67 to 93% when using the Naive Bayes classifier, from 90 to 95% with the support vector machine classifier, 93 to 94% in boosting. The features that were determined to be most useful for classification included are related with the pain, analgesics and left uncinate brain (connected with the pain and emotions). Conclusions: The proposed feature selection committee method improved the performance of migraine diagnosis classifiers compared to individual feature selection methods, producing a robust system that achieved over 90% accuracy in all classifiers. The results suggest that the proposed methods can be used to support specialists in the classification of migraines in patients undergoing magnetic resonance imaging.
Keywords: Feature selection, Classification, DTI, SVM, Boosting(adaboost), Naive bayes, Migraine, Committee
*Correspondence: [email protected]
1DeustoTech - Fundacion Deusto, Avda. Universidades, 24, 48007 Bilbao, Spain 2Facultad Ingenieria, Universidad de Deusto, Avda. Universidades, 24, 48007 Bilbao, Spain
Full list of author information is available at the end of the article
Background
Migraine is a common and disabling type of headache with a worldwide one-year prevalence of 17% among women and 7% among men, and an incidence peak in early to mid-adolescence [1, 2].
Migraine attacks are characterised by recurrent episodes of severe headache with accompanying symp-toms of autonomic nervous system dysfunction. While most patients have an episodic form of variable fre-quency, a subset develops chronic migraine (CM), a condition characterised by headaches on 15 or more days per month and present in approximately 2% of the general population [3]. For unclear reasons, the episodic form evolves into chronic migraine at a rate of 2.5% per year, particularly in patients with obesity, low-income, medication overuse and a high attack rate [4].
Feature selection forms part of data mining techniques, in which we calculated the scores for each feature and by selecting those that obtained the best scores in which the threshold or to adjust the decision functions to make the selection more restrictive, or to adjust it to the set of data that one wishes to subject to study [5]. Many meth-ods exist [6–10]. We make this selection using a criterion function which is the separability between the classes, whereby we need classification in order to make the selec-tion so that the decision funcselec-tion may reveal the critical features that make the subjects belong to one class or another.
There are different criteria used to make the feature selection to assess the degree of importance that one fea-ture may have in terms of the set [11], such as according to the information [12, 13], classification error [14], con-sistency [8, 15], dependency [9] and distance between classes.
As has been stated, there is an internal classification for the feature selection method, although to obtain quantita-tive data to establish whether the selection made using the method is correct, we use an external classification with the following classifiers: SVM (Support Vector Machine) [16, 17], Boosting (Adaboost) [18] and Naive Bayes [19]. The first-mentioned classifier requires learning to select sub-sample to train the machine, setting aside the other samples for the classifier’s own validation. SVM (Sup-port Vector Machine) enables to adapt the kernel, this being the one that makes the separation transfer the sam-ples to the feature area [20]. Boosting is an algorithm that makes use of several single classifiers that might not individually be used, owing to their high level of inaccu-racy. However, using them as a whole makes it possible to construct a far more accurate classifier [21]. The last-mentioned classifier, Naive Bayes, enables a probabilistic approach to find the most likely hypothesis given a set of samples. Explicit probabilities are also calculated for each hypothesis [22].
The features used in this study to select them and sub-sequent classification of subjects to obtain via different questionnaires, which focus on items related to migraine pathologies and magnetic resonance images with diffu-sion tensor.
We make an attempt in this study to analyse the critical features to differentiate between subjects with sporadic migraine, chronic migraine and medication overuse, and control groups – to make a classification that prevents the doctor’s work from making a per-patient diagnosis, as well as preventing incorrect diagnoses.
To undertake the classification, we obtain values taken from DTI (Diffusion Tensor Imaging) images in addi-tion to selecting specific quesaddi-tionnaires about migraine [23]. These types of image enable white matter path-way integrity to examine in a non-invasive path-way. From these images we obtain the following measurements: frac-tional anisotropy (FA), to measure the completeness of the white matter; mean diffusivity (MD), to measure the mean molecular movement and/or square displacement of the general molecules, irrespective of the directionality of the tissue; radial diffusivity (RD), referring to the diffusivity direction perpendicular to the main diffusion axis; and axial diffusivity (AD), which refers to the diffusivity across the main axis, this being associated with the axon diam-eter [24, 25]. In this study the authors only use FA values from DTI images.
The main goal of this study is to automate the diag-nosis of patients with migraine through the classification of features obtained from DTI images and psychological tests applied to patients. In this way, we can make a diag-nosis about the person has migraine or hard headache, thus it helps to the doctors and supports their decisions when giving the prediction and their associated treatment. In addition to the classification itself, the feature selec-tion aid to algorithms to decrease the number and specify the tests necessary to diagnose migraine and. In terms of DTI images, it can delimit the areas affected by this pathology. Regarding the tests used, specialized neuro-radiologists select and the choice of DTI images has been also decided by neuro-radiologists, because due to these images they observe the deterioration in the grey matter of the brain.
Methods Participants
The sample used in this study comprises 52 subjects (15 control subjects, 19 patients with sporadic migraine and 18 with chronic migraine and medication overuse).
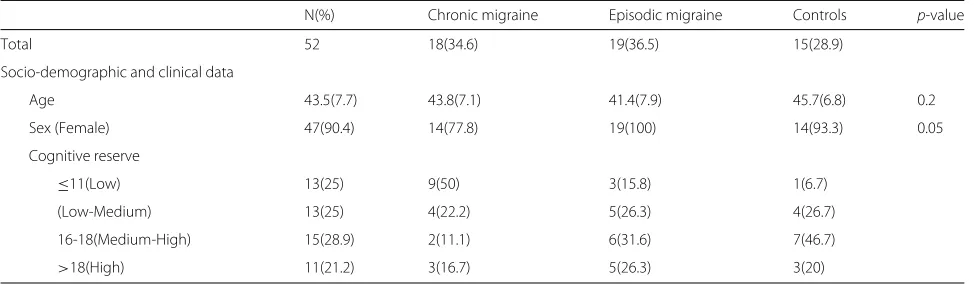
Table 1 shows the subjects used in the research, with the mean and typical deviation being shown for their age.
Table 1Description of the sample
N(%) Chronic migraine Episodic migraine Controls p-value
Total 52 18(34.6) 19(36.5) 15(28.9)
Socio-demographic and clinical data
Age 43.5(7.7) 43.8(7.1) 41.4(7.9) 45.7(6.8) 0.2
Sex (Female) 47(90.4) 14(77.8) 19(100) 14(93.3) 0.05
Cognitive reserve
≤11(Low) 13(25) 9(50) 3(15.8) 1(6.7)
(Low-Medium) 13(25) 4(22.2) 5(26.3) 4(26.7)
16-18(Medium-High) 15(28.9) 2(11.1) 6(31.6) 7(46.7)
>18(High) 11(21.2) 3(16.7) 5(26.3) 3(20)
Once the selection of the patients and signed the informed consent form, the following tasks were then per-formed: firstly, a depression and anxiety test, followed by the MRI. They were given a migraine calendar on which to note down the migraine attacks they have from day-to-day, the measurement taken and the number of working days lost owing to migraine.
These would be assessed every 3 months by the neurol-ogy team to check whether the chronic migraine and drug abuse diminish with suitable treatment and/or whether patients with sporadic migraine end up resorting to med-ication overuse. They would be monitored for a year, after which time there would a last assessment by once again administering the depression and life quality tests.
All the information gathered would enable patients with migraine to classify according they have had a good prog-nosis (sporadic sufferers who continue to have this type of migraine or those who no longer resort to medication overuse) or a bad one (those who persistently resort to medication overuse or sporadic sufferers who no resort to medication overuse).
All the subjects with migraine included in the study attended quarterly consultations with their doctor so that a set of accumulated variables that described what had occurred over the 3 months. In addition to these variables, those extracted from the tests carried out are also added.
This study received approval from the relevant ethical committee.
Questionnaires
Different questionnaires related to emotion and cognition were selected. These two factors influence the percep-tion of pain, and so as well as seeing to what extent the plan is impacting on the everyday life of an individual (life quality and dependency tests), the aim is to also ascertain the extent of pain suffered by patients (number of days with pain, amount of painkillers, MIDAS) and their emo-tional state (depression and anxiety tests) and cognitive level (IQ).
Intelligence quotient (IQ)
IQ was estimated by the Word Accentuation Test, which requires the pronunciation of 30 low-frequency Spanish words whose accents have been removed [28].
General quality of life (SF-36)
The SF-36 is a structured, self-reported questionnaire that includes 36 items measuring health status across eight domains [27]. The scoring system generates sub-scale scores for physical functioning (PF), role limitations due to physical problems (RP), bodily pain (BP), general health perceptions (GH), vitality (VT), social functioning (SF), role limitations due to emotional problems (RE) and mental health (MH). Two summary scores derive from the SF-36: the physical component (PF, RP, BP and GH) and the mental component (VT, SF, RE and MH).
Specific migraine quality of life questionnaire (MSQoL)
The MSQoL is a self-administered questionnaire that con-sists of 20 items, each of which is rated using a response scale with four categories (1 quite much to 4 not at all) grouped into three dimensions: avoidance (10 items), social relationships (six items) and feelings (four items). The scores were determined by adding the items for each domain. An overall score was also determined by adding the 20 items [29].
MIDAS
This questionnaire assesses headache-related disability [30]. Migraine patients answer five questions about the frequency (days) and duration of their headaches in the last three months, as well as how often these headaches limited their ability to participate in activities at work, at school, or at home.
Beck depression (BDI) and anxiety inventories (BAI)
feeling in the last week. Each question has a set of at least four possible choices ranging in intensity.
Medication-dependence questionnaire in headache (MDQ-H)
Medication dependence was assessed by the medication-dependence questionnaire in headache patients (MDQ-H) [32]. MDQ-H consists of a 21-item, self-administered questionnaire inquiring about the number of units of treatment taken per week, the number of days of headache, and emotional distress related to the lack of medication, among others. For each item, subjects are asked to describe their medication consumption accord-ing to a seven-point Likert scale (1: never or not at all; 3: sometimes or a little; 5: often or quite a lot; and 7: always or completely). Total score was obtained by adding the scores for all the items. A high score means an impor-tant disturbance in the way the patient uses his or her medication.
All the questionnaires used in this study were validated in Spanish except for the MDQ-H (validated in French and English).
Feature selection
Gradient tree boosting
Gradient Tree Boosting or Gradient Boosted Regression Trees (GBRT) refers to an automatic learning technique used in regression and classification models [33]. This algorithm forms a set of decision tree prediction models, whereby we construc the model in stages. This enables to optimize the arbitrary differentiable loss function.
Once the algorithms complete the classification, the
fit method is then applied to adjust the model to the classification, followed by the transform method, which enables to confine the entry reduce feature set to the most important ones.
Thus, we obtain the reduced dataset when applying these methods, which will insert in the SVM classifier.
L1-based feature selection
Feature selection using the penalty L1 penalty is efficient when applied to spurious features mixed with relevant features [34].
The L1 penalty efficiency has proved when selecting fea-tures of scattered models, which makes it robust regarding features that have a major noise load. Therefore, the L1 method provides a range of solutions by inherently select-ing features.
On this occasion, classification takes the form of the linear Support Vector Classification, which is a more flex-ible type of classification when selecting penalties and loss functions, as well as better scaling a greater number of existing samples. Moreover, as the number of samples is greater than the number of features, this selects the algo-rithm in order to resolve the problem with optimisation.
The algorithm applyfit transformmethod to this clas-sification, which first adjusts the classification model and then reduces the entry reduce feature set according to the most important ones in terms of this classification.
One it obtain the reduce feature set, classification is then made using the SVM machine learning algorithm.
Random forest
In the case of Random Forest methods, each tree in the set – both in terms of classification and regression – is constructed from an extracted sample, i.e. a first sample from the training set [35]. When it divides a node while constructing the tree, the division selected is not the best one from among all the features. In contrast, the division obtained is nonetheless the best from among a random subset of said features.
Random forest is an estimator adjusted to a number of tree classifiers in several data set sub-samples by using the mean to improve accuracy of the prediction and control of any “over-fitting”. The size of the sub-sample is always the same as the original size of the entry initial full dataset.
When applying this method, the classification is first carried out and then it apply thefitandtransform meth-ods to the resulting model, by means of which Random Forest adjust the model and obtain the dataset solely with the most important features.
Univariate features selection
Within the univariate type of feature selection exist dif-ferent methods, such as: “best K”, in which it disregard all features except the best “k” ones (the user decide this value), “percentile”, in which disregard all except a specific percentage of features issued by the user; using statistical tests such as the “false positive rate”, “false dis-covery rate” and “family wise error”; lastly, there is the method that enables you to fully administer the univari-ate method by selecting its own configuration, whereby the algorithm can select the best strategy with a range of hyper parameters [36].
The selection of “best K” method for this case study from among the univariate feature selections available, whereby the user may select the exact number of features with which they wish to subsequently carry out classifica-tion by disregarding the others that form part of the initial set of data.
Once it carries out the procedure, then appliesfit trans-formmethod, which enables to adjust the model and the initial full dataset converted with all the features into a new set of data comprising only the most important ones.
Classification
Taking into account that in this study, the authors pro-ceed to classify 3 groups: control group, sporadic migraine and chronic migraine. Therefore, we use multi-class clas-sifiers instead of binary clasclas-sifiers.
SVM
The supervised classifier Support Vector Machine (SVM) is effective in higher-dimensional spaces and in cases where the number of dimensions is greater than the num-ber of samples [37]. Regarding its decision function, it uses a subset of training points, meaning the classifier’s memory is efficient. SVM is also versatile, containing the option of selecting different kernel functions for the deci-sion function. There are already a number of common specified kernels, although it is possible to personalise the kernel.
Moreover, we use cross-validation methods to ensure independence of the division between training and valida-tion data, specifically theStratified K foldmethod, which divides the samples into stratified folds, two training and validation groups according to the total number of ele-ments. Each set group contains approximately the same percentage of samples of each target class as the complete set. The “folds” value is 8, i.e. the iterations made in the course of validation. Therefore, it produces a classification for each iteration and the final accuracy is the mean of these iterations.
This classifier allows multi-class classification according to a one-vs-one scheme.
Boosting (Adaboost)
This algorithm proposes an iterative training a series of base classifiers, whereby each new classifier may pay closer attention to any data that has been erroneously classified by previous classifiers in such a way to obtain a general classifier with high performance features when combine the aforementioned classifiers. For this, it cre-ates series of iterations in which the classifier assigns a train output weight by adding it to the set to ensure to obtain the system’s global output via a weighted linear combination of all the base classifiers.
Therefore, it combines the predictions made by each base classifier via a weighted majority vote, thus gen-erating the final prediction. It applies weights for each iteration to all the data and to the training samples. In the first iteration, all the weights applied are equal, whereby supplied the classifier with the original data. For each suc-cessive iteration, it modifies the sample weights individu-ally and the algorithm is again applied to the “re-weighted” data. At a specific point in the classification, it applies greater weight to the training examples that have been erroneously predicted, where will assign the correctly pre-dicted samples [38]. As the iterations advance, the samples that are difficult to predict receive increasing influence,
enabling the algorithm to in turn be increasingly adjusted to the samples and thus obtaining the optimum classifica-tion.
In this classifier, it uses a decision tree inside the Boost-ing classifier parameters to improve prediction accuracy on a multi-class classification, instead the binary classifi-cation.
Naive bayes
Bayesian learning algorithms are able to calculate explicit probabilities for each hypothesis based on Bayes’ theorem, as well as being comparable to neural network methods and decision trees [39]. This algorithm enables a proba-bilistic approach to the inference based on the assumption that any unknown ones of interest remain probabilistic distributions. Therefore, it can achieve an optimum solu-tion via such forms of distribusolu-tion and the data observed, enabling the possibility of a hypothesis occurring to be quantitatively weighted.
This classifier has various features, among which each training sample affects the hypothesis probability, mak-ing the classifier more effective by bemak-ing able to directly disregard any incompatible hypotheses. It associates a confidence percentage with the predictions by combin-ing these predictions based on their confidence score. Moreover, it classifies every new instance as a prediction function of multiple hypotheses that are weighted by their probabilities.
Certain knowledge may also be included beforehand, i.e. even though not included at the start, the probabil-ity of each hypothesis and probabilprobabil-ity distribution of the samples must be estimated, for which purpose it takes the relevant information from the training phase. Naive Bayes can be applied in cases where there are a large num-ber of medium-sized or large training sets, and where the features that describe the samples are independent of each other – as well as being commonly and successfully applied in diagnoses.
Specifically, this classifier implements the Gaussian Naive Bayes for classification that allows the multi-class classification to comply with the 3 groups in this study.
Integration
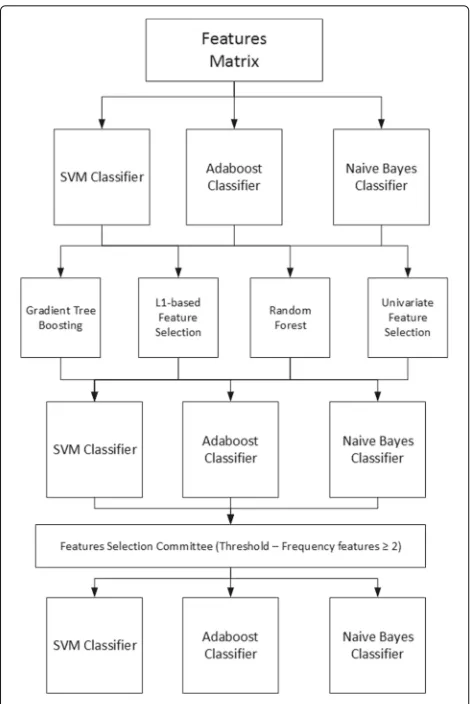
Fig. 1Block diagram showing the feature selection process and classification. Each of the selection methods is applied to the initial full dataset with all features, classifying them so as to quantify whether any improvement exists. The feature selection method committee is then applied and the resulting reduce set is once again classified
Naive Bayes. From this step we will obtain the accuracy associated with each feature selection method.
The next step is to bring together all the resulting dataset and obtain the repetition frequency for each fea-ture in these dataset. When carrying out the study using 4 methods, we thought that those features should be selected which are at least repeated 2 or more times from the 4 existing methods, whereby the chosen threshold is 2. This new reduce dataset is then obtained with all the samples together with the features obtained using the fea-ture selection method committee [40, 41]. Thus, not only does this respond to the decision of a single method, but it is also necessary for at least two of the feature method reductions to coincide in the most important features.
Lastly, the final step involves classification of this new reduced dataset, whereby due to the datum that provides the accuracy, we may observe whether these methods
improve the efficiency of the classifiers by themselves and with the committee.
All experiments were performed using the Python Scikit-Learn 0.17 (stable) version.
Results
Several phases will need to complete in order to ascertain whether the feature selection methods improve classifica-tion. Firstly, we classify the initial full dataset with all the features. Feature selection will then be carried out using each of the 4 methods, obtaining a new reduce dataset for each of them. These new dataset will be again intro-duced into the classifiers, producing new accuracy. We will already be able to observe in this step whether the methods improve or worsen efficiency by themselves.
We create a method committee with a threshold of 2, including only the features repeat 4 or more times in a new reduce set. Thus, it is possible to ensure that not only are the features selected by a single method, but that there are at least 2 selected by taking into account the opinion of the methods used. And lastly this final dataset is then classified, obtaining the accuracy.
There are 3 groups to classify that belong to subjects who suffer from sporadic and chronic migraine patholo-gies and medication overuse, and the control group. These will respond to specific psychological tests, thus obtain-ing items from each test that are subsequently used for classification purposes.
Classification with initial dataset
We obtain 90% accuracy when introduce all the features referring to sporadic and chronic migraine pathologies and medical overuse. Moreover the precision achieve is 85%, recall 91% and F1score 87%.
We achieve 93% accuracy in the classification of the three groups in the case of the Boosting classifier. The precision is 100%, recall 89% and F1score 93%.
Lastly, we obtain 67% accuracy using the Naive Bayes classifier (Table 2). The precision is 66%, recall 76% and F1score 69%.
Feature selection methods
We select the most important features applying the methods according to the features of each method, i.e.
Table 2Accuracy, precision, recall and F1score of the initial full set with all features using the SVM, Boosting (Adaboost) and Naive Bayes classifiers
Accuracy Precision Recall F1score
SVM 90% 85% 91% 87%
Boosting (Adaboost) 93% 100% 89% 93%
according to a decision, variance function or feature cor-relation.
Table 3 shows the number of features that each method considers the most important, as well as the percentage decrease. The least restrictive method proved is L1-based feature selection, in which 20 features were disregarded, while the most restrictive was gradient tree boosting, which disregarded 37 of the 41 features. The following section shows the classification accuracy with the most important features according to each method.
Classification using feature selection methods
As observed, each method selected certain features as being the most important. Table 4 shows the accuracy with the SVM, Boosting and Naive Bayes classifiers.
We obtaine the worst classification using the univari-ate feature selection method and subsequent classification using Naive Bayes with a 60% accuracy (precision 53%, recall 87% and F1score 66%), while the best classification is the gradient tree boosting - again using the Naive Bayes classification and with 98% accuracy (precision 96%, recall 100% and F1score 98%).
Referring to Table 2, the univariate feature selection
method worsened the classification percentage by 14% with all the features available. In contrast, the gradient tree boosting method improved the classification percent-age by 8% with the features selected as being the most important.
Classification using the feature selection method committee
Lastly, we perform a method committee obtaining the most important features from each feature selection method, i.e. the features most frequently found in the resulting dataset will be the ones selected to carry out a new classification. The committee is formed not only to ascertain the opinion of a particular method but also because other opinions exist, with the one that is most repeated winning.
To this end, a threshold value needs to state with which to ascertain the frequency beyond to select the features. In this case and bearing in mind there are 4 methods, the value will be at least 2 repeated features. This means
Table 3Number of remaining features and percentage decrease according to the number of initial features, applying this using all the feature selection methods
Number of features Percentage decrease
Gradient Tree-Boosting 4 90%
L1-based 21 48%
Random Forest 12 70%
Univariate 10 75%
Table 4Accuracy of the resulting dataset after having applied of the feature selection methods using the SVM, Boosting
(Adaboost) and Naive Bayes classifiers
Accuracy Precision Recall F1score
SVM
Gradient Tree Boosting 98% 100% 94% 96%
L1-based 88% 86% 85% 84%
Random Forest 91% 91% 85% 87%
Univariate 78% 80% 78% 78%
Boosting (Adaboost)
Gradient Tree Boosting 94% 100% 92% 9%
L1-based 91% 91% 91% 89%
Random Forest 95% 100% 94% 96%
Univariate 87% 87% 87% 85%
NaiveBayes
Gradient Tree Boosting 98% 96% 100% 98%
L1-based 61% 60% 78% 67%
Random Forest 92% 86% 98% 91%
Univariate 60% 53% 87% 66%
that 2 or more will be the frequency required to select the most important features from those obtained using the methods.
In Table 5 can be seen the number of features that meet the threshold requirement, whereby those features will be the ones used for the new classification. These features refer to the amount of medication taken, scores on depres-sion scales, number of years that the subject has suffered from the pathology, with subjects’ physical functions and mental health, and anxiety scales.
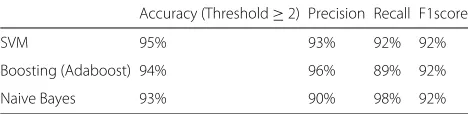
Classification with this new set of features was again carried out using SVM, obtaining 87% accuracy, 93% pre-cision, 92% recall and 92% F1score (Table 6).
Lastly, by comparing the improvement in classification between this latest value and those obtained previously from the initial classification and that carried out once we applied the feature methods, as we can see in Table 6
Table 5Features selected from the chosen threshold applied to the resulting features of each feature selection method
Frequency (All = 4)
Total Pain days 4
Total Analgesics 4
Score MSQoL 3
Left Uncinate 3
Left Cingulate Gyrus 2
Score MDQ-H 2
Table 6Accuracy, precision, recall and F1score with the dataset resulting from the feature selection method committee using the SVM, Boosting (Adaboost) and Naive Bayes classifiers
Accuracy (Threshold≥2) Precision Recall F1score
SVM 95% 93% 92% 92%
Boosting (Adaboost) 94% 96% 89% 92%
Naive Bayes 93% 90% 98% 92%
that this classification using the selection method com-mittee improves on the accuracy of what had previously been classified. The percentage improvement of the L1-based feature selection method is 61%, this being consid-ered a significant improvement of the accuracy. However, we see from classification of the dataset obtained using this method, it did not obtain a high accuracy and the classification could even be considered random (54%).
Therefore, if we disregard this percentage improvement, we see that improvement over the initial full dataset with all the features is 12%.
Discussion
Features were selected in this study to carry out a better classification when differentiating between subject who suffer from sporadic and chronic migraine pathologies and medication overuse.
From an initial full set comprising all the subjects and all the features belonging both to psychological ques-tionnaires, data regarding days with pain, amount of painkillers and values obtained from DTI images, we obtained 90% classification accuracy between the three groups subject to study in the case of the SVM classifier, 93% in the case of Boosting and 67% in the case of Naive Bayes. Therefore, the SVM classifier offers an efficient method for classifying samples, as it has solid foundations in terms of statistical learning, thus enabling to optimize the decision function in the training process [42].
As regards the SVM and Boosting classifiers, we obtaine an accuracy in classification of at least 90%. There is no study in which machine learning techniques have been applied to classify the migraine pathology, although they applied in other studies to other pathologies, e.g. in the study conducted by Dyrba, in which the used machine learning techniques – specifically the SVM classifier for classification of subjects via DTI images belonging to Alzheimer’s disease [43]. On this occasion, we obtained 80.3% accuracy. We achieved a better percentage in this particular article, as not only was classification made with the features obtained from DTI images, but features from specific questionnaires for migraine were also added. The SVM classifier was used in another study by Ingalhalikar, although on this occasion for classification of schizophre-nia – also via DTI images [44]. The authors obtained a 90.62% accuracy following a feature selection process.
From what can be observed obtaining features from DTI images is a good method for making the classification, facilitating the specialist’s work without the need to visu-ally review images of all the subjects to determine whether they suffer from the pathology or are healthy. Any unnec-essary costs are thus avoided.
Additionally and as in the study, feature selection implies an improvement in the accuracy of classifiers [44]. If the features that describe subjects are independent of each other in terms of the migraine pathology, then clas-sification percentages are higher reducing the number of features. In the case of the SVM and Boosting classi-fiers, this increase is fairly insignificant, as in both cases the accuracy is already above 90%. Yet in the case of the Naive Bayes classifier, we can see a major improve-ment in the classification of the individuals subject to study.
Despite these good results, it should be noted that the study does not have a large number of samples in the full dataset, having fewer than 20 subjects per group. There-fore, the overfitting problem can be given by the low number of samples for the training, and the classification algorithm can be adjusted to really specific features of the training data. Therefore, in the future lines will include the fact of increasing the number of samples to avoid these problems and the main goal will bet the percentage of accuracy of the classifier.
The authors have used the same questionnaires and clinical assessments for machine learning to use before for establishing the clinical diagnosis. This fact could maybe introduce some circularity that the algorithms will cer-tainly find these features to best differentiate the subject groups.
were obtained specifically by a feature selection algorithm such as gradient tree boosting, the feature selection com-mittee is deemed to achieve a more robust system as the best selection features from among four feature selection algorithms – not taking into account the opinion of just one of them.
The fact should also be taken into account that com-bining features deriving from DTI images and features obtained from specific questionnaires about this pathol-ogy provides a robust and reliable classification. In other words, the DTI images and questionnaires complement each other, the fact of having the two parts being deemed clinically vital to be able to establishing a result as to whether the subject suffers from migraine or otherwise. This occurs in the study carried out by Robinson [47], in which he makes use of magnetic resonance images and data from questionnaires to predict clinic aided tracheal intubation using multiple features.
Conclusion
Distinguishing between patients with sporadic migraine, chronic migraine, and patients at risk of medication overuse is possible via feature selection techniques and machine learning. We obtained a classification with over 93% accuracy in the case of the three classifiers included in this article (SVM, Boosting and Naive Bayes). Moreover, the initial dataset containing 41 features (questionnaires and DTI images) was reduced when carrying out the fea-ture selection to the 7 most important feafea-tures with a combination of DTI images and questionnaires related to emotion and cognition. The classification ratio was improved by 28% in the case of the Naive Bayes classifica-tion due to this feature selecclassifica-tion.
Thus, the method can classify patients due to a small set of features from specific questionnaires related to emo-tion and cogniemo-tion, combined with features obtained from DTI images resulting from prior selection of the most important features.
This feature selection is effective when disregarding fea-tures that are deemed not relevant within the set, or those that are deemed redundant. In this way, the accu-racy of the classifier improves when applying these types of method, obtaining a more robust and accurate system and preventing any confusion owing to features that are unimportant – achieving the best possible classification of samples with the best features.
Acknowledgements
The authors would like to thank all those who took part in the study, especially Dr. Alberto Cabrera Zubizarreta, from the Department of Neuroradiology, Osatek, Hospital of Galdakao (Spain). Finally, we would like to thank all person who agreed to take part in the study, making it possible.
Funding
Publication of this article was supported by the Instituto Carlos III (PI11/1243) and European Regional Development Funds (FEDER).
Availability of data and materials
Individual participant data cannot be shared. Questions about the dataset can be directed to the correspondig author.
Authors’ contributions
Author’s team performed the design of the system. YGC conducted the performance of the software tool with the classifier and feature selection methods. BGZ, MGB, JCGM, and BFR helped to the performance of the tool and made the assessment. In addition, all authors wrote, read and approved the final version of the manuscript.
Competing interests
The authors declare that they have no competing interests.
Consent for publication
Not applicable.
Ethics approval and consent to participate
Ethics approval for this study was obtained from University of Deusto (Ethic committee’s reference number: ETK-4/14-15).
All these patients included in this study signed a previously informed consent for magnetic resonance records and specific questionnaires to use in this research.
Publisher’s Note
Springer Nature remains neutral with regard to jurisdictional claims in published maps and institutional affiliations.
Author details
1DeustoTech - Fundacion Deusto, Avda. Universidades, 24, 48007 Bilbao, Spain.2Facultad Ingenieria, Universidad de Deusto, Avda. Universidades, 24, 48007 Bilbao, Spain.3Service of Neurology Hospital de Galdakao-Usansolo, Barrio Labeaga, S/N, 48960 Galdakao, Spain.4Research and Innovation Department, Magnetic Resonance Imaging Unit, OSATEK, Alameda Urquijo, 36, 48011 Bilbao, Spain.
Received: 13 August 2016 Accepted: 29 March 2017
References
1. Stewart WF, Lipton RB, Celentano DD, Reed ML. Prevalence of migraine headache in the United States: relation to age, income, race, and other sociodemographic factors. Jama. 1992;267(1):64–9.
2. Stovner LJ, Zwart JA, Hagen K, Terwindt G, Pascual J. Epidemiology of headache in Europe. Eur J Neurol. 2006;13(4):333–45.
3. Wood AJ, Goadsby PJ, Lipton RB, Ferrari MD. Migraine—current understanding and treatment. N Engl J Med. 2002;346(4):257–70. 4. Bigal ME, Lipton RB. Clinical course in migraine conceptualizing migraine
transformation. Neurology. 2008;71(11):848–55.
5. Kira K, Rendell LA. A practical approach to feature selection. In: Proceedings of the ninth international workshop on Machine learning. San Mateo: Morgan Kaufmann Publishers; 1992. p. 249–56.
6. Saeys Y, Inza I, Larrañaga P. A review of feature selection techniques in bioinformatics. Bioinformatics. 2007;23(19):2507–17.
7. Forman G. An extensive empirical study of feature selection metrics for text classification. J Mach Learn Res. 2003;3:1289–305.
8. Dash M, Liu H. Consistency-based search in feature selection. Artif Intell. 2003;151(1):155–76.
9. Yu L, Liu H. Efficient feature selection via analysis of relevance and redundancy. J Mach Learn Res. 2004;5:1205–24.
10. Wang G, Song Q, Sun H, Zhang X, Xu B, Zhou Y. A feature subset selection algorithm automatic recommendation method. J Artif Intell Res (JAIR). 2013;47:1-34.
11. Dash M, Liu H. Feature selection for classification. Intell Data Anal. 1997;1(1):131–56.
12. Battiti R. Using mutual information for selecting features in supervised neural net learning. Neural Netw IEEE Trans. 1994;5(4):537–50.
14. Estévez PA, Caballero RE. A niching genetic algorithm for selecting features for neural network classifiers. In: ICANN 98. London: Springer; 1998. p. 311–16.
15. Lashkia GV, Anthony L. Relevant, irredundant feature selection and noisy example elimination. Syst Man Cybern B Cybern IEEE Trans. 2004;34(2): 888–97.
16. Pal M, Foody GM. Feature selection for classification of hyperspectral data by SVM. Geosci Remote Sens IEEE Trans. 2010;48(5):2297–307.
17. Hsu C-W, Chang C-C, Lin C-J. A practical guide to support vector classification. Tech rep, Department of Computer Science, National Taiwan University. 2003.
18. An TK, Kim MH. A new diverse AdaBoost classifier. In: Artificial Intelligence and Computational Intelligence (AICI), 2010 International Conference on. Vol. 1. IEEE; 2010. p. 359–63.
19. Murphy KP. Naive Bayes classifiers: University of British Columbia; 2006. Technical Report, [online] Available: http://www.cs.ubc.ca/murphyk/ Teaching/CS340-Fall06/reading/NB.pdf.
20. Maji S, Berg AC, Malik J. Classification using intersection kernel support vector machines is efficient. In: Computer Vision and Pattern Recognition, 2008. CVPR 2008 IEEE Conference on. IEEE; 2008. p. 1–8.
21. Hu W, Hu W. Network-based intrusion detection using Adaboost algorithm. In: Proceedings of the 2005 IEEE/WIC/ACM International Conference on Web Intelligence. IEEE Computer Society; 2005. p. 712–17. 22. Panda M, Patra MR. Network intrusion detection using naive bayes. In J
Comput Sci Netw Secur. 2007;7(12):258–63.
23. Gomez-Beldarrain M, Oroz I, Zapirain BG, Ruanova BF, Fernandez YG, Cabrera A, et al. Right fronto-insular white matter tracts link cognitive reserve and pain in migraine patients. J Headache Pain. 2016;17(1):1. 24. Le Bihan D, Mangin JF, Poupon C, Clark CA, Pappata S, Molko N, et al.
Diffusion tensor imaging: concepts and applications. J Magn Reson Imaging. 2001;13(4):534–46.
25. Song SK, Yoshino J, Le TQ, Lin SJ, Sun SW, Cross AH, et al. Demyelination increases radial diffusivity in corpus callosum of mouse brain. Neuroimage. 2005;26(1):132–40.
26. Maes M, De Ruyter M, Hobin P, Suy E. The dexamethasone suppression test, the Hamilton Depression Rating Scale and the DSM-III depression categories. J Affect Disord. 1986;10(3):207–14.
27. Alonso J, Prieto L, Anto J. [The Spanish version of the SF-36 Health Survey (the SF-36 health questionnaire): an instrument for measuring clinical results]. Medicina clínica. 1995;104(20):771–6.
28. Gomar JJ, Ortiz-Gil J, McKenna PJ, Salvador R, Sans-Sansa B, Sarró S, et al. Validation of the Word Accentuation Test (TAP) as a means of estimating premorbid IQ in Spanish speakers. Schizophr Res. 2011;128(1):175–6. 29. Patrick DL, Hurst BC, Hughes J. Further Development and Testing of the
Migraine-Specific Quality of Life (MSQOL) Measure. Headache J Head Face Pain. 2000;40(7):550–60.
30. Stewart WF, Lipton RB, Kolodner K. Migraine disability assessment (MIDAS) score: relation to headache frequency, pain intensity, and headache symptoms. Headache J Head Face Pain. 2003;43(3):258–65. 31. Beck AT, Steer RA, Ball R, Ranieri WF. Comparison of Beck Depression Inventories-IA and-II in psychiatric outpatients. J Pers Assess. 1996;67(3): 588–97.
32. Radat F, Irachabal S, Lafittau M, Creac’h C, Dousset V, Henry P. Construction of a medication dependence questionnaire in headache patients (MDQ-H) validation of the French version. Headache J Head Face Pain. 2006;46(2):233–9.
33. Prettenhofer P, Louppe G. Gradient Boosted Regression Trees in Scikit-Learn. In: PyData 2014. London; 2014.
34. Stemle E, Onysko A. Automated L1 identification in English learner essays and its implications for language transfer. Transf Eff Multiling Lang Dev. 2015;4:297.
35. Buitinck L, Louppe G, Blondel M, Pedregosa F, Mueller A, Grisel O, et al. API design for machine learning software: experiences from the scikit-learn project. arXiv preprint arXiv:1309.0238. 2013.
36. Abraham A, Pedregosa F, Eickenberg M, Gervais P, Mueller A, Kossaifi J, Gramfort A, Thirion B, Varoquaux G. Machine learning for neuroimaging with scikit-learn. Frontiers Neuroinformatics. 2014;8.
37. Pedregosa F, Varoquaux G, Gramfort A, Michel V, Thirion B, Grisel O, et al. Scikit-learn: machine learning in Python. J Mach Learn Res. 2011;12: 2825–30.
38. Mathanker S, Weckler P, Bowser T, Wang N, Maness N. AdaBoost classifiers for pecan defect classification. Comput Electron Agric. 2011;77(1):60–8.
39. Islam MJ, Wu QJ, Ahmadi M, Sid-Ahmed MA. Investigating the performance of naive-bayes classifiers and k-nearest neighbor classifiers. In: Convergence Information Technology, 2007. International Conference on. IEEE; 2007. p. 1541–46.
40. Dietterich TG. Ensemble methods in machine learning. In: International workshop on multiple classifier systems. Berlin Heidelberg: Springer; 2000. p. 1–15.
41. Witten IH, Frank E. Data Mining: Practical machine learning tools and techniques, Second Edition (Morgan Kaufmann Series in Data
Management Systems). San Francisco: Morgan Kaufmann Publishers Inc.; 2005.
42. Garrett D, Peterson D, Anderson CW, Thaut MH, et al. Comparison of linear, nonlinear, and feature selection methods for EEG signal classification. Neural Syst Rehabil Eng IEEE Trans. 2003;11(2):141–4. 43. Dyrba M, Ewers M, Wegrzyn M, Kilimann I, Plant C, Oswald A, et al.
Robust automated detection of microstructural white matter
degeneration in Alzheimer’s disease using machine learning classification of multicenter DTI data. PloS ONE. 2013;8(5):e64925.
44. Ingalhalikar M, Kanterakis S, Gur R, Roberts T, Verma R. DTI based diagnostic prediction of a disease via pattern classification. In: Medical Image Computing and Computer-Assisted Intervention–MICCAI 2010; 2010. p. 558–65.
45. Estévez P, Tesmer M, Perez C, Zurada JM, et al. Normalized mutual information feature selection. Neural Netw IEEE Trans. 2009;20(2):189–201. 46. Jirapech-Umpai T, Aitken S. Feature selection and classification for
microarray data analysis: evolutionary methods for identifying predictive genes. BMC Bioinforma. 2005;6(1):148.
47. Yan Q, Yan H, Han F, Wei X, Zhu T. SVM-based decision support system for clinic aided tracheal intubation predication with multiple features. Expert Syst Appl. 2009;36(3):6588–92.
• We accept pre-submission inquiries
• Our selector tool helps you to find the most relevant journal • We provide round the clock customer support
• Convenient online submission • Thorough peer review
• Inclusion in PubMed and all major indexing services • Maximum visibility for your research
Submit your manuscript at www.biomedcentral.com/submit