Open Access
Research article
Automated detection of regions of interest for tissue microarray
experiments: an image texture analysis
Bilge Karaçali and Aydin Tözeren*
Address: Center for Integrated Bioinformatics, School of Biomedical Engineering, Science and Health Systems, Drexel University, 3141 Chestnut Street, Philadelphia, Pennsylvania 19104-2875, USA
Email: Bilge Karaçali - [email protected]; Aydin Tözeren* - [email protected] * Corresponding author
Abstract
Background: Recent research with tissue microarrays led to a rapid progress toward quantifying the expressions of large sets of biomarkers in normal and diseased tissue. However, standard procedures for sampling tissue for molecular profiling have not yet been established.
Methods: This study presents a high throughput analysis of texture heterogeneity on breast tissue images for the purpose of identifying regions of interest in the tissue for molecular profiling via tissue microarray technology. Image texture of breast histology slides was described in terms of three parameters: the percentage of area occupied in an image block by chromatin (B), percentage occupied by stroma-like regions (P), and a statistical heterogeneity index H commonly used in image analysis. Texture parameters were defined and computed for each of the thousands of image blocks in our dataset using both the gray scale and color segmentation. The image blocks were then classified into three categories using the texture feature parameters in a novel statistical learning algorithm. These categories are as follows: image blocks specific to normal breast tissue, blocks specific to cancerous tissue, and those image blocks that are non-specific to normal and disease states.
Results: Gray scale and color segmentation techniques led to identification of same regions in histology slides as cancer-specific. Moreover the image blocks identified as cancer-specific belonged to those cell crowded regions in whole section image slides that were marked by two pathologists as regions of interest for further histological studies.
Conclusion: These results indicate the high efficiency of our automated method for identifying pathologic regions of interest on histology slides. Automation of critical region identification will help minimize the inter-rater variability among different raters (pathologists) as hundreds of tumors that are used to develop an array have typically been evaluated (graded) by different pathologists. The region of interest information gathered from the whole section images will guide the excision of tissue for constructing tissue microarrays and for high throughput profiling of global gene expression.
Published: 9 March 2007
BMC Medical Imaging 2007, 7:2 doi:10.1186/1471-2342-7-2
Received: 25 August 2006 Accepted: 9 March 2007
This article is available from: http://www.biomedcentral.com/1471-2342/7/2
© 2007 Karaçali and Tözeren; licensee BioMed Central Ltd.
BMC Medical Imaging 2007, 7:2 http://www.biomedcentral.com/1471-2342/7/2
1 Background
The standard procedure in clinical assessment of invasive breast cancer is the classification of the tumor into one of the three distinct histology grades [1]. Main difficulties related to grading of breast cancer in a reliable and repro-ducible fashion have been attributed by researchers to the arbitrary mathematical formula for grade assignment, observer-dependent evaluation of the grade parameters and the cellular and texture heterogeneity of the tumor [2,3]. Recent advances in global gene expression profiling and tissue microarrays have uncovered the potential of biomarker expression sets in clinically relevant classifica-tion and subsequent individualized treatment [4-9].
Rapid progress is being made in developing gene chips with high diagnostic potential [10-12]. Similarly, recent advances in the development of high density tissue micro-arrays allow the assessment of multiple protein expression for diagnostic and prognostic purposes over a large number of tissue sections from breast disease tissue banks [13-16]. Both the gene chip and tissue microarray meth-ods require sampling of the tumor tissue at a location con-taining large amounts of cancer cells. Because these methods are so new, standard automated protocols have not yet been developed to identify the regions of interest in the tumor tissue. Instead, these regions are selected on the basis of the visual evaluation of histology slide images by expert pathologists and as such, the molecular profil-ing obtained for the tissue with these new high through-put methods may be operator dependent. Present study aims to develop automated procedures for identifying cancer cell rich regions of interest in whole section histol-ogy slides for guidance in sampling tissue in constructing tissue microarrays. Our automated image processing method is capable of classifying breast histology image blocks into three clusters specific to normal appearance, specific to cancerous appearance, and those that are not specific to either. The spatial distributions of cancer-spe-cific image blocks predicted using the statistical learning
algorithms developed in this study can be used to guide the sampling of tumor tissue for constructing tissue microarrays. Advanced image analysis such as those that are present in the literature can then be utilized to process the biomarker decorated images in tissue microarrays for clinically relevant classification of the tissue [1,17-26].
2 Methods
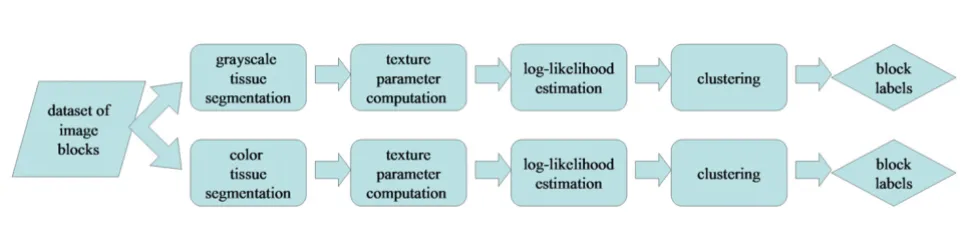
In this section, we describe our dataset of image blocks, the series of automated image analysis algorithms that were used to collect image texture parameters for these blocks, and the statistical learning algorithm developed in this study to classify these blocks into normal-specific, cancer-specific, and non-specific categories. A flowchart of the methodology is shown in Figure 1. The details on each step are described below.
2.1 Histology image dataset
The image dataset used in this analysis was obtained by capturing the digital images of 14 Hematoxylin and Eosin (H&E) stained whole section breast tissue slides from a total of 6 specimens. This collection of histology slides was provided to this study by Dr. Jeffrey Hooke of Walter Reed Army Medical Center. Drexel University Institu-tional Review Board reviewed our research concerning histology slides taken from breast tumors from patients whose identities were undisclosed, and determined that it was in compliance with Federal-Wide Assurance # 00001852 on the treatment of human subjects as well as being in compliance with Drexel University research pol-icy involving biological samples with undisclosed private information. The images were taken using a Nikon Cools-cope VS digital microsCools-cope (Nikon Corporation Co., Ltd., Parale Mitsui Bldg., 8, Higashida-cho, Kawasaki-ku, Kawa-saki, Kanagawa, 210-0005, Japan) at 10× magnification, corresponding to a pixel size of approximately 1.37 µm ×
1.37 µm. The digitization of whole section slides was
achieved in terms of consecutive frames (7817 overall for all 14 histology slides) that reconstruct a complete slide
Flowchart of the methods used to analyze image blocks and determine the normal-specific, cancer-specific, and non-specific clusters
Figure 1
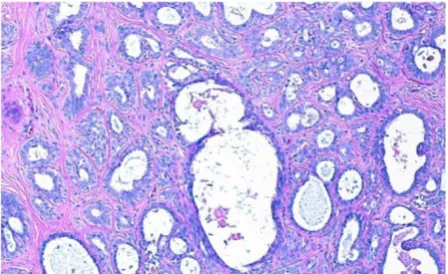
when put together in the proper order. Among the 14 slides, 5 have been determined to exhibit normal or benign appearances. Invasive Ductal Carcinoma (IDC) have been identified in the remaining 9 slides both by Dr. Jef-frey Hooke and Dr. Min Huang of Fox Chase Cancer Center. An example of an image bock of a benign breast histology slide is shown in Figure 2 along with a constitu-ent frame. Note that the image frame is a rectangle with dimensions 0.66 × 1.03 mm2. The size of the rectangle is
comparable to the size of blocks used in tissue microar-rays [15,16]. The typical dimensions of the whole section slides used in this study are 2.04 × 2.89 cm2.
2.2 Adaptive image segmentation
Histology slides of breast tissue stained with H&E show chromatin-rich regions in blue, the surrounding stroma in pink, and the unstained regions in white. In this study, we have implemented grayscale and color-based segmenta-tion algorithms to partisegmenta-tion histology images into three primary regions: chromatin-rich, stromal tissue, and the unstained regions. These segmentation algorithms are described below.
2.2.1 Grayscale segmentation
The image intensity observed in each pixel of a given image was first expressed as the average of red, green, and blue color channels. Then a k-means unsupervised cluster-ing algorithm [27,28] was carried out to identify the intensity thresholds between the darker chromatin-rich regions, relatively brighter stroma regions, and the bright-est unstained regions. For improved convergence and sta-bility, the pixels with saturated intensity were excluded
from the segmentation. The k-means algorithm was
ini-tialized at the smallest, median, and largest intensity val-ues. The grayscale segmentation process used in the study is illustrated in Figure 3.
2.2.2 Color segmentation
The first step in color segmentation was to compute the image representation in the CIE Lab color space [29] via
conversion from the RGB color space used by most image
acquisition devices. The Lab representation carries several advantages over the RGB space [30]: First and foremost, it allows constructing a device-independent representation of the color scene by factoring in the color of the ambient light and constructing unbiased luminance and chroma-ticity indices. Secondly, it approximates the color differ-ences perceived by an average human in the computed color indices, so that a more uniform distribution is obtained among similar colors.
Adaptive segmentation of histology images into their con-stituents were implemented in two successive steps. First, we used the luminance index to determine the foreground (consisting of chromatin-rich and stromal regions) from
the background (unstained regions). For this purpose, an iterative algorithm was used to fit a two-component Weibull mixture to the observed luminance indices. The algorithm performed repeated line searches to find the mixture parameters that optimized the fit to the observed values. The maximum likelihood threshold between the two components then determined the luminance thresh-old that separated the chromatin-rich and stromal regions from the unstained regions.
In the next step, we used a modified k-means clustering
algorithm to separate chromatin-rich regions from the stroma. Relative magnitudes of the pixel chromaticity indices were utilized as guide for the desired separation. By virtue of the Lab color space, the pixels of chromatin-rich and stromal regions in H&E stained histology slides accumulated around distinct vectors in the a and b chro-maticity space centered at the origin. We computed these chromaticity vectors by defining cluster centers as direc-tional vectors that minimized the average Euclidean dis-tance from the pixel chromaticity indices to their respective cluster centers in a k-means iteration. The full color segmentation algorithm used in this study is illus-trated in Figure 4.
2.3 Texture parameters of segmented histology image blocks
The texture properties of each image block were repre-sented in the present study by three parameters: the per-centage of area of the image covered by chromatin-rich
cell nuclei (B), percentage occupied by collagen-rich
stroma (P), and a parameter of spatial heterogeneity
rep-resented in this study as H. We have defined H as the
probability of a pair of neighboring pixels to belong to different tissue constituents among all possible pairs observed in the image. The parameter H is lower in image blocks where different tissue constituents are aggregated together in comparison to image blocks where the constit-uents are dispersed among and across each other. All three of these parameters vary between 0 and 1. Moreover, the percentage of unstained area in an image block denoted by W then satisfies W = 1 - B - P.
The texture parameters were computed using grayscale and color segmentation algorithms for each image block in the dataset:
MPgrayscale = [Bgrayscale Pgrayscale Hgrayscale]T
and
MPcolor = [Bcolor Pcolor Hcolor]T
associ-BMC Medical Imaging 2007, 7:2 http://www.biomedcentral.com/1471-2342/7/2
A histology slide of benign breast tissue stained with H&E and an image spot of size comparable to the tissue samples used in tissue microarrays
Figure 2
Histology image segmentation into chromatin-rich, stromal, and unstained regions using image intensity Figure 3
BMC Medical Imaging 2007, 7:2 http://www.biomedcentral.com/1471-2342/7/2
Histology image segmentation into chromatin-rich, stromal, and unstained regions using color information Figure 4
ated with the image block in Figures 3 and 4 are MPgrayscale
= [0.2105 0.4108 0.2397]T and MP
color = [0.3682 0.3233
0.1176]T based on the tissue segmentation maps obtained
using the two segmentation methods.
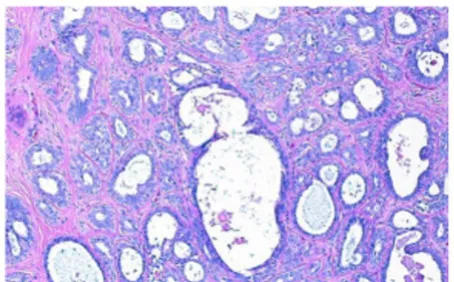
Image blocks that contained extensive fat or unstained region were excluded from our dataset via the use of a ground truth data subset. This subset contained 16 frames of benign presentation and 20 frames of IDC. Randomly selected elements of this subset are shown in Figure 5. The ground truth data subset was used to estimate the upper bound for unstained regions in both cancerous and benign tissue in cell crowded regions. Image blocks that had white in amounts greater than this upper bound were eliminated from the dataset for further analysis. The resulting dataset contained 2395 image blocks for which image texture analysis was conducted.
2.4 Statistical learning for detecting cancer-specific tissue image regions
Image blocks in our dataset were classified using the B, P,
and H values for each block into three clusters: those
observed in normal (N) or cancerous specimens (C) along with those observed frequently in both tissue types (G). To this end, we estimated the log-likelihood ratios of probability density functions that govern the distributions of texture profiles of image blocks obtained from normal and cancerous whole section slides. This estimation was performed using a nonparametric method at each image block described below.
Let pn and pc denote the probability density functions for the texture profiles of image blocks observed in normal and cancerous specimens. We defined the normal-spe-cific, cancer-spenormal-spe-cific, and non-specific image block clus-ters based on their texture profiles as
where N, C, and G denote the three clusters, and τ= log(95/5) is the 95% specificity threshold that ensures that no more than 5% of image blocks assigned to nor-mal-specific and cancer-specific clusters are mislabeled.
We estimated the likelihood ratio pn (MP)/pc (MP) for a texture profile MP using an asymptotic property of a near-est neighbor classification rule. Suppose a texture profile
MP is given, and a series of nearest neighbor classifiers have been invoked using randomly selected reference datasets with N samples observed in normal slides and N
samples observed from cancerous slides. Suppose also that out of a total of M such classifications, the profile MP
is assigned to the normal class Mn times and to the cancer-ous class Mc = M - Mn times. It can be shown that for large
N and large M, pn (MP)/pc (MP) ⯝Mn/Mc.
Let n and c represent the classes of texture profiles
col-lected from normal and cancerous histology slides respec-tively. Given the texture profiles {MPi}, i = 1, ..., ᐍ, collected from image blocks observed in normal and can-cerous histology slides, we first normalized the corre-sponding texture parameters observed across the dataset so that they span the range [0, 1] as uniformly as possible, and then used the algorithm below to estimate their like-lihood ratios.
• initialize = 0 and = 0 for all i = 1, ..., ᐍ
• for j = 1, ..., M do
- randomly select N texture profiles of image blocks
observed in normal histology slides and N profiles from
those observed in cancerous slides
- collect all selected profiles into a reference dataset
- assign each texture profile to n or c using a nearest neighbor rule based on the reference dataset
- for i = 1, ..., ᐍ do
* if MPi is not in the reference dataset, then
• if MPi is assigned to n, increment ← + 1
• if MPi is assigned to c, increment ← + 1
• for i = 1, ..., ᐍ do
- for each texture profile MPi, compute the estimated
log-likelihood ratio LLRi = /
The number of times different texture profiles (B, P, H) were evaluated in classification varied according to a
Pois-N=
>
( )
MP p MP p MP
n
c
log ( )
( ) τ 1
C =
< −
( )
MP p MP p MP
n
c
log ( )
( ) τ 2
G=
≤ ≥ −
MP p MP
p MP p MP p MP n c n c
log ( )
( ) log
( )
( )
τ and τ
( ) 3
Mni Mci
Mni Mni
Mci Mci
BMC Medical Imaging 2007, 7:2 http://www.biomedcentral.com/1471-2342/7/2
Randomly selected image blocks from the ground truth dataset Figure 5
son distribution controlled by N and the total number of samples in n and c. Thus, the number of repetitions M
could be adjusted so that most of the samples were tested at least a predetermined number of times.
In order to refine the estimated log-likelihood ratios, we used a support vector regression algorithm operated by a radial basis function kernel [31-33] for an ε-insensitive
cost function with ε = log( ). This final step ensured
that the log-likelihood ratios varied smoothly across the texture feature profiles and substantially improved the reliability of the estimates.
The complete procedure used to estimate log-likelihood ratios at observed data points is illustrated in Figure 6. Two separate classes are shown with 1000 samples each, with Gaussian distributions at respective means 0 and 2 and unit variances. The procedure to estimate the log-like-lihood ratios of the two classes at the observed samples repeated 1000 times provides noisy estimates, while the support vector machine regression estimate accurately captures the unknown true log-likelihood ratio. Note that only the samples over which at least one misclassification has been observed are included in the support vector regression procedure since the others do not carry any information on the log-likelihood ratios of the two classes at their specific locations in the observation space.
3 Results
This section presents our results on the segmentation of image blocks; distribution of texture parameters B, P, and H in the dataset of image blocks; the normal-specific, can-cer-specific, and non-specific image block clusters; and their spatial distributions across histology slide images. Image regions that are comprised of cancer-specific blocks are considered as regions of interest and this information is utilized in sampling of the tumor tissue for constructing tissue microarrays with significant clinical relevance. Computations were carried out in parallel using grayscale and color tissue segmentation methods and results are presented for both segmentation methods.
3.1 Comparison of texture profiles via grayscale and color segmentation
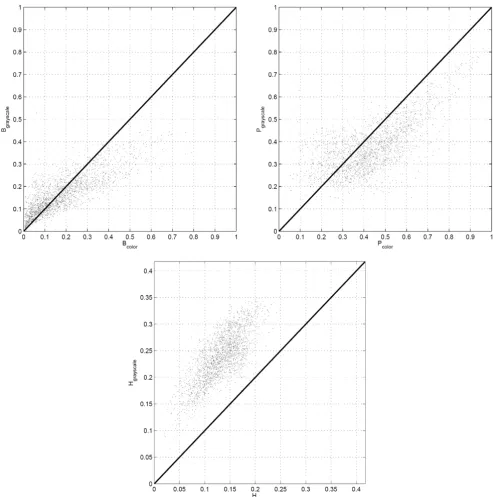
The grayscale tissue segmentation algorithms used in this study relies on the image intensities whereas the color tis-sue segmentation algorithms utilizes image luminance to identify the unstained regions first, and then uses image chromaticity indices to differentiate between the chroma-tin-rich and stromal regions. The examples in Figures 3 and 4 show that the tissue segmentation maps achieved by the two methods vary, and this variation is reflected on the texture parameters (B, P, and H) estimated for each
image block using two different segmentation algorithms. Note that B and P represent the percentages of area of the image occupied by chromatin and stroma respectively,
whereas H was defined in the Methods Section as a
meas-ure of heterogeneity in the image block. Scatter plots of B,
P, and H obtained for each image block in the dataset
algorithms are shown in Figure 7 for grayscale and color tissue segmentation. The figure indicates that the parame-ters B, P, and H vary significantly when computed by the two different segmentation methods for the same image block. For B and P, the relationship between the grayscale and color tissue segmentation measurements follows a nonlinear pattern. The grayscale segmentation algorithm provides larger values than the color segmentation when
B and P are relatively low, and vice versa. This can be attributed to the preference of the k-means algorithm that forms the basis of grayscale segmentation to produce clus-ters of similar sizes, potentially leading to over-expressed values when they are low and under-expressed values when they are high. The scatter plot of the heterogeneity indices show a systematic difference between the two
seg-mentation methods as H is estimated larger in grayscale
segmentation than color segmentation. This can also be seen visually in the segmentation maps in Figures 3 and 4 where the map obtained by grayscale tissue segmentation is noticeably more grainy than the one obtained using color tissue segmentation, suggesting that color is more homogeneous across H&E stained tissue histology images than intensity. Since it is not possible to quantitatively determine which algorithm provides more accurate seg-mentation maps, we conducted the subsequent analysis using both segmentation algorithms in parallel. In the analysis of comprehensive image subsets involving differ-ent types of malignancy and/or tumors of differdiffer-ent organs, the parameter set used in this article (B, P, H) can readily be revised and enriched with additional texture parameters causing minimal change in the rest of the log-likelihood estimation algorithm.
3.2 Detection of cancer-specific image blocks using statistical learning
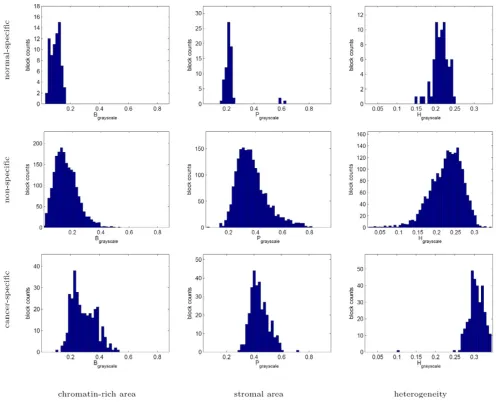
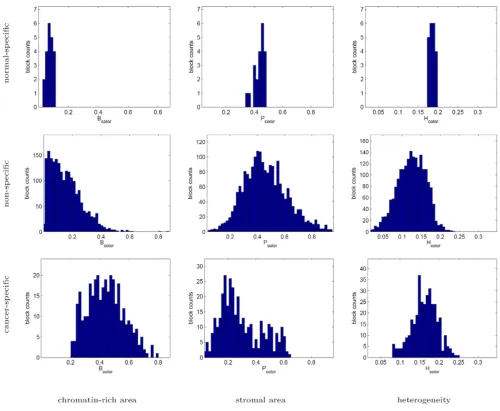
We have determined the (B, P, H) profiles of the 2395 image blocks in our dataset. These texture features were then used as described in the Methods Section to classify the image blocks into three clusters: those that are specific
to normal (N) and cancerous histology slides (C) and
those that exhibit no particular specificity to cancer or normal tissue (G). The texture profiles of the normal-spe-cific, cancer-spenormal-spe-cific, and non-specific image blocks as identified separately using grayscale and color tissue seg-mentation algorithms are shown in Figure 8. Not surpris-ingly, the bulk of the image blocks show no particular preference to either normal or cancerous histology slides, since a great portion of histology slides of cancerous sam-ples are often occupied by normal appearing tissue
BMC Medical Imaging 2007, 7:2 http://www.biomedcentral.com/1471-2342/7/2
Statistical learning: Log-likelihood estimation procedure for unsupervised clustering of class-specific observations in a one-dimensional example
Figure 6
Comparison of the texture parameters obtained from histology image blocks using both grayscale and color tissue segmenta-tion algorithms
Figure 7
BMC Medical Imaging 2007, 7:2 http://www.biomedcentral.com/1471-2342/7/2
around a cancerous neoplasm. By the same token, the number of image blocks that are specific to normal histol-ogy slides is very small (71 and 21 out of 2395 using gray-scale and color segmentation respectively). This may be an artifact, or it may also signal the existence of certain histological appearances that disappear in highly invasive breast tumor tissue.
The histograms of texture parameters exhibited by the normal-specific, cancer-specific, and non-specific image block clusters in Figures 9 and 10 indicate that the cancer-specific cluster is commonly associated with highly chro-matin-rich regions in both the grayscale and color tissue segmentations. The cancer-specific cluster is additionally characterized by increased heterogeneity in grayscale seg-mentation.
The confusion matrix that displays the overlap between the clusters identified based on grayscale tissue segmenta-tion and color tissue segmentasegmenta-tion algorithms in Table 1 indicate that even though the texture parameters collected from image blocks using the two schemes are different, the clusters with which they are identified are largely the same. This indicates that both segmentation methods have the potential to identify clinically relevant regions of interest on whole section histology images in an auto-mated image analysis procedure.
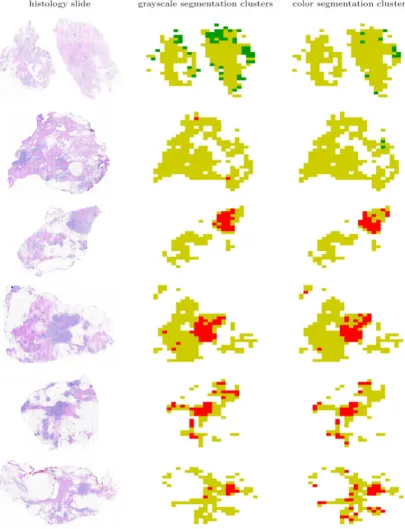
The spatial organization of the normal-specific, cancer-specific, and non-specific image blocks on several histol-ogy slides are shown in Figure 11. The figure shows that
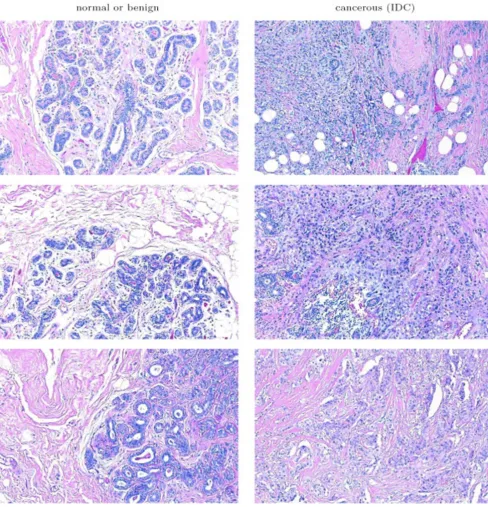
the images of whole section histology slides are domi-nated by image blocks in the non-specific cluster. The malignant neoplasms in the cancerous histology slides that were marked for us by the two pathologists men-tioned in the Methods Section were identified as cancer-specific image blocks both by grayscale and color segmen-tation. Thus, the proposed methodology aptly recognized texture profiles that are not consistent with those observed in normal and benign breast tissue histology. Select exam-ples of image blocks representing the three clusters com-monly identified by both the analysis based on the grayscale tissue segmentation and that on color tissue seg-mentation are shown in Figure 12.
The composition of image block clusters obtained using grayscale and color tissue segmentation algorithms in terms of the image blocks of normal and cancerous histol-ogy slides computed in respective confusion matrices are shown in Tables 2 and 3. The 4 image blocks that are assigned to the cancer-specific cluster obtained using gray-scale tissue segmentation algorithm in spite of having been observed in normal histology slides is within the 95% specificity criterion that has been employed to define the different clusters of histological appearance. The clus-ter assignments according to texture profiles obtained by color tissue segmentation are free from such misclassifica-tions, suggesting that the color tissue segmentation algo-rithm may capture the texture features of image blocks more adequately than the grayscale tissue segmentation algorithm. While cancer-specific image blocks captured the malignant formations, the normal-specific blocks
Clusters of texture appearance using parameters collected via grayscale and color tissue segmentation algorithms Figure 8
characterized tissue characteristics that are lost with the development of cancer.
3.3 Guiding tissue sampling for tissue microarrays
High-density tissue microarray technology brings together rectangular tissue blocks from hundreds of different spec-imens [15,16]. While this allows examination of very large numbers of tissue blocks on a single slide, the degree at which the tissue blocks extracted from tumor tissue for production of tissue microarrays capture the full histolog-ical presentation of these tissues is not clear. In order to assess how completely the decisive histopathological
fea-tures are represented by the selected tissue blocks, we have measured the classification composition (N, C, G) of square tissue blocks of approximate size 1 cm2 placed at
the center of mass of the histology specimen and at the center of mass of the regions that are compositionally indicative of cancerous appearance over the nine histol-ogy slides of IDC in our dataset. The composition of the selected tissue blocks in terms of non-specific, cancer-spe-cific, and unstained regions as well as the coverage achieved of all cancer-specific regions on the histology slides are shown in Tables 4 and 5. For the purposes of this analysis, the cancer-specific regions were defined as those
Texture profiles of the normal-specific, cancer-specific, and non-specific tissue block clusters as measured using grayscale tissue segmentation
Figure 9
BMC Medical Imaging 2007, 7:2 http://www.biomedcentral.com/1471-2342/7/2
Table 1: Confusion matrix of normal-specific, cancer-specific, and non-specific image block clusters obtained using grayscale and color tissue segmentation algorithms.
grayscale segmentation color segmentation clusters
Clusters normal-specific cancer-specific non-specific total
normal-specific 10 0 62 72
cancer-specific 0 226 94 320
non-specific 11 122 1870 2003
Total 21 348 2026 2395
Texture profiles of the normal-specific, cancer-specific, and non-specific tissue block clusters as measured using color tissue segmentation
Figure 10
Identification of the normal-specific (shown in green), cancer-specific (shown in red), and non-specific (shown in yellow) appearance clusters on histology slides based on texture parameters computed using grayscale and color tissue segmentation algorithms
Figure 11
BMC Medical Imaging 2007, 7:2 http://www.biomedcentral.com/1471-2342/7/2
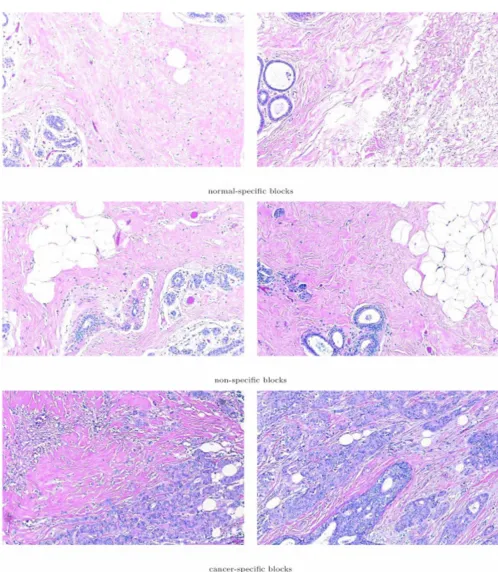
Sample image blocks of normal-specific, cancer-specific, and non-specific histological appearance clusters as identified simulta-neously based on texture parameters obtained from grayscale and color tissue segmentation algorithms
Figure 12
that are identified to be exclusive to cancerous appearance by either the grayscale tissue segmentation-based analysis or that based on color tissue segmentation.
The results in Table 4 indicate that when the 1 cm2 tissue
block is selected arbitrarily at the center of mass of a full histology slide, only about 22% is occupied by cancer-spe-cific regions on the average while almost half is occupied with unstained regions that are unworkable. Selecting the tissue block at the center of mass of cancer-specific regions significantly improves the average coverage of the cancer-specific regions, as shown in Table 5, but the coverage in cases where the malignancy appears spread out may still be poor, when only one or two blocks from the same tis-sue are included into the tistis-sue microarray.
4 Discussion
This study presents a high throughput analysis of texture heterogeneity on breast tissue images for the purpose of identifying regions of interest in the tissue for molecular profiling via tissue microarray technology. Image texture was described in terms of three parameters: the percentage of area occupied in an image block by chromatin (B), per-centage occupied by stroma like regions (P), and a
statis-tical heterogeneity index H commonly used in image
analysis. A typical whole section histology slide consisted of hundreds of image blocks comparable in size to tissue microarray spots. Texture parameters were defined and computed for each of the thousands of image blocks in
our dataset using both gray scale and color segmentation. The image blocks were then classified into three categories using the texture feature parameters in a novel statistical learning algorithm. These categories are as follows: image blocks specific to normal breast tissue, blocks specific to cancerous tissue, and those that are non-specific to nor-mal and disease states. Results indicated that both seg-mentation techniques were largely in agreement in classifying image blocks into the cancer-specific category. Moreover the image blocks identified as cancer-specific belonged to those cell crowded regions in whole section image slides that were already identified by pathologists as regions of interest for histological studies.
The statistical learning algorithm developed in this study was tested with success for three broad categories of tex-ture images observed in normal or diseased breast tissue. Validity of our automated method of identification of cancer- and normal-specific tissue image textures is yet to be illustrated on a large set of images gathered in a clinical trial study. The method presented is a first step towards automated identification of clinically relevant image tex-tures for cancer. It is expected that the method will require further refinement and improvement as it is challenged with tissue images gathered from a much larger pool of breast tumors that may contain images of a variety of non-neoplastic and pre-non-neoplastic conditions. Here, we have clearly demonstrated that given a set of learning texture images from histopathology, it is possible to recognize
Table 3: Confusion matrix between image block clusters identified following color tissue segmentation and the diagnostic category of the histology slides of origin.
tissue block histology slides of origin
Clusters normal cancerous total
normal-specific 21 0 21
cancer-specific 0 348 348
non-specific 1070 956 2026
Total 1091 1304 2395
Table 2: Confusion matrix between image block clusters identified following grayscale tissue segmentation and the diagnostic category of the histology slides of origin.
tissue block histology slides of origin
Clusters normal cancerous total
normal-specific 72 0 72
cancer-specific 4 316 320
non-specific 1015 988 2003
BMC Medical Imaging 2007, 7:2 http://www.biomedcentral.com/1471-2342/7/2
with very good accuracy similar textures in other histopa-thology images of breast tissue. Further improvements of the algorithm must include its adaptation to recognize texture images in a wide variety of tumor types. In the analysis of comprehensive image subsets involving differ-ent types of malignancy and/or tumors of differdiffer-ent organs, the parameter set used in this article (B, P, H) can readily be revised and enriched with additional texture parameters causing minimal change in the rest of the log-likelihood estimation algorithm.
The automated texture image recognition algorithm developed for this article can readily be adapted to the rec-ognition of additional histopathology textures. Incorpo-ration of new data in the learning procedure is both
possible and feasible: It only requires classifying them with respect to the reference sets used in randomized near-est neighbor classifications, and supplying the initial log-likelihood ratio estimates at the new data points to the support vector regression. As the amount of data incorpo-rated into the system after the initial training grows large, a re-estimation of the log-likelihood ratios with new near-est neighbor reference sets may be performed to maintain maximum fidelity to all available data.
5 Conclusion
Results of this study indicate the high efficiency of our automated method for identifying pathologic regions of interest on histology slides. Automation of critical region identification will help minimize the inter-rater
variabil-Table 5: Composition of 9.86 × 9.27 mm2 histology sections centered on the center of mass of the cancer-specific regions in the nine
cancerous histology slides in the dataset.
slide tissue composition
non-specific tissue (%) cancer-specific tissue (%) unstained region (%) cancer-specific tissue coverage (%)
1 11.11 24.44 64.44 100.00
2 22.22 28.89 48.89 97.50
3 34.07 38.52 27.41 41.94
4 15.56 11.85 72.59 100.00
5 37.78 36.30 25.93 96.08
6 37.04 31.85 31.11 91.49
7 25.93 22.22 51.85 51.72
8 22.96 15.56 61.48 53.85
9 40.74 17.04 42.22 76.67
mean 27.49 25.19 47.33 78.80
std 10.47 9.39 16.95 23.53
Table 4: Composition of 9.86 × 9.27 mm2 histology sections centered on the center of mass of the whole tissue slide in the nine
cancerous histology slides in the dataset.
slide tissue composition
non-specific tissue (%) cancer-specific tissue (%) unstained region (%) cancer-specific tissue coverage (%)
1 21.48 9.63 68.89 39.39
2 36.30 26.67 37.04 90.00
3 34.07 36.30 29.63 39.52
4 18.52 11.85 69.63 100.00
5 37.78 36.30 25.93 96.08
6 51.85 28.15 20.00 80.85
7 29.63 20.74 49.63 48.28
8 25.93 16.30 57.78 56.41
9 38.52 12.59 48.89 56.67
mean 32.67 22.06 45.27 67.47
ity among different raters (pathologists) as hundreds of tumors that are used to develop an array have typically been evaluated (graded) by different pathologists. The region of interest information gathered from the whole section images will guide the excision of tissue for high throughput profiling of global gene expression. Recent studies by Schuetz et al. [34], Yang et al. [35], and Murphy et al. [36] indicate the importance of choosing the tissue sample for global gene expression profiling via image assessment of tissue texture. These studies utilize the laser capture microdissection tool to dissect regions of interest assessed by pathologists via microscopic examination. The procedure developed in this article would automate this process and eliminate possible human eye bias affect-ing the resultant data on the levels of activation of nearly 40000 genes.
Our method will play a similarly positive role in sampling tissue for tissue microarrays [16,37,38]. These tissue chips consist of paraffin blocks in which up to several thousand separate tissue cores are assembled in array fashion to allow simultaneous analysis of biomarker presence and absence as well as their spatial distribution. The recent advances in nanotechnology employing quantum dots allow multiple biomarkers to be shown on the images of the same array [39,40] and therefore there is a need for normalizing fluorescence image distribution with factors such as the parameter B of the present study indicating the extent of chromatin presence in the image. The technique proposed here can also be utilized as an initial screening phase of an automated image analysis for which the sec-ond phase focuses on more advanced techniques evaluat-ing nuclei morphology [1,20-22,41] and/or the spatial arrangement of cell nuclei [23-25,42].
Competing interests
The author(s) declare that they have no competing inter-ests.
Authors' contributions
Authors BK and AT designed the study and drafted the paper. Both authors have read and approved the final manuscript.
Acknowledgements
This study was supported by the National Institute of Health Grant 232240 and by the National Science Foundation grant 235327 to A. Tözeren. The authors thank Dr. Jeffrey Hooke of Walter Reed Army Medical Center for providing the breast tissue histology used in this study and to Dr. Min Huang of Fox Chase Cancer Center for independently assessing the regions of interest in these slides.
References
1. Tavassoli F, Devilee P: Pathology and Genetics of Tumours: the Breast and Female Genital Organs World Health Organisation Classification of Tumours, IARC Press; 2003.
2. Sharifi-Salamatian V, Pesquet-Popescu B, Simony-Lafontaine J, Rigaut JP: Index for spatial heterogeneity in breast cancer. Journal of Microscopy 2004, 216:110-122.
3. Alexandrova R: Tumor heterogeneity. Experimental Pathology and Parasitology 2001, 4:57-67.
4. Kim NG, Roh JK, Kim JH, Chung WY, Park CS, Kim H: Clonality analysis using methylation-specific polymerase chain reac-tion: a novel method for investigating tumor clonality. Labo-ratory Investigation 1999, 79:1727-1729.
5. Unger MA, Rishi M, Clemmer VB, Hartman JL, Keiper EA, Greshock JD, Chodosh LA, Liebman MN, Weber BL: Characterization of adjacent breast tumors using oligonucleotide microarrays.
Breast Cancer Research 2001, 3:336-341.
6. Baisse B, Bouzourene H, Saraga EP, Bosman FT, Benhattar J: Intratu-mor genetic heterogeneity in advanced human colorectal adenocarcinoma. International Journal of Cancer 2001, 93:346-352. 7. Gonzalez-Garcia I, Sole RV, Costa J: Metapopulation dynamics and spatial heterogeneity in cancer. Proceedings of the NAtional Academy of Sciences of the USA 2002, 99:13085-13089.
8. Gorre ME, Mohammed M, Ellwood K, Hsu N, Paquette R, Rao PN, Sawyers CL: Clinical Resistance to STI-571 Cancer Therapy Caused by BCR-ABL Gene Mutation or Amplification. Sci-ence 2001, 293:876-880.
9. Fleuren GJ, Gorter A, Kuppen PJ, Litvinov S, Warnaar SO: Tumor heterogeneity and immunotherapy of cancer. Immunological Reviews 1995, 145:91-122.
10. van't Veer LJ, Dai H, de Vijver MJV, He YD, Hart AAM, Mao M, Peterse HL, van der Kooy K, Marton MJ, Witteveen AT, Schreiber GJ, Merkhoven RM, Roberts C, Linsley PS, Bernards R, Friend SH: Gene expression profiling predicts clinical outcome of breast can-cer. Nature 2002, 415:530-536.
11. Bertucci F, Houlgatte R, Benziane A, Granjeaud S, Adélaïde J, Tagett R, Loriod B, Jacquemier J, Viens P, Jordan B, Birnbaum D, Nguyen C:
Gene expression profiling of primary breast carcinomas using arrays of candidate genes. Human Molecular Genetics 2000,
9(20):2981-2991.
12. Liu ET: Classification of cancers by expression profiling. Cur-rent Opinion in Genetics & Development 2003, 13:97-103.
13. Camp RL, Charette LA, Rimm DL: Validation of tissue microar-ray technology in breast carcinoma. Laboratory Investigation 2000, 80:1943-1949.
14. Torhorst J, Bucher C, Kononen J, Haas P, Zuber M, Köchli OR, Mross F, Dieterich H, Moch H, Mihatsch M, Kallioniemi OP, Sauter G: Tis-sue microarrays for rapid linking of molecular changes to clinical endpoints. American Journal of Pathology 2001,
159:2249-2256.
15. LeBaron MJ, Crismon HR, Utama FE, Neilson LM, Sultan AS, Johnson KJ, Andersson EC, Rui H: Ultrahigh density microarrays of solid samples. Nature Methods 2005, 2:511-513.
16. LeBaron MJ, Rui H: Creating tissue microarrays by cutting-edge matrix assembly. Expert Review of Medical Devices 2005,
2:673-680.
17. Demir C, Yener B: Automated cancer diagnosis based on his-topathological images: a systematic survey. Tech. Rep. TR-05-09, Rennselaer Polytechnic Institute, Department Of Computer Science 2005.
18. Hoque A, Lippman SM, Boiko IV, Atkinson EN, Sneige N, Sahin A, Weber DM, Risin S, Lagios MD, Schwarting R, Colburn WJ, Dhingra K, Follen M, Kelloff GJ, Boone CW, Hittelman WN: Quantitative Nuclear Morphometry by Image Analysis for Prediction of Recurrence of Ductal Carcinoma in Situ of the Breast. Cancer Epidemiology, Biomarkers & Prevention 2001, 10:249-259.
19. Dreyer T, Doudkine A, Popella C: Nuclear shape and nuclear texture analysis in normal and neoplastic laryngeal epithe-lium. The First South-East European Symposium on Interdisciplinary Approaches in Fractal Analysis 2003:241-244.
20. Schmid K, Angerstein N, Geleff S, Gschwendtner A: Quantitative nuclear texture features analysis confirms WHO classifica-tion 2004 for lung carcinomas. Modern Pathology 2006,
19(3):453-459.
21. Roula MA, Bouridane A, Kurugöllü F, Amira A: A quadratic classi-fier based on multispectral texture features for prostate can-cer diagnosis. Seventh International Symposium on Signal Processing and its Applications 2003, 2:37-40.
Publish with BioMed Central and every scientist can read your work free of charge "BioMed Central will be the most significant development for disseminating the results of biomedical researc h in our lifetime."
Sir Paul Nurse, Cancer Research UK
Your research papers will be:
available free of charge to the entire biomedical community
peer reviewed and published immediately upon acceptance
cited in PubMed and archived on PubMed Central
yours — you keep the copyright
BMC Medical Imaging 2007, 7:2 http://www.biomedcentral.com/1471-2342/7/2
Breast Tissue From Fluorescent In Situ Hybridization Images. IEEE Transactions on Image Processing 2005,
14(9):1288-1299.
23. Todman A, Naguib RNG, Bennett MK: Visual Characterisation of Colon Images. Proceedings of Medical Image Understanding and Anal-ysis 2001:161-164.
24. Petushi S, Katsinis C, Coward C, Garcia F, Tözeren A: Automated identification of microstructures on histology slides. IEEE International Symposium on Biomedical Imaging: Macro to Nano 2004,
1:424-427.
25. Braumann UD, Kuska JP, Einenkel J, Horn LC, Löffler M, Höckel M:
Three-Dimensional Reconstruction and Quantification of Cervical Carcinoma Invasion Fronts From Histological Serial Sections. IEEE Transactions on Medical Imaging 2005,
24(10):1286-1307.
26. Kayser K, Radziszowski D, Bzdyl P, Sommer R, Kayser G: Towards an automated virtual slide screening: theoretical considera-tions and practical experiences of automated tissue-based virtual diagnosis to be implemented in the Internet. Diagnos-tic Pathology 2006, 1(10):.
27. Devijver PA, Kittler J: Pattern Recognition: A statistical approach London: Prentice Hall; 1982.
28. Duda RO, Hart PE, Stork DG: Pattern Classification Wiley-Interscience; 2000.
29. CIE: CIE Colorimetry: Official recommendations of the International Commission on Illumination. Tech. Rep. 15.2, International Commission on Illumination 1986.
30. Schwarz MW, Cowan WB, Beatty JC: An experimental compari-son of RGB, YIQ, LAB, HSV, and opponent color models.
ACM Transactions on Graphics 1987, 6(2):123-158.
31. Vapnik VN, Golowich SE, Smola A: Support vector method for function approximation, regression estimation and signal processing. Proceedings of Advances in Neural Information Processing Systems 9 1996:281-287.
32. Vapnik VN: Statistical Learning Theory Wiley; 1998.
33. Smola AJ, Schölkopf B: A tutorial on support vector regression Volume 14. Kluwer Academic Publishers; 2004:199-222.
34. Schuetz CS, Bonin M, Clare SE, Nieselt K, Sotlar K, Walter M, Fehm T, Solomayer E, Riess O, Wallwiener D, Kurek R, Neubauer HJ: Pro-gression-Specific Genes Identified by Expression Profiling of Matched Ductal Carcinomas In situ and Invasive Breast Tumors, Combining Laser Capture Microdissection and Oli-gonucleotide Microarray Analysis. Cancer Research 2006,
66:5278-5286.
35. Yang F, Foekens JA, Yu J, Sieuwerts AM, Timmermans M, Klijn JGM, Atkins D, Wang Y, Jiang Y: Laser microdissection and microar-ray analysis of breast tumors reveal ER- related genes and pathways. Oncogene 2006, 25:1413-1419.
36. Murphy N, Millar E, Lee CS: Gene expression profiling in breast cancer: towards individualising patient management. Pathol-ogy 2005, 37(4):271-277.
37. Battifora H: The multitumor (sausage) tissue block: novel method for immunohistochemical antibody testing. Labora-tory Investigation 1986, 55(2):244-248.
38. Kononen J, Bubendorf L, Kallionimeni A, Bärlund M, Schraml P, Leighton S, Torhorst J, Mihatsch MJ, Sauter G, Kallionimeni OP: Tis-sue microarrays for high-throughput molecular profiling of tumor specimens. Nature Medicine 1998, 4:844-847.
39. Kaul Z, Yaguchi T, Kaul SC, Wadhwa R: Quantum Dot-Based Pro-tein Imaging and Functional Significance of Two Mitochon-drial Chaperones in Cellular Senescence and Carcinogenesis. Annals of New York Academy of Sciences 2006,
1067:469-473.
40. Zhang C, Yeh SC, Kuroki M, Wang TH: Single Quantum Dot-Based DNA Nanosensor. Nature Materials 2005, 4(11):826-831. 41. Roula MA, Bouridane A, Kurugöllü F: An evolutionary snake
algo-rithm for the segmentation of nuclei in histopathological images. IEEE International Conference on Image Processing 2004,
1:127-130.
42. Demir C, Gültekin SH, Yener B: Learning the Topological Prop-erties of Brain Tumors. IEEE/ACM Transactions on Computational Biology and Bioinformatics 2005, 2(3):262-270.
Pre-publication history
The pre-publication history for this paper can be accessed here: