HELGOI.~NDER MEERESUNTERSUCHUNGEN Helgolander Meeresunters. 41, 69-82 (1987)
M a c r o b e n t h i c t u r n o v e r i n t h e s u b t i d a l W a d d e n Sea:
t h e N o r d e r a u e r e v i s i t e d after 60 y e a r s
K. Reise & A. Schubert
Biologische Anstalt Helgoland (Litoralstation); D-2282 List, FRG and
II. Zoologisches Institut und M u s e u m der Universit~t; Berliner Strafle 28, D-3400 GSttingen, FRG
ABSTRACT: The benthic macrofauna of a tidal inlet in the northern Wadden Sea was sampled with grab and dredge in 1924-1926 (Hagmeier & Ktindier, 1927), and again in 1985 and 1986. The comparison of surveys from consecutive years, as well as observations from an adjacent area, are employed to separate spurious from real long~term changes. Several epibenthic species of the 1920s became rare or absent in the 1980s. Oyster beds and reefs of the colonial polychaete Sabellaria spinulosa have disappeared completely. On the other hand, mussel beds have extended their range, and the abundance of mobile infauna has increased. The total number of species has remained approximately the same. Compared to surveys from consecutive years, the 60-year interval has doubled the species turnover rate, and has decreased the similarity in relative abundances by one third. The observed losses are best explained by the impact of dredging and trawhng on the benthic fauna, while gains seem to indicate coastal eutrophication.
I N T R O D U C T I O N
As part of a b e n t h i c effects-monitoring p r o g r a m m i n the G e r m a n North Sea, involv- i n g c o n t i n u o u s time series as well as c o m p a r i s o n s of discrete intervals, w e i n v e s t i g a t e d t h e s u b t i d a l m a c r o f a u n a of the n o r t h e r n W a d d e n Sea. T h e first q u a n t i t a t i v e descriptions of t h e m a c r o b e n t h o s i n the W a d d e n S e a w e r e provided i n the 1920s b y H a g m e i e r & K~indler (1927; hereafter: H & K). S a m p l i n g w a s d o n e m a i n l y i n two areas. O n e a r e a was the Lister Ley n e a r the i s l a n d of Sylt, the other the N o r d e r a u e b e t w e e n the i s l a n d s of F6hr a n d L a n g e n e s s .
In a n a t t e m p t to d o c u m e n t l o n g - t e r m c h a n g e s in the b e n t h i c fauna, w e reinvesti- g a t e d the Sylt a r e a in 1980 (Riesen & Reise, 1982). N a t u r a l oyster b e d s h a d all gone, p r e s u m a b l y b e c a u s e of o v e r e x p l o i t a t i o n . Reefs built b y the p o l y c h a e t e Sabellada spinul- osa stood i n t h e w a y of shrimp t r a w l i n g a n d w e r e destroyed. A subtidal Zostera marina b e d w a s w i p e d out i n 1934 b y a n e p i d e m i c disease, n e v e r to return. T h e s e losses affected v a r i o u s associated species. However, total species richness r e m a i n e d a b o u t the s a m e b e c a u s e m u s s e l b e d s s p r e a d i n the e n t i r e region, a n d m a n y p o l y c h a e t e species took a d v a n t a g e of this e x p a n s i o n .
o t h e r sites in 1926. By contrast, w e v i s i t e d all sites in 1985 a n d the s a m e sites in 1986. For d i r e c t c o m p a r i s o n , w e s e l e c t e d from this l a r g e r set of samples, t h e sites a n d y e a r s a s c h o s e n in t h e 1920s. T h e t h r e e s e p a r a t e sm-veys w e r e u s e d to d i f f e r e n t i a t e b e t w e e n a p p a r e n t a n d r e a l l o n g - t e r m c h a n g e s . T h e s p e c i e s t u r n o v e r o b s e r v e d b e t w e e n 1985 a n d 1986 is r e g a r d e d as s a m p l i n g error p l u s y e a r - t o - y e a r variability. S u b t r a c t i n g this r a t e from t h e one o b t a i n e d for t h e 6 0 - y e a r interval, m a y y i e l d a n e s t i m a t e of t h e r e a l l o n g - t e r m s p e c i e s t u r n o v e r .
A R E A A N D M E T H O D S
O b j e c t of i n v e s t i g a t i o n is t h e m a c r o b e n t h o s in t h e s u b t i d a l r e g i o n of t h e N o r d e r a u e , b e t w e e n t h e i s l a n d of FShr a n d H a l l i g L a n g e n e s s (Fig. 1). T h e N o r d e r a u e is a t i d a l i n l e t off t h e w e s t c o a s t of S c h l e s w i g - H o l s t e i n , F e d e r a l R e p u b h c of G e r m a n y . T h e c h a n n e l b e d h a s a d e p t h of u p to 22 m b e l o w low t i d e leveL-Tidal r a n g e is 2.8 m. M a x i m u m e b b a n d flow velocities a r e 1.35 a n d 1.25 m s -1, r e s p e c t i v e l y . Salinity v a r i e s b e t w e e n 29 a n d 32 Too, a n d w a t e r t e m p e r a t u r e b e t w e e n 0 ~ a n d 20 ~ w i t h a s u m m e r a v e r a g e of 15 ~ S e d i m e n t s a r e m o s t l y s a n d or m u d d y s a n d , o c c a s i o n a l l y w i t h s o m e gravel.
T h e a r e a w a s d e s c r i b e d a n d s a m p l e d b y H & K. T h e y p r o v i d e d d a t a from d r e d g i n g o y s t e r b e d s (see W, S a n d N in Fig. 1) in a u t u m n 1924, a n d from g r a b s a m p l e s ( P e t e r s e n g r a b of 75 k g a n d 0.1 m2), s i e v e d w i t h a 1-mm m e s h . F o n r s a m p l e s w e r e t a k e n from b e d
' ':" " ~!" !'ii::.
~ .
.
~"b."." "
.';~ ". : "-.:".
."~'::
"'-':: ' ' ~
(.}iii
.??i),
, . . .
".'
9':~...,:.-." ".":,:e '..- ;'i."-~ i "
..,~
~176
~176
9... C:'." ... "~--~Transect
... !~ ... !s """'~:'~'~':':":';'~";
...
~
... 0 m ELWS
....
6 m Depth
~ 2 1 . "
~k~" 1920s Oyster bed
I . . . . . . .
Fig. 1. Study area in the northern Wadden Sea between the island of F6hr and Hallig Langeness. Former oyster beds (dark shading) revisited: W -- Wyker Bank, S -- Schmaltiefskant, N -- NeBwatt,
M a c r o b e n t h i c t u r n o v e r in t h e W a d d e n S e a 71
W, a n d two from S/N, s o m e time b e t w e e n 1924 a n d 1926. A l o n g a t r a n s e c t b e t w e e n FShr (windmill in Wyk) a n d L a n g e n e s s (chapel), 21 s a m p l e s w e r e o b t a i n e d from 15 sites. A d e p t h profile is g i v e n w i t h s a m p l i n g sites, t y p e of s e d i m e n t , a n d c o n s p i c u o u s e p i f a u n a s c h e m a t i c a l l y i n d i c a t e d . This t r a n s e c t w a s s a m p l e d in Juli 1925 (10 sites) a n d J u n e 1926 (5 sites).
W e r e v i s i t e d all t h e s e s a m p l i n g sites, b o t h in A u g u s t 1985 a n d in J u n e 1986. T h e d r e d g e u s e d w a s of t h e s a m e t y p e ( b l a d e l e n g t h 1 m, m e s h size 60 ram, d r e d g i n g t i m e 10 min), w h i l e t h e g r a b w a s a v a n V e e n s a m p l e r (55 kg, 0.1 m2). In a c c o r d a n c e w i t h H & K, g r a b s a m p l e s of < 51 w e r e d i s c a r d e d . S i e v i n g w a s d o n e on b o a r d , a n d l i v i n g a n i m a l s w e r e p i c k e d u p from w h i t e dishes. S i x t e e n of t h e total of 27 g r a b s a m p l e s o b t a i n e d b y H & K a r e from 1925, 5 from 1926, a n d for 6 no e x a c t d a t e w a s given. W e t o o k 27 s a m p l e s in 1985, a n d t h e s a m e n u m b e r in 1986. To c o m p a r e t h e p e r i o d 1985-86 w i t h 1925-26, w e a l l o t t e d our s a m p l e s in t h e s a m e w a y as H & K did. F r o m the two sites w h e r e e x a c t d a t e s w e r e missing, w e a r b i t r a r i l y a p p o r t i o n e d 2 s a m p l e s (site S/N) to 1985 a n d 4 s a m p l e s (site W) to 1986.
S p e c i e s t u r n o v e r r a t e b e t w e e n s e p a r a t e s u r v e y s is e x p r e s s e d as T = (A+B)/(SA+SB). A is t h e n u m b e r of s p e c i e s w h i c h are p r e s e n t in t h e first s u r v e y b u t are a b s e n t in t h e s e c o n d one. B is t h e r e s p e c t i v e n u m b e r for t h o s e a b s e n t in t h e first b u t p r e s e n t in the s e c o n d survey. SA is t h e total n u m b e r of s p e c i e s f o u n d in the first a n d SB in t h e s e c o n d s u r v e y (see S c h o e n e r , 1983). This i n d e x is e q u i v a l e n t to "l-Qs w h e r e Qs is S o r e n s e n ' s i n d e x of similarity, b a s e d on p r e s e n c e - a b s e n c e data. Affinities b e t w e e n s u r v e y s are e x p r e s s e d w i t h R e n k o n e n ' s i n d e x R e = Z p ~ . Relative a b u n d a n c e s (fractions of 1) of s p e c i e s w i t h i n e a c h s u r v e y a r e c a l c u l a t e d , t h e n the l o w e r fraction of e a c h s p e c i e s (Ps) is chosen, a n d t h e s e a r e s u m m e d u p over t h e e n t i r e set of species.
RESULTS
H a b i t a t s t r u c t u r e
W e r e c o r d e d t h e d e p t h profile w i t h a n echo d e p t h sounder, a n d r e v i s i t e d sites a c c o r d i n g to r e l a t i v e position, d e p t h a n d t y p e of s e d i m e n t . T h e distribution of s e d i m e n t s w a s a b o u t t h e s a m e as in t h e 1920s, e x c e p t w h e r e m u s s e l s s h o w e d u p in 1985-86 b u t not in 1925-26. In t h e s e instances, t h e s e d i m e n t b e c a m e m o r e m u d d y . As m o r e m u s s e l b e d s w e r e p r e s e n t in 1985 t h a n in 1986, less sites c o n t a i n e d m u d in the s e c o n d y e a r .
1 9 2 5 - 2 6 " ~ ;
Langeness
i
1 0 0 0 m
. . . .
9 "..~ / ; " 9 9 M u s s e l b e d 9 ': z~ z~ O y s t e r b e d
~ o
9 1 ~ " Jl S a b e l l a r i a r e e f
l /
1 9 8 5 - 8 6 ~ / " , . . I n f a u n a
D D D D D D D D
D D r e d g e h a u l s ttt G r a b s a m p l e s
ttt t t t t t t t t t f t t t t tt t t t t t f
Fig. 2. Schematic presentation of macrobenthic distribution along a depth profile across the Norderaue (see transect in Fig. 1) in the 1920s and 1980s. Below, positions of sampling sites are
indicated
D r e d g e h a u l s
F o u r d r e d g e h a u l s t a k e n from o y s t e r b e d s in 1924 are c o m p a r e d to 4 h a u l s in 1985 a n d 4 in 1986 from t h e r e s p e c t i v e sites (Table 1). E x p r e s s e d in t e r m s of p r e s e n c e - a b s e n c e of t a x a p e r haul, d r e d g i n g w a s o n l y half as successful in t h e 1980s c o m p a r e d to 1924 (see ' s u m of c o n s t a n c y v a l u e s ' in T a b l e 1). C o n s t a n c y v a l u e s d e c l i n e d in 13 taxa, r e m a i n e d a b o u t e q u a l in 10, a n d i n c r e a s e d o n l y in 2.
T h e t u r n o v e r r a t e s of t a x a a r e 0.35 a n d 0.41 w h e n d r e d g i n g s of 1924 a r e c o m p a r e d w i t h 1985 a n d 1986. F o r t h e 2 c o n s e c u t i v e years, t h e t u r n o v e r r a t e is o n l y 0.19. This m a y b e r e g a r d e d as a m e a s u r e of s a m p l i n g error p l u s the n o r m a l y e a r - t o - y e a r v a r i a b i l i t y (see ' p s e u d o t u r n o v e r ' in N i l s s o n & Nilsson, 1983). S u b t r a c t i n g the l a t t e r from t h e former, g i v e s a n e s t i m a t e of 16 to 22 % for t h e r e a l l o n g - t e r m t u r n o v e r rate.
G r a b s a m p l e s
M a c r o b e n t h i c t u r n o v e r i n t h e W a d d e n S e a 73
Table 1. Constancy (expressed in ranks 0 to 4) of benthic invertebrates d r e d g e d from 4 sites in the Norderaue, in 1924 {H & K: p. 44), in 1985 a n d 1986. A = Anthozoa, B = Bivalvia, Br -- Bryozoa, D = Decapoda, E = Echinodermata, G = Gastropoda and Polyplacophora, H = Hydrozoa, P =
Polychaeta, Po = Porifera
Year of survey 1924 1985 1986
Decrease in constancy
B Ostrea eduh's L. 4 0 0
P Sabellaria spinulosa (clumps) 4 0 0
P Nereis pelagica L. 4 0 0
H Sertularia cupressina L. 3 0 0
A Urticina felina (L.) 3 0 0
D Liocardnus holsatus (Fabr.) 3 0 0
P Pomatoceros triqueter (L.) 2 0 0
H E u d e n d f i u m rameurn Pallas 2 0 0
A Sagartiogeton undatus (Miiller) 2 0 0
Po Halichondria panicea (clumps) 4 I 1
D Hyas araneus (L.) 4 1 1
E Psammechinus miliaris (Gmelm) 4 0 1
P Polynoidae 4 2 0
Similar constancy
G Buccium undatum L. 4 3 3
E Asterias rubens L. 4 4 4
D Pagurus bernhardus L. 4 4 4
Br Alcyonidium gelatinosum (L.) 3 2 4
A Metridium senile (L.) 3 3 3
D Carcinus maenas (L.) 3 4 4
G Lepidochitona cinerea (L). 1 1 2
H Tubulafia inch'visa L 2 1 0
G Crepidula fornicata (L.) 0 1 1
P Lanice conchilega (Pallas) 0 1 0
Increase in constancy
G Littorina littorea (L.) 0 1 3
B Mytilus edulis L. 2 4 3
Sum of constancy values 69 33 34
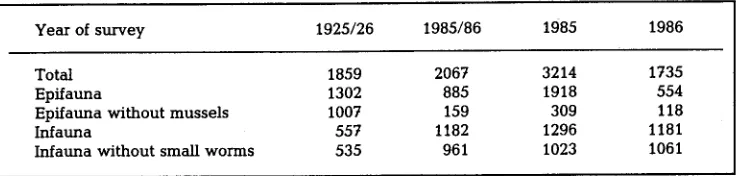
Table 2. A b u n d a n c e (individuals below 2.7 m 2) of epifaunal a n d infaunal m a c r o z o o b e n t h o s (barnacles a n d colonial forms excluded) in the Norderaue, 1920s a n d 1980s. The values given for 1985/86 are not calculated averages, but are from selected samples of the two years according to the
sampling d e s i g n a d o p t e d by H & K in 1925 a n d 1926
Year of survey 1925/26 1985/86 1985 1986
Total 1859 2067 3214 1735
Epffauna 1302 885 1918 554
E p f f a u n a w i t h o u t m u s s e l s 1007 159 309 118
Infauna 557 1182 1296 1181
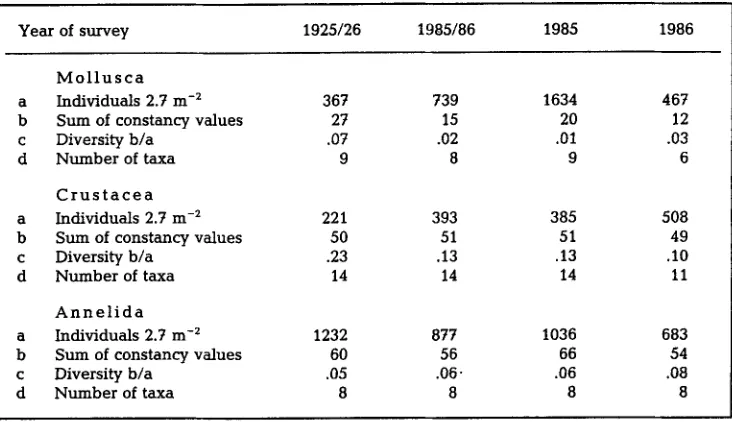
Table 3. Numerical characteristics Of major macrozoobenthic taxa from 17 sites (2.7 m 2} in the Norderaue area, sampled in 1925/26, in 1985 and 1986. Constancy refers to the number of sites (0 to 17). Species identification of armelids is -incomple.te (cf. H & K). Consult also legend of Table 2
Year of survey 1925/26 1985/86 1985 1986
M o l l u s c a
a Individuals 2.7 m -2 367 739 1634 467
b Sum of constancy values 27 15 20 12
c Diversity b/a .07 .02 .01 .03
d Number of taxa 9 8 9 6
C r u s t a c e a
a Individuals 2.7 m -2 221 393 385 508
b Sum of constancy values 50 51 51 49
c Diversity b/a .23 .13 .13 .10
d Number of taxa 14 14 14 11
A n n e l i d a
a Individuals 2.7 m -2 1232 877 1036 683
b Sum of constancy values 60 56 66 54
c Diversity b/a .05 .06- .06 .08
d Number of taxa 8 8 8 8
With r e g a r d to t h e three major taxa, molluscs, c r u s t a c e a n s a n d a n n e l i d s , t h e r e are n o c o n s p i c u o u s differences in a b u n d a n c e or in the n u m b e r of taxa b e t w e e n t h e years i n q u e s t i o n (Table 3). Diversity is e x p r e s s e d as the s u m of i n d i v i d u a l s d i v i d e d b y the s u m of c o n s t a n c y v a l u e s i n order to c o m b i n e a s p e c t s of d o m i n a n c e , species r i c h n e s s a n d spatial e v e n n e s s i n a single p a r a m e t e r . This i n d e x attains h i g h e s t v a l u e s for the p e r i o d 1925-26 i n molluscs a n d c r u s t a c e a n s . T h e s e taxa w e r e a n a l y s e d to the species l e v e l b y H & K. In a n n e l i d s , o n l y a few species w e r e listed separately.
W h e n t h e a b u n d a n c e a n d c o n s t a n c y of species i n the 1920s a n d 1980s a r e c o m p a r e d , t h e r e are r a r e l y similarities (Table 4). A n o t a b l e exception is t h e p o l y c h a e t e Scoloplos armiger. C o m m o n i n 1925--26 b u t rare or a b s e n t in 1985-86 are the s e a a n e m o n e Sagartiogeton viduata, the tellinid clam Abra alba, the r e e f - b u i l d i n g p o l y c h a e t e Sabellaria spinulosa, a n d the a m p h i p o d s Cheirocratus sundevalli a n d Phoxocephalus holb611i. C o m m o n i n 1985-86 b u t rare or a b s e n t 60 years e a r h e r are the m u s s e l Mytilus edulis, p h y l l o d o c i d p o l y c h a e t e s (mainly Anaitides maculata a n d Eulalia viridis), Nereis virens, s m a l l e r polychaetes, a n d the a m p h i p o d Bathyporeia sarsi. The latter w a s p r o b - a b l y i n c l u d e d u n d e r B. pflosa i n the 1920s {see l e g e n d of T a b l e 5).
T h e s e c h a n g e s r e s u l t i n a high t u r n o v e r rate of the taxa w h e n t h e t w o p e r i o d s a r e c o m p a r e d (Table 5). A n estimate for the real l o n g - t e r m t u r n o v e r rate m a y b e o b t a i n e d b y s u b t r a c t i n g t h e 1985-86 rate from the 1925/26-1985/86 rate. This yields a t u r n o v e r of 16 % of all taxa. Affinity b e t w e e n surveys is e x p r e s s e d with R e n k o n e n ' s i n d e x w h i c h m e a s u r e s similarity m a i n l y i n terms of the d o m i n a n t species. C o m p a r e d to the two c o n s e c u t i v e years, the 60-year i n t e r v a l causes a r e d u c t i o n of similarity b y 33 % (cf. 0.6 with 0.4 i n T a b l e 5).
M a c r o b e n t h i c t u r n o v e r i n t h e W a d d e n S e a 75
Table 4. Macrofauna (> 1 ram) obtained from 17 sites in the Norderaue in 1925-26 (H & K: pp. 28, 37, 41) a n d in 1985-86. A b u n d a n c e refers to 2.7 m 2 a n d constancy to the n u m b e r of sites (0 to 17); +
p r e s e n t b u t not counted
Year of survey 1925-26 1985--86 1925-26 1985-86
A b u n d a n c e Constancy
C o e l e n t e r a t a
Sagarliogeton undatus (M/iUer)
Sagar~'a troglodytes (Price)
Metridium senile (L.)
Hydroid colonies
Alcyonidium sp.
Nemertini
M o l l u s c a
Abra alba (S. Wood)
Venerupis pullastra (Montagu)
h4acoma balthica (L.)
Tellina fabula Gmelin
Mya sp. (~uv.)
Myttlus edulis L.
Petricola pholadi[ormis Lamarck
Buccinum undatum L.
Ensis directus (Conrad)
Littorina fittorea (L,)
iepidochitona cinerea (L.)
A n n e l i d a
Sabeflafia spinulosa Leuckart
Polynoidae (5 spp.)
Nereis pelag~ca L.
Nereis virens Sars
Nephtys (3 spp,)
Ophefia limacina (Rathke)
Scoloplos armiger (Miiller)
Phyllodocidae (3 spp.)
Lanice conchilega (Pallas)
Small A n n e l i d a (13 spp.)
C r u s t a c e a
Balanus crenatus Brugui~re
Cheirocratus sundevalli (Rath.)
Phoxocephalus holbOlli (Kr6yer)
Paramphitoe bicuspis (KrSyer)
G a m m a r u s 1ocusta (L.)
G a m m a r u s salinus Spooner
Bathyporeia pilosa [indstr6m
Bathyporeia pelagica (Bate)
Bathyporeia sarsi Watkin
Podoceropsis nitida (Stimpson)
Corophium crassicome Bruzelius
Corophiurn volutator (Pallas)
Pontocrates arenafius (Bate)
18 1 8 1
0 6 0 4
18 36 2 6
+ + 5 5
0 + 0 5
0 7 0 3
31 0 9 0
4 0 3 0
4 1 4 1
1 0 1 0
1 1 1 1
295 726 2 6
14 3 2 2
10 2 3 2
0 3 0 i
0 2 0 I
7 1 2 I
853 0 9 0
77 21 11 3
1 0 1 0
1 114 1 7
17 14 11 6
0 5 0 2
248 285 12 9
13 171 7 10
0 46 0 5
22 221 8 14
+ + 8 7
78 0 6 0
30 2 5 1
3 0 1 0
2 0 2 0
0 46 0 4
1 0 1 0
77 123 3 7
0 104 0 10
1 0 1 0
2 0 2 0
0 22 0 3
Table 4 (Contd)
Year of survey 1925-226 1985-86 1925-26 1985-86
Abundance Constancy
C r u s t a c e a (contd)
Bodotria scorpioides (Montagu)
Gastrosaccus spinifer Goes
Crangon crangon (L.)
Liocarcinus holsatus (Fabr.)
Carcinus rnaenas (L.)
Hyas araneus (L.)
Pagurus bernhardus L.
Pycnogonum fitorale StrSm.
Psamrnechinus miliaris (Gmelin)
Asterias rubens L.
5 3 4 2
2 3 2 2
10 13 6 2
0 2 0 2
4 54 4 5
0 15 0 2
6 4 5 2
2 0 1 0
2 0 2 0
0 8 0 3
Table 5. Turnover rate of taxa based on presence-absence, and similarity based on relative abundances, between macrozoobenthic surveys of the Norderaue in the 1920s and 1980s. Calcu- lated from Table 4. The species Bathyporeia sarsi Watldn, 1938 and Gammarus salinus (Spooner, 1947) had not yet been erected in the 1920s. For calculations, the former is assembled to B. pilosa
and the latter to G. locusta
Surveys compared 1925/26- 1985-1986 1925/26- 1925/26-
1985/86 1985 1986
T u m o v e r r a t e .32 .16 .33 .35
Renkonen's similarity .40 .60 .32 .41
for t h e e n t i r e s p e c t r u m of species e n c o u n t e r e d in t h e 1920s a n d 1980s. T h e t u r n o v e r b e t w e e n 1985 a n d 1986 is 0.13. T h e o n e for t h e 6 0 - y e a r i n t e r v a l is 0.26. By s u b t r a c t i o n , a r e a l l o n g - t e r m t u r n o v e r of 13 % of t h e t a x a is o b t a i n e d .
D I S C U S S I O N
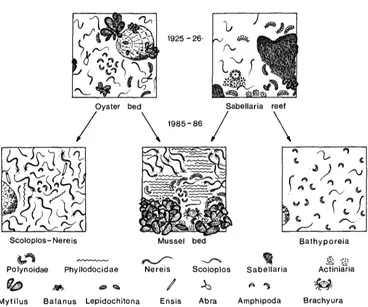
T w o major assemblages of the 1920s, oyster beds and Sabellaria reefs, are gone from the Norderaue area. Oyster beds are n o w either occupied by mussel beds or by an assemblage rich in polychaetes (Fig. 3). T h e sites of former Sabellaria reefs m a y also be
occupied by mussels or by an assemblage of sand-dweUing amphipods (Bathyporeia
spp.).
Consistency of evidence
M a c r o b e n t h i c t u r n o v e r in t h e W a d d e n S e a
77
1,9 5- 8.
Oyster bed
X
1985-86
-~'~.'- ~
Sabellaria reef
/
\
Scoloplos- Nereis
Polynoidae Phyllodocid ae
Mytilus Balanus
Mussel bed
Nereis
-Scoloplos Sabellaria
Lepidochitona
Ensis
Abra
Amphipoda
Bathyporeia
Actiniaria
Brachyura
Fig. 3. Oyster beds and Sabellaria reefs of the 1920s were substituted within 60 years by mussel beds, a polychaete assemblage, or an amphipod assemblage. Number of symbols reflects abun-
dance
c o m b i n i n g t h e l o n g - t e r m c o m p a r i s o n with a s h o r t - t e r m one to d i f f e r e n t i a t e b e t w e e n r e a l a n d s p u r i o u s differences, a n d (3) b y s t u d y i n g l o n g - t e r m c h a n g e s in a d j a c e n t r e g i o n s a n d r e s t r i c t i n g t h e c o n c l u s i o n s to t h e c o n s i s t e n t o b s e r v a t i o n s .
If a n y r e a l l o n g - t e r m c h a n g e s occurred, t h e n t h e f a u n a s a m p l e d in d i s t a n t y e a r s m u s t s h o w less similarity a n d a h i g h e r d e g r e e of s p e c i e s t u r n o v e r t h a n t h e f a u n a from c o n s e c u t i v e y e a r s . This is c l e a r l y t h e c a s e in t h e p r e s e n t study. A t t h e s p e c i e s level, t h e s a m e l o n g - t e r m t r e n d m u s t b e a p p a r e n t in b o t h c o n s e c u t i v e years, if it is to b e r e g a r d e d as r e h a b l e . F o r e x a m p l e in 1925--25, only 4 s h o r e c r a b s w e r e f o u n d b e l o w 2.7 m 2. In 1985, w e f o u n d 100 b u t o n l y 6 in 1986. C o n s i s t e n c y is l a c k i n g a n d t h e r e f o r e e v i d e n c e is insufficient for a l o n g - t e r m c h a n g e in t h e a b u n d a n c e of C a r c i n u s m a e n a s .
The general trends are the same in both areas, and there is also a close correspond- ence on the species level. Oyster beds and Sabellaria reefs vanished, while mussel beds e x p a n d e d and infaunal density increased. The total number of species remained approx- imately the same. In the 1920s, Sertularia cupressina, Sagartiogeton undatus, Lepidochitona cinerea, Ostrea edulis, Abra alba, Venerupis pullastra, Sabeflaria spinul- osa, Cheirocratus sundevalli and Psarnmechinus miliaris were common in both areas. In the 1980s, these species were rare or absent, again in both areas. Vice versa, Mytilus edulis, Nereis virens, phyllodocid and other polychaetes, and Bathyporeia sarsi became consistently more numerous in the 1980s.
Discrepancies are few. Increased abundances of polynoid polychaetes and of the cockle Cerastoderrna edule in the Lister Ley could not be confirmed in the Norderaue, and an increased abundance of Lanice conchflega in the Norderaue did not occur in the Lister Ley. Species not found in both areas constitute less reliable evidence for a long- term trend.
T u r n o v e r of e p i f a u n a l s p e c i e s
Species lists and relative abundances of the epifauna on the oyster beds of the North Prisian Wadden Sea are provided by M6bius (1893} for the period 1869 to 1891, by Hagmeier & Kandler (1927} for the 1920s, and by Hagmeier {1941} for the 1930s. Apparently, there occurred no conspicuous changes throughout this time span, except for the ongoing decline of the oyster population. According to KrSyer (1837, cited in H & K}, the population size of Ostrea edulls in the Wadden Sea between the Eiderstedt peninsula in the south and the SkaJJingen peninsula in the north, started to decrease around 1800. A very drastic decline is well documented for the late 1870s (H & K; MSbius, 1877; Reise, 1980).
During an official revision in 1924 and 1925, an average of 3.4 oysters per dredge haul was obtained from the beds in the Norderaue (W, S and N in Fig. 1). The annual yield from these beds for the period 1910 to 1923 was approximately 97,000 oysters. According to revisions in 1932 and 1939, the average per haul was only 1.5 oysters (Hagmeier, 1941). The last record is from 1940. Two hauls were taken on b e d W and one oyster was caught. Similarly, for other parts of the northern Wadden Sea there are no later records than 1940. Presumably, Ostrea edulis became extinct in the entire region in the 1940s or 1950s.
M6bius (1877} blames the fishery for the decline in the 1870s. H & K suggest that this overexploitation diminished the number of spawners to such an extent that the popula- tion was unable to persist under the current climatic conditions. This a r g u m e n t implies that oysters became established in the Wadden Sea when the climate was different. Once established, the strong population was able to resist all changes until the fishery responded more to the market than to the stock size of the oysters. At the beginning of this century, attempts were made to restock the natural beds with imported oysters. For example, bed W was restocked with 50 000 Dutch oysters in 1925. This and all other attempts failed (Hagmeier, 1941; Hagmeier & Schubert, 1930; Kandler, 1928}.
M a c r o b e n t h i c t u r n o v e r in t h e W a d d e n S e a 79
g r o w t h on b e d s S, N a n d in t h e n o r t h e r n p a r t of W. Up to 300 d u m p s in a s i n g l e h a u l w e r e r e c o r d e d ( H a g m e i e r , 1941}. In 1932, H. panicea w a s still s u p e r a b u n d a n t in the N o r d e r a u e b u t b e c a m e less c o n s p i c u o u s in 1939. W e f o u n d this s p o n g e only in the n o r t h e r n p a r t of W: 4 d u m p s in 1985 a n d 2 c l u m p s in 1986.
Sabellaria c l u m p s w e r e r e c o r d e d from all b e d s in t h e N o r d e r a u e in 1924. T h e m a s s i v e reefs o c c u r r e d m a i n l y b e l o w t h e d e p t h r a n g e of t h e o y s t e r b e d s ( > 5 m b e l o w LTL). A d r e d g e w a s i m m e d i a t e l y filled w i t h d u m p s of a g g l u t i n a t e d t u b e s . T r a w l i n g w a s i m p o s s i b l e . In t h e 1980s, w e f o u n d no reefs a n d no living w o r m s , only a few s m a l l d u m p s w i t h e m p t y t u b e s . W i t h this s p e c i e s a m a j o r h a b i t a t is gone. T h e reefs h a v e b e e n g r o u n d w i t h h e a v y g e a r b y t h e s h r i m p fishery (Riesen & Reise, 1982).
T h e t u b e - b u i l d i n g p o l y c h a e t e Pomatoceros triqueter l i v e d on s h e l l s of o y s t e r b e d W in 1924. In 1939 it w a s q u i t e c o m m o n a n d w a s also f o u n d on b e d S / N ( H a g m e i e r , 1941). In t h e 1980s w e f o u n d none. T h e colonial h y d r o i d Sertularia argentea w a s f o u n d on all o y s t e r b e d s in t h e 1920s a n d 1930s. In t h e 1980s w e f o u n d none. This h y d r o i d w a s u s e d for d e c o r a t i v e p u r p o s e s a n d w a s c o m m e r c i a l l y h a r v e s t e d in t h e 1950s. T h e s e a u r c h i n Psammechinus miliaris w a s q u i t e c o m m o n on the o y s t e r b e d s . In 1924, 14 to 20 urchins w e r e o b t a i n e d w i t h a s i n g l e haul. In t h e 1930s, P. m///ar/s w a s p a r t i c u l a r l y a b u n d a n t on b e d S / N ( H a g m e i e r , 1941). W e f o u n d o n l y 4 urchins in a s i n g l e h a u l o n b e d S in 1986. T h e A m e r i c a n p r o s o b r a n c h Crepidula fornicata w a s i n t r o d u c e d w i t h D u t c h o y s t e r s in 1934 at Sylt a n d p r e s u m a b l y in 1936 into t h e N o r d e r a u e ( H a g m e i e r , 1941}. W e f o u n d o n e snail o n b e d W, b o t h in 1985 a n d 1986.
In t h e 1920s, m u s s e l b e d s w e r e r e s t r i c t e d to t h e s h a l l o w s (<2 m) a b o v e t h e o y s t e r b e d s . O c c a s i o n a l l y , h o w e v e r , m u s s e l s s e t t l e d w i t h i n t h e o y s t e r b e d s , a t t a c h e d to the shells, a c c u m u l a t e d silt, a n d the oysters d i e d (H & K}. O n b e d s W, S a n d N, y o u n g m u s s e l s w e r e f o u n d in 1925 a n d 1926. In A p r i l 1927, a g r a b of 0.1 m 2 c o n t a i n e d 42 m u s s e l s ( H a g m e i e r , 1941}. In 1932 t h e s e m u s s e l s w e r e g o n e b u t a h e a v y spatfall w a s o b s e r v e d on t h e n o r t h e r n p a r t of b e d W in 1940. Bed S a n d N r e m a i n e d free of mussels. In t h e 1980s w e f o u n d m u s s e l s d i s t r i b u t e d o v e r t h e e n t i r e d e p t h r a n g e of t h e N o r d e r a u e . T h e y w e r e c o n s i d e r a b l y m o r e c o m m o n t h a n in t h e 1920s. This w a s m o r e o b v i o u s in 1985 t h a n in 1986. At t h e s a m e time, a p r o s p e r i n g m u s s e l fishery i n t e n s i f i e d t h e e x p l o i t a t i o n of t h e n a t u r a l b e d s .
I n t e r p r e t a t i o n o f f a u n a l c h a n g e s
Six h y p o t h e s e s a r e d i s c u s s e d as p o t e n t i a l e x p l a n a t i o n s for t h e o b s e r v e d l o n g - t e r m c h a n g e s in t h e b e n t h i c f a u n a of the N o r d e r a u e . T h e s e h y p o t h e s e s do not e x c l u d e e a c h other, t h e y a r e a d d i t i v e a n d m a y interact.
(I) H y p o t h e s i s o f n a t u r a I c h a n g e : All d i f f e r e n c e s in f a u n a l c o m p o s i t i o n b e t w e e n t h e 1920s a n d 1980s a r e c a u s e d b y n a t u r a l p r o c e s s e s alone, s u c h as climatic variation, species extending and retracting their ranges, unbalanced predator-prey-
pathogen relations. In such a case, there will be no conspicuous changes in overall
abundance and species richness, nor in the relation between functional groups or life
forms. C h a n g e s are apparent only at the species level. This prediction does not hold.
Conspicuous losses are confined to the epifauna, and the infauna shows an overall
increase in abundance. S o m e events, however, m a y be due to natural causes. A
trends and population oscillations with periods of several years or more. Natural long- term cycles are expected to occur in the marine environment (Gray & Christie, 1983; Steele, 1985), and this imposes a dose of uncertainty on any conclusions.
(2) H y p o t h e s i s o f c h a n g e d p r e d a t i o n : Benthic a b u n d a n c e follows the fluctuations of predation pressure by decapod crustaceans, demersal fish and diving ducks. Shrimp, small crabs and fish, prey fairly indiscriminately on early bottom stages, causing an overall decline in the benthic community (Reise, 1985). Adult crabs, starfish and diving ducks particularly affect the bivalves. H & K present the catch of 19 trawls taken from oyster beds in the 1920s. The relative abundances in catch and by-catch resemble those of the 1970s (cf. Dankers & de Veen, 1978: Table 3). Tiews (1983) analysed the catch and by-catch of the shrimp fishery for the period 1954 to 1981. Cod, dab, plaice and a few other fish increased in the 1970s, and shrimp also show a slightly increasing trend over the years in the Wadden Sea of Schleswig-Holstein. If at all, this suggests an increased predation pressure on the benthos, which is inconflict with the observed high infaunal abundance in the 1980s. Mussels are preyed u p o n by eider ducks. This latter population has not declined in recent years (Swennen, 1980), and thus provides no explanation for the spread of mussels.
(3) H y p o t h e s i s o f t o x i f i c a t i o n : Industrial pollutants accumulate in the benthos and cause a general impoverishment, decreased abundance and loss of species. Large and long-lived forms probably suffer more than small and rapidly breeding species. Toxic pollutants cannot be blamed for the observed changes because losses occurred only in the epifauna.
(4) H y p o t h e s i s o f o r g a n i c e n r i c h m e n t : Nutrients from agricultural runoff and h u m a n communities stimulate primary production, and more food becomes available for the benthic fauna. Abundances will increase, and species characteristic of m u d d y sediments will spread. Organic enrichment may eventually cause oxygen deficiencies; however, in a tidal water body with high current velocities this is only to be expected under extreme eutrophication.
Enhanced organic input and primary production provide a plausible explanation for the concurrent increase in mussels and infauna. Mussel abundance also increased in the eutrophicated Baltic Sea (Brey, 1986; Cederwall & Elmgren, 1980; but cf. Persson, 1981). Increased polychaete abundance may be a direct response to organic enrichment (Anger, 1977; Dauer & Conner, 1980; Dorsey, 1982) or to the spread of mussels (Kaspar et al., 1985; Mattson & Lind6n, 1983; Riesen & Reise, 1982). Evidence for coastal eutrophication in northern Europe is accumulating (Rosenberg, 1985), and long-term changes in the benthos of the Kattegat are also in line with this interpretation (Pearson et al., 1985).
(5) H y p o t h e s i s o f d r e d g i n g a n d t r a w l i n g e f f e c t s : From the Nor- deraue, gravel and sand are extracted. Dredges were used to collect oysters and are used to harvest mussels. Shrimp trawling is very common. All these disturbances particularly affect the epifauna and some sessile and fragile infauna (Blegvad, 1951; de Groot, 1984). The loss of epifaunal species and of infaunal bivalves in the Norderaue, suggests that dredging and trawling had some effects. Sabellaria reefs were destroyed by the shrimp fishery (Riesen & Reise, 1982).
M a c r o b e n t h i c t u r n o v e r in t h e W a d d e n S e a 81 starfish a n d crabs w e r e r e m o v e d ; shells w e r e c l e a n e d to p r o v i d e s u i t a b l e s p a c e for t h e a t t a c h m e n t of o y s t e r s p a t (H & K). This a t t e n d a n c e m a y h a v e c o n t r i b u t e d to t h e p e r s i s t e n c e of t h e oyster b e d c o m m u n i t y .
T h e m u s s e l fishery transplants y o u n g , c r o w d e d m u s s e l s from t h e shallows w h e r e initial s u r v i v a l is high, to d e e p e r sites w h e r e m u s s e l s s p r e a d a n d g r o w faster (H & K~ Korringa, 1980). This m a y h a v e p r o m o t e d the e x p a n s i o n of m u s s e l b e d s o v e r t h e entire d e p t h r a n g e of t h e N o r d e r a u e . H o w e v e r , m u s s e l fishery w a s r a t h e r e x t e n s i v e o v e r t h e last d e c a d e s a n d i n t e n s i f i e d only v e r y r e c e n t l y in t h e n o r t h e r n W a d d e n Sea. It d o e s not s e e m v e r y p r o b a b l e t h a t t h e g e n e r a l s p r e a d of m u s s e l s w a s possible w i t h o u t a d d i t i o n a l food.
W i t h o u t a n y r e f e r e n c e areas, w h e r e n e i t h e r fishery nor a n y o t h e r e x p l o i t a t i o n s are a l l o w e d , it will b e i m p o s s i b l e to differentiate b e t w e e n t h e last t h r e e h y p o t h e s e s . N o n e is c o m p r e h e n s i v e e n o u g h to e x p l a i n a l o n e all t h e o b s e r v e d l o n g - t e r m c h a n g e s in t h e b e n t h o s of t h e N o r d e r a u e . W e c o n c l u d e that a c o m b i n a t i o n of coastal e u t r o p h i c a t i o n , fishery a n d d r e d g i n g effects c a u s e d t h e s p r e a d of mussels, the i n c r e a s e of i n f a u n a l a b u n d a n c e , a n d t h e loss of e p i f a u n a l species.
Acknowledgements. We thank N. Kruse and P. Elvert of R.V. "Mya'" for skillful assistance in
sampling the benthic fauna. Dr. H. J. Aurich helped with old hterature.
LITERATURE CITED
Anger, K., 1977. Benthic invertebrates as indicators of organic pollution in the western Baltic Sea. - Int. Revue ges. Hydrobiol. 62, 245-254.
Blegvad, H., 1951. Fluctuations in the amounts of food animals of the bottom of the Limfjord in 1928-1950. - Rep. Dan. biol. Stn 53, 3-16.
Brey, T., 1986. Increase in macrozoobenthos above the halocline in Kiel Bay comparing the 1960s with the 1980s. - Mar. Ecol. Prog. Set. 28, 299-302.
Cederwall, H. & ELmgren, R., 1980. Biomass increase of benthic macrofauna demonstrates eutrophi- cation of the Baltic Sea. - Ophelia (Suppl.) 1, 287-304.
Dankers, N. M. J. A. & Veen, J. F. de, 1978. Variations in relative abundance in a number of fish species in the Wadden Sea and the North Sea coastal areas. In: Fishes and fisheries of the Wadden Sea. Ed. by N. Dankers, W. J. Wolff & J. J. Zijlstra. Balkema, Rotterdam 77-105. (Rep. Wadden Sea Working Group. 5.)
Dauer, D. M. & Conner, W. G., 1980. Effects of moderate sewage input on benthic polu populations. - Estuar. coast, mar. Sd. I0, 335-346.
Dorsey, J. H., 1982. Intertidal community offshore from the Werribee sewage-treatment farm: an opportunistic infaunal assemblage. - Aust. J. mar. Freshwat. Res. 33, 45-54.
Gray, J. S. & Christie, H., 1983. Predicting long-term changes in marine benthic communities. - Mar. Ecol. Prog. Set. 13, 87-94.
Groot, S. J. de, 1984. The impact of bottom trawling on benthic fauna of the North Sea. - Ocean Managem. 9, 177-190.
Hagmeier, A., 1941. Die intensive Nutzung des nordfriesischen Wattenmeeres durch Austere- und Muschalkultur. - Z. Fisch. 39, 105-165.
Hagmeier, A. & Kfindler, R., 1927. Neue Untersuchungen im nordfriesischen Wattenmeer und auf den fiskalischen Austernb/inken. - Wiss. Meeresunters. (Helgoland) 15, 1-90.
Hagmeier, A. & Schubert, A., 1930. Untersuchungen fiber die Biologic der Auster. Nr. 4. Die Austernbrut im Wattenmeer. - Wiss. Meeresunters. (Helgoland) 18, 1-26.
Kfindler, R., 1928. Untersuchungen fiber die Biologie der Auster. Nr. 3. Verbreitung und Wachstum der Austernbrut im Wattenmeer. - Wiss. Meeresunters. (Helgoland) 17, 1-35.
t h e n i t r o g e n cycle a n d b e n t h i c communities in K e n e p u r u Sound, M a r l b o r o u g h Sounds, N e w Z e a l a n d . - Mar. Biol. 85, 127-136.
Korringa, P., 1980. M a n a g e m e n t of m a r i n e species: - HelgoD_uder M e e r e s u n t e r s . 33, 641-661. M a t t s o n , J. & Linden, O., 1983. Benthic m a c r o f a u n a succession u n d e r mussels, M y t / / u s edulis L.
(Bivalvia), c u l t u r e d o n h a n g i n g long-lines. - Sarsia 68, 97-102.
M5bius, K., 1877. Die A u s t e r u n d die Austernwirthschaft. Wiegandt, H e m p e l & Parey, Berlin, 126 pp. M5bius, K., 1893. U b e r die Tiere des schleswig-holsteinischen Austemb~inke, ihre p h y s i k a l i s c h e n
u n d b i o l o g i s c h e n Lebensverh~iltnisse. - Sber. preuss. Akad. Wiss. 7, 33-58.
Nilsson, S. G. & Nflsson, I. N., 1983. Are estimated species t u r n o v e r rates on islands l a r g e l y s a m p l i n g e r r o r s ? - Am. Nat. 121, 595-597.
Pearson, T. H., Josefson, A. B. & Rosenberg, R., 1985. P e t e r s e n ' s b e n t h i c stations revisited. I. Is the K a t t e g a t b e c o m i n g eutrophic? - J. exp. mar. Biol. Ecol. 92, 157-206.
Persson, L.-E., 1981. W e r e m a c r o b e n t h i c c h a n g e s i n d u c e d by t h i n n i n g out of flatfish stocks in the Baltic Proper? - O p h e l i a 20, 137-152.
Reise, K., 1980. H u n d e r t J a h r e Bioz6nose. - Naturw. Rdsch., Stuttg. 33, 328-335. Reise, K., 1985. Tidal flat ecology. Springer, Berlin, 191 pp.
Riesen, W. & Reise, K., 1982. M a c r o b e n t h o s of the subtidal W a d d e n Sea: revisited a f t e r 55 years. - Helgol~inder M e e r e s u n t e r s . 35, 409-423.
R o s e n b e r g , R., 1985. Eutrophication - the future m a r i n e coastal nuisance? - Mar. PoUut. Bull. 16, 227-231.
S c h o e n e r , T. W., 1983. Rate of species turnover d e c r e a s e s from lower to h i g h e r o r g a n i s m s : a review of t h e data. - Oikos 41, 372-377.
Steele, J. H., 1985. A comparison of terrestrial a n d m a r i n e ecological systems. - Nature, Lond. 313,
355-358.
S w e n n e n , C., 1980. Eider (Somateria mollissima L.}. In: Birds of t h e W a d d e n Sea. Ed. b y C. J. Smit & W. J. Wolff. Balkema, Rotterdam, 87-84. (Rep. W a d d e n Sea W o r k i n g Group. 6.)