Open Access
Research article
Development and validation of risk score for predicting positive
repeat prostate biopsy in patients with a previous negative biopsy in
a UK population
Mark A Rochester*
1, Nora Pashayan
3, Fiona Matthews
4, Andrew Doble
1and
John McLoughlin
1,2Address: 1Department of Urology, Addenbrooke's Hospital, Cambridge, UK, 2Department of Urology, West Suffolk Hospital, Bury St Edmunds, UK, 3Institute of Public Health, University of Cambridge School of Clinical Medicine, Cambridge, UK and 4Medical Research Council Biostatistics Unit, Institute of Public Health, University of Cambridge School of Clinical Medicine, Cambridge, UK
Email: Mark A Rochester* - [email protected]; Nora Pashayan - [email protected]; Fiona Matthews - [email protected]; Andrew Doble - [email protected]; John McLoughlin - [email protected] * Corresponding author
Abstract
Background: Little evidence is available to determine which patients should undergo repeat biopsy after initial benign extended core biopsy (ECB). Attempts have been made to reduce the frequency of negative repeat biopsies using PSA kinetics, density, free-to-total ratios and Kattan's nomogram, to identify men more likely to harbour cancer but no single tool accurately predicts biopsy outcome. The objective of this study was to develop a predictive nomogram to identify men more likely to have a cancer diagnosed on repeat prostate biopsy.
Methods: Patients with previous benign ECB undergoing repeat biopsy were identified from a database. Association between age, volume, stage, previous histology, PSA kinetics and positive repeat biopsy was analysed. Variables were entered stepwise into logistic regression models. A risk score giving the probability of positive repeat biopsy was estimated. The performance of this score was assessed using receiver characteristic (ROC) analysis.
Results: 110 repeat biopsies were performed in this period. Cancer was detected in 31% of repeat biopsies at Hospital (1) and 30% at Hospital (2). The most accurate predictive model combined age, PSA, PSA velocity, free-to-total PSA ratio, prostate volume and digital rectal examination (DRE) findings. The risk model performed well in an independent sample, area under the curve (AUCROC) was 0.818 (95% CI 0.707 to 0.929) for the risk model and 0.696 (95% CI 0.472 to 0.921) for the validation model. It was calculated that using a threshold risk score of > 0.2 to identify high risk individuals would reduce repeat biopsies by 39% while identifying 90% of the men with prostate cancer.
Conclusion: An accurate multi-variable predictive tool to determine the risk of positive repeat prostate biopsy is presented. This can be used by urologists in an outpatient setting to aid decision-making for men with prior benign histology for whom a repeat biopsy is being considered.
Published: 16 July 2009
BMC Urology 2009, 9:7 doi:10.1186/1471-2490-9-7
Received: 3 March 2009 Accepted: 16 July 2009
This article is available from: http://www.biomedcentral.com/1471-2490/9/7 © 2009 Rochester et al; licensee BioMed Central Ltd.
Background
The majority of the 35000 new diagnoses of prostate can-cer annually in the UK [1] are made as a result of transrec-tal ultrasound-guided (TRUS) biopsies of the prostate performed to investigate an elevated serum PSA or abnor-mal digital rectal examination. Seventy-five percent of cancers identified are detected at the first biopsy [2]. The majority of men undergoing this procedure, however, will not have a cancer detected and doubt will remain both in their minds and in those of the clinician as to whether a further biopsy is required in the setting of a persistently abnormal or rising serum PSA. Prostate biopsy is not with-out morbidity [3] carrying a 1% risk of sepsis or severe haemorrhage, and 5% risk of urinary tract infection, and the need to reduce unnecessary repeat biopsies was further highlighted recently in the UK with the publication of NICE guidelines for prostate cancer [4]. This document estimated that 89000 prostate biopsies are performed annually in the UK. Twenty percent of cancers are detected at the second biopsy session [5], and a number of param-eters have been promoted to reduce the frequency of benign repeat biopsy. Abnormal digital rectal examina-tion (DRE) [6], PSA [5], PSA velocity > 0.75 ng/ml/yr [7], PSA density > 0.15 [5,7] transition zone density > 0.25 [5,8], and free-to-total PSA ratio [5,7], as well as initial histological findings of high grade prostatic intraepithe-lial neoplasia (HGPIN) [6,8] or suspicious histology [9] have all been used to identify those men at higher risk of positive repeat biopsy. These individual parameters when taken alone, have poor positive and negative predictive value [5]. Kattan has produced a number of predictive nomograms to aid decision making in prostate cancer [10], including one intended to enhance prediction of positive repeat biopsies, based on sextant prostate biopsy data [11]. It was suggested that the model could be improved through adding free-to-total PSA ratio and pros-tate volume to the calculation. The aim of this study was to use a similar approach for a United Kingdom popula-tion in order to produce a more accurate predictive tool to be used in the outpatient setting when faced with a patient who may be a candidate for a second TRUS and biopsy of the prostate.
Methods
All patients who underwent first repeat prostate biopsy sessions at two hospitals in the former West Anglia Cancer Network with a combined catchment population of more that 1.25 million were studied. Those who had an initial negative biopsy were analysed. Indications for repeat biopsy and the number of biopsy cores taken were similar in both hospitals according to local guidelines, with an extended core biopsy template (at least 10 cores including anterior horn of the peripheral zone). Prostate biopsies were performed using TRUS guidance with a 7.5 MHz
probe (B&K), biopsy gun (Bard) and an 18 gauge biopsy needle with local anesthesia.
The clinical parameters recorded for each patient were age, serum PSA, PSA velocity in ng/ml/year (measured over 18 months), prostate volume, DRE findings, time interval between biopsy sessions, and history of HGPIN or suspi-cious histology. Data was collected from an anonymised database. Research was carried out in compliance with the Helsinki Declaration.
Developing the risk score
This was based on data obtained from patients undergo-ing repeat biopsy at Hospital (1) in the former West Anglia Cancer Network during 2007. Using univariate analysis, the association between the study variables (age, prostate volume, DRE findings (clinically benign referred to as stage 1, and a palpable abnormality stage 2), previ-ous suspiciprevi-ous biopsy, previprevi-ous high grade PIN, PSA, free-to-total PSA, PSA density, PSA velocity) and the outcome of repeat biopsy was studied. These variables were subse-quently entered stepwise into logistic regression models. For each model, the mean probability of having a positive repeat biopsy was estimated for each individual. These results were compared with the true status and the coeffi-cients from the model that best discriminated between positive and negative biopsy were used to estimate the risk score. Risk factors that were not statistically significant predictors of positive repeat biopsy were also included into the risk predictor model and to the risk score estima-tion as this could increase predictive power. Although DRE findings and previous HGPIN did not increase the predictive power of the statistical model, they were included in the risk score calculations as a consequence of their assumed clinical importance.
Probability of positive repeat biopsy was estimated as the expit (α + β1 x1 + β2 x2 ... βn xn ) of the model where, β rep-resents the coefficient and x the variable used in the risk score: age at biopsy, previous HGPIN, DRE findings, vol-ume of the prostate, serum level of PSA and free-to-total PSA, and PSA velocity. The risk score was calculated for each subject with no missing data points in the selected risk factors.
prostate cancer correctly identified as such by the risk score (percentage true positives). The specificity of the risk score is the proportion of men without prostate cancer who are correctly identified as such by the risk score (per-centage true negatives). The positive predictive value of the risk score is the proportion of men with a positive result on the risk score who indeed have prostate cancer identified on biopsy.
Analyses were performed using the statistics package Stata 9. (Stata Corp. Stata Statistical Software: release 9. 2005. Texas: Stata Corporation)
Testing the risk score
The performance of the risk score in predicting prostate cancer diagnosis on repeat biopsy was evaluated in an independent sample of patients who had their repeat
prostate biopsy at Hospital (2) in the former West Anglia Cancer Network.
The risk score for each subject was calculated. The scores were tested for sensitivity, specificity, positive predictive value (PPV), and negative predictive value (NPV) in differ-entiating men with and without prostate cancer diagnosis on repeat biopsy.
Results
Developing the risk score -Hospital (1)
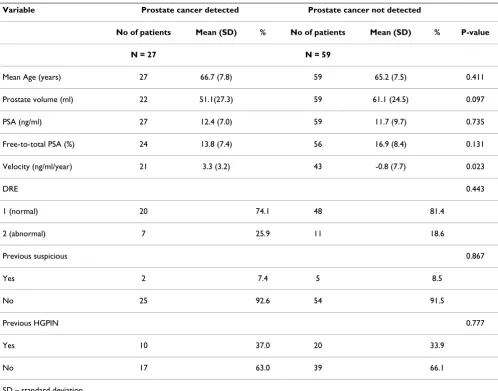
A total of 87 patients underwent repeat biopsy at Hospital (1) during the study period, of whom 31% (27) had pros-tate cancer diagnosis on repeat biopsy. Table 1 shows the association between the outcome of prostate biopsy and the study variables. Only velocity of PSA was statistically significantly higher in men with positive repeat prostate biopsy as compared to men with negative biopsy findings
Table 1: B Repeat prostate biopsy outcome and patient and prostate related factors, Hospital (1) sample
Variable Prostate cancer detected Prostate cancer not detected
No of patients Mean (SD) % No of patients Mean (SD) % P-value
N = 27 N = 59
Mean Age (years) 27 66.7 (7.8) 59 65.2 (7.5) 0.411
Prostate volume (ml) 22 51.1(27.3) 59 61.1 (24.5) 0.097
PSA (ng/ml) 27 12.4 (7.0) 59 11.7 (9.7) 0.735
Free-to-total PSA (%) 24 13.8 (7.4) 56 16.9 (8.4) 0.131
Velocity (ng/ml/year) 21 3.3 (3.2) 43 -0.8 (7.7) 0.023
DRE 0.443
1 (normal) 20 74.1 48 81.4
2 (abnormal) 7 25.9 11 18.6
Previous suspicious 0.867
Yes 2 7.4 5 8.5
No 25 92.6 54 91.5
Previous HGPIN 0.777
Yes 10 37.0 20 33.9
No 17 63.0 39 66.1
SD – standard deviation
P-value derived from logistic regression model
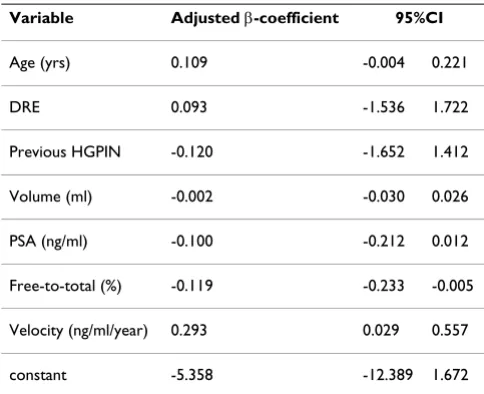
(p = 0.023). Even after adjusting for the other study varia-bles, velocity remained statistically significant predictor of positive repeat biopsy (OR-trend = 1.34; 95%CI 1.03 – 1.74) (Table 2). Though the other variables were not sta-tistically significant predictors individually, they were included in the final logistic regression model as they improved prediction.
A model that included the variables age, DRE findings, previous HGPIN, volume of the prostate gland, serum lev-els of PSA and free/total PSA, and PSA velocity had a prob-ability of predicting prostate cancer of 51% compared to 24% in predicting absence of cancer on prostate repeat biopsy.
The coefficients obtained from the logistic regression model are shown in Table 2.
The performance of the risk score in differentiating patients with positive and negative biopsy outcome is shown in the receiver operating characteristic curve in Fig-ure 1, with area under the curve (AUC) = 0.818 (95%CI 0.707 to 0.929).
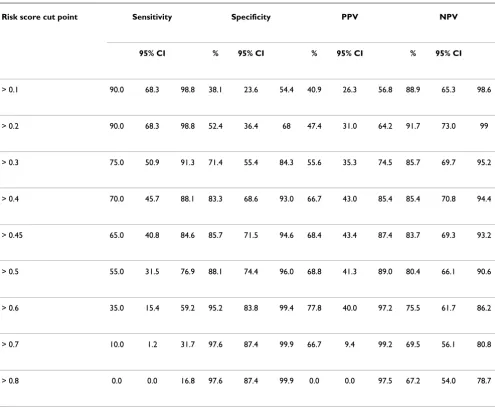
The risk score cut off that maximised the sum of sensitivity and specificity was derived from ROC analysis. This cut point was 0.45, with sensitivity of 70% and specificity of 83%. A risk score > 0.45, would reduce 69% of the biop-sies (43/62) while identifying 65% (13/20) of the cases. Whereas a risk score > 0.2 would reduce 39% (24/62) of the biopsies, while identifying 90% (18/20) of the patients with prostate cancer and missing 10% (2/20) of the patients with prostate cancer. Almost half of the patients with a risk score > 0.2 are likely to have positive
prostate biopsy for prostate cancer (PPV = 47.4%; 95% CI 31.0% to 64.2%) (Table 3).
Validation of the risk score
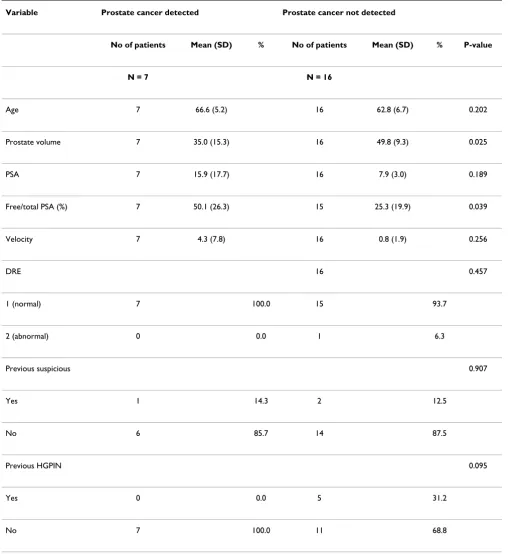
Overall, during the study period, 23 patients had repeat prostate biopsy in Hospital (2), of whom 7 patients (30%) had prostate cancer diagnosis. The characteristics of patients who had repeat biopsy in Hospital (2) are given in Table 4.
The performance of the risk score in differentiating patients with positive and negative biopsy outcome is shown in the receiver operating characteristic curve in Fig-ure 2, with AUC = 0.696 (95%CI 0.472 to 0.921). This indicates that the risk model has performed well in an independent sample. Using a cut point of 0.2 from the model derived in Hospital (1), 100% (7/7) of patients with positive repeat biopsy were correctly identified.
Discussion
Clinicians use various triggers for proceeding to repeat prostate biopsies. Serum PSA, (which may be age-adjusted), age, DRE findings, free-to-total PSA ratio, tran-sition zone PSA density, standard PSA density, PSA veloc-ity and the finding of HGPIN on initial biopsy have all been used in this setting [1-5].
The predictive value of these individual factors is limited, however, and this has led to attempts to refine the predic-tion process and reduce the frequency of unnecessary repeat biopsies. Artificial neural networks and nomo-grams have been used to this end [11-14] but have not gained wide acceptance in clinical practice.
The detection rate of cancer on second and further biop-sies is thought to be lower than the initial procedure. Kat-tan's group showed that the rate decreased from 19.5% in the second biopsy to 13.5% after 5 or more biopsy ses-sions [11]. This data and previous studies were, however, based on initial sextant biopsies. In our study, the rate of positive biopsies remained steady at 30%, and the distri-bution of cancer grade did not change suggesting that even in the era of extended core prostate biopsies initial benign biopsies do not preclude a diagnosis of significant cancer on subsequent investigation.
Identifying those men who require repeat biopsy whilst avoiding unnecessary biopsies is not straightforward. Djavan found that free-to-total PSA ratio and transition zone PSA density were useful predictive factors with AUCs of 74% and 69% [13]. Keetch et al have shown PSA den-sity and PSA velocity to be better predictors [15] suggest-ing that ussuggest-ing more than one variable in determinsuggest-ing further biopsy is beneficial, but that the ideal combina-tion is unknown.
Table 2: Adjusted β-coefficients and 95% confidence intervals for each risk factor, Hospital (1) sample
Variable Adjusted β-coefficient 95%CI
Age (yrs) 0.109 -0.004 0.221
DRE 0.093 -1.536 1.722
Previous HGPIN -0.120 -1.652 1.412
Volume (ml) -0.002 -0.030 0.026
PSA (ng/ml) -0.100 -0.212 0.012
Free-to-total (%) -0.119 -0.233 -0.005
Velocity (ng/ml/year) 0.293 0.029 0.557
constant -5.358 -12.389 1.672
The Kattan nomogram included a selection of risk factors that can predict the presence of cancer, and this model was validated in a second repeat biopsy population with an AUC of 71% [14].
Gallo [16] and Akhavan [17] have recently questioned the predictive value of HGPIN in repeat biopsy, and our model supports this view, as adding this variable to the regression model did not increase the accuracy of predic-tion. However, other authors have suggested that the find-ing of multifocal HGPIN should be viewed with more suspicion [18].
Kattan showed that incorporating multiple variables can vastly improve on the predicted probability of having prostate cancer [11]. We have adapted this approach to the extended core repeat prostate biopsy population in a UK setting, and improved the accuracy through adding
the additional variables of prostate volume and free-to-total PSA ratio.
This nomogram (AUC 0.82, 95%CI 0.71 – 0.93) per-formed favourably when compared with Kattan's which had an AUC of 0.75. This may be a result of the incorpo-ration of additional variables to the model. This predictive tool is based on men who present either with symptoms, or as a result of opportunistic screening. Whether this pre-dictive tool is applicable to a setting where PSA testing for screening purposes is more widely available needs to be investigated. This model has been internally validated, but re-validation on external populations should be the next step.
The decision to repeat a prostate biopsy must be made after informed discussion between clinician and patient, following a multi-disciplinary team meeting case discus-Receiver operating characteristic curve for the performance of risk score in identifying patients with prostate cancer diagnosis on repeat biopsy, Hospital (1) sample
Figure 1
sion. A nomogram can aid decision making in this setting. The probability of cancer on repeat biopsy generated by this predictive tool reflects the probability that a man with the same clinical parameters investigated in the same manner as those included in this retrospective analysis would have a positive repeat biopsy. This figure will be interpreted by the patient according to his perception of risk to inform his choice. A precise cut-off to trigger a repeat biopsy is difficult to produce, and will vary accord-ing to an individual patient's and urologist's perception of risk, however, using a calculated risk score threshold for re-biopsy of 0.45 (sensitivity 70%, specificity 83%) would reduce the number of unnecessary biopsies in this study (absolute reduction 69%) while identifying 65% of the cancers. Alternatively a more conservative approach using a risk-score threshold for biopsy of > 0.2 would reduce the number of biopsies by 39% while identifying 90% of
patients with cancer. As such this study has policy impli-cations. Implementing such a threshold risk score to trig-ger repeat biopsy could reduce the number of repeat biopsies in the UK by up to 4100 per year, equating to a saving of €1.25 million, prevention of 40 life-threatening hospital admissions for urinary sepsis, and 200 fewer uri-nary tract infections.
Strengths of the study
The predictive tool was developed based on data from one population sample and was tested in an independent sample. Application of the risk scores to an independent sample with good and comparable performance supports the validity of the developed risk score model. A webtool has been developed which is accessible, easy to use, and is based on parameters readily available to the clinician dur-ing an outpatient consultation. This facilitates discussion Table 3: Sensitivity, specificity, positive predictive value (PPV), negative predictive value (NPV) and 95% confidence intervals (CI) at different risk score cut points, Hospital (1) sample
Risk score cut point Sensitivity Specificity PPV NPV
95% CI % 95% CI % 95% CI % 95% CI
> 0.1 90.0 68.3 98.8 38.1 23.6 54.4 40.9 26.3 56.8 88.9 65.3 98.6
> 0.2 90.0 68.3 98.8 52.4 36.4 68 47.4 31.0 64.2 91.7 73.0 99
> 0.3 75.0 50.9 91.3 71.4 55.4 84.3 55.6 35.3 74.5 85.7 69.7 95.2
> 0.4 70.0 45.7 88.1 83.3 68.6 93.0 66.7 43.0 85.4 85.4 70.8 94.4
> 0.45 65.0 40.8 84.6 85.7 71.5 94.6 68.4 43.4 87.4 83.7 69.3 93.2
> 0.5 55.0 31.5 76.9 88.1 74.4 96.0 68.8 41.3 89.0 80.4 66.1 90.6
> 0.6 35.0 15.4 59.2 95.2 83.8 99.4 77.8 40.0 97.2 75.5 61.7 86.2
> 0.7 10.0 1.2 31.7 97.6 87.4 99.9 66.7 9.4 99.2 69.5 56.1 80.8
Table 4: The association between the outcome of prostate biopsy and patient and prostate related factors, Hospital (2) sample
Variable Prostate cancer detected Prostate cancer not detected
No of patients Mean (SD) % No of patients Mean (SD) % P-value
N = 7 N = 16
Age 7 66.6 (5.2) 16 62.8 (6.7) 0.202
Prostate volume 7 35.0 (15.3) 16 49.8 (9.3) 0.025
PSA 7 15.9 (17.7) 16 7.9 (3.0) 0.189
Free/total PSA (%) 7 50.1 (26.3) 15 25.3 (19.9) 0.039
Velocity 7 4.3 (7.8) 16 0.8 (1.9) 0.256
DRE 16 0.457
1 (normal) 7 100.0 15 93.7
2 (abnormal) 0 0.0 1 6.3
Previous suspicious 0.907
Yes 1 14.3 2 12.5
No 6 85.7 14 87.5
Previous HGPIN 0.095
Yes 0 0.0 5 31.2
No 7 100.0 11 68.8
SD – standard deviation
Receiver operating characteristic curve for the performance of risk score in identifying patients with prostate cancer diagnosis on repeat biopsy, Hospital (2) sample
Figure 2
Receiver operating characteristic curve for the performance of risk score in identifying patients with prostate cancer diagnosis on repeat biopsy, Hospital (2) sample.
Example screenshot of Webtool (available at http://www.ck-net.com/clients/camurology/) Figure 3
of the risk estimates in real time with the patient and fur-ther management planned in an informed fashion (Figure 3).
Limitations
The risk prediction model and the validation are based on a small sample size. Nevertheless, the model had high pre-dictive accuracy of 82% and has been validated on a small external sample. This is a pilot model pending further work on a larger sample size from different regions of the UK. Repeat prostate biopsy is clearly not performed on all patients and as such a true sensitivity and specificity for the test are impossible to determine. Patients were filtered through clinical judgement. However, as the data are derived over a short period of time, then clinical decision and investigation are likely to be comparable among the patients undertaking repeat biopsy.
This tool is not designed to replace clinical judgement. Once biopsy is considered, the tool will assist in informed decision making.
Conclusion
We have developed a web-based predictive tool for a UK population which is comparable to previous published predictive nomograms to aid decision-making in men with persistently abnormal PSA who are considering a repeat prostate biopsy. Using such risk score prediction model in clinical practice, could help in forming a strategy for reducing the number of unnecessary repeat biopsies.
Competing interests
The authors declare that they have no competing interests.
Authors' contributions
MR participated in design of the study, collected data and drafted the manuscript. NP and FM carried out the statis-tical analysis and created the predictive model and partic-ipated in design of the study. AD particpartic-ipated in the design of the study, collection of data and the drafting of the manuscript. JM conceived of the study, collected data, and participated in study design and coordination. All authors read and approved the final manuscript.
Acknowledgements
The authors are grateful to Mr Chris Kelly, University of Cambridge School of Clinical Medicine, for his assistance with the creation of the web-based predictive tool.
References
1. Cancer Research UK: UK Prostate Cancer incidence statistics.
[http://info.cancerresearchuk.org/cancerstats/types/prostate/inci dence/]. Incidence UK
2. Djavan B, Margreiter M: Biopsy standards for detection of pros-tate cancer. World J Urol 2007, 25(1):11-7.
3. Rodriguez LV, Terris MK: Risks and complications of transrectal ultrasound guided prostate needle biopsy: a prospective
study and review of the literature. J Urol 1998, 160(6 Pt 1):2115-20.
4. Graham J, Baker M, Macbeth F, Titshall V: Diagnosis and treat-ment of prostate cancer: summary of NICE guidance. Bmj
2008, 336(7644):610-2.
5. Djavan B, Zlotta A, Remzi M, Ghawidel K, Basharkhah A, Schulman CC, Marberger M: Optimal predictors of prostate cancer on repeat prostate biopsy: a prospective study of 1,051 men. J Urol 2000, 163(4):1144-8. discussion 1148–9.
6. Eggener SE, Roehl KA, Catalona WJ: Predictors of subsequent prostate cancer in men with a prostate specific antigen of 2.6 to 4.0 ng/ml and an initially negative biopsy. J Urol 2005,
174(2):500-4.
7. Fowler JE Jr, Bigler SA, Miles D, Yalkut DA: Predictors of first repeat biopsy cancer detection with suspected local stage prostate cancer. J Urol 2000, 163(3):813-8.
8. Singh H, Canto EI, Shariat SF, Kadmon D, Miles BJ, Wheeler TM, Slawin KM: Predictors of prostate cancer after initial negative systematic 12 core biopsy. J Urol 2004, 171(5):1850-4. 9. Montironi R, Scattoni V, Mazzucchelli R, Lopez-Beltran A, Bostwick
DG, Montorsi F: Atypical foci suspicious but not diagnostic of malignancy in prostate needle biopsies (also referred to as "atypical small acinar proliferation suspicious for but not diagnostic of malignancy"). Eur Urol 2006, 50(4):666-74. 10. Kattan MW, Scardino PT: Evidence for the usefulness of
nomo-grams. Nat Clin Pract Urol 2007, 4(12):638-9.
11. Lopez-Corona E, Ohori M, Scardino PT, Reuter VE, Gonen M, Kattan MW: A nomogram for predicting a positive repeat prostate biopsy in patients with a previous negative biopsy session. J Urol 2003, 170(4 Pt 1):1184-8. discussion 1188.
12. Carlson GD, Calvanese CB, Partin AW: An algorithm combining age, total prostate-specific antigen (PSA), and percent free PSA to predict prostate cancer: results on 4298 cases. Urology
1998, 52(3):455-61.
13. Djavan B, Remzi M, Zlotta A, Seitz C, Snow P, Marberger M: Novel artificial neural network for early detection of prostate can-cer. J Clin Oncol 2002, 20(4):921-9.
14. Yanke BV, Gonen M, Scardino PT, Kattan MW: Validation of a nomogram for predicting positive repeat biopsy for prostate cancer. J Urol 2005, 173(2):421-4.
15. Keetch DW, Catalona WJ, Smith DS: Serial prostatic biopsies in men with persistently elevated serum prostate specific anti-gen values. J Urol 1994, 151(6):1571-4.
16. Gallo F, Chiono L, Gastaldi E, Venturino E, Giberti C: Prognostic Significance of High-Grade Prostatic Intraepithelial Neopla-sia (HGPIN): Risk of Prostatic Cancer on Repeat Biopsies.
Urology 2008, 72(3):628-32.
17. Akhavan A, Keith JD, Bastacky SI, Cai C, Wang Y, Nelson JB: The proportion of cores with high-grade prostatic intraepithelial neoplasia on extended-pattern needle biopsy is significantly associated with prostate cancer on site-directed repeat biopsy. BJU Int 2007, 99(4):765-9.
18. Schoenfield L, Jones JS, Zippe CD, Reuther AM, Klein E, Zhou M, Magi-Galluzzi C: The incidence of high-grade prostatic intraep-ithelial neoplasia and atypical glands suspicious for carci-noma on first-time saturation needle biopsy, and the subsequent risk of cancer. BJU Int 2007, 99(4):770-4.
Pre-publication history
The pre-publication history for this paper can be accessed here: