Volume 2 Number 1 Article 1
August 2018
Craft Beer Consumers' Lifestyles and Perceptions of Locality
Craft Beer Consumers' Lifestyles and Perceptions of Locality
John Long
Texas Tech University Natalia Velikova PHD Texas Tech University Tim Dodd
TTU
Sheila Scott-Halsell Texas Tech University
Follow this and additional works at: https://scholars.unh.edu/ijhbm
Part of the Social Psychology and Interaction Commons
Recommended Citation Recommended Citation
Long, John; Velikova, Natalia PHD; Dodd, Tim; and Scott-Halsell, Sheila (2018) "Craft Beer Consumers' Lifestyles and Perceptions of Locality," International Journal of Hospitality Beverage Management: Vol. 2 : No. 1 , Article 1.
DOI: https://dx.doi.org/10.34051/j/2019.5
Available at: https://scholars.unh.edu/ijhbm/vol2/iss1/1
Craft beer consumers’ lifestyles and perceptions of locality
Introduction
Craft beer, while holding slightly over 12% of the U.S. beer market share by volume,
enjoyed drastic growth in recent years. According to the Brewers Association (2015), there was
at least a 13% growth in the number of barrels produced each year since 2010. In 2014 alone,
547 new breweries opened, bringing the total number of craft breweries in the U.S. to 3,418. The
growth of U.S. craft breweries resulted in having 1.51 breweries per 100,000 adults of legal
drinking age. However, even with the growing dispersion among the population, many
consumers are still confused by the concept of a craft brewery.
The Brewers Association (2015) defines a ‘craft brewery’ as a brewery with an annual
production under 6 million barrels. The Association further splits craft breweries into four types:
microbreweries (production under 15,000 barrels, and must have at least 75% of production sold
offsite); brewpubs (production under 15,000 barrels, and must sell a minimum of 25% of beer
onsite); regional craft breweries (production between 15,000 and 6,000,000 barrels, and usually
distribute their beer throughout several states); and contract brewing companies (produce, bottle,
package, and send beer to the base brewery, but do not market, sell, or distribute their
production).
One of craft beer’s biggest selling points is the local, hand-crafted nature of the beer.
With the average production of U.S. craft breweries being only 6,900 barrels (which is skewed
higher due to larger regional breweries), most craft breweries fundamentally depend on
consumers’ desire for local products (Hede & Watne, 2013). Previous research found that
consumers indeed are willing to pay a premium for locally produced agricultural products
correlate with preferences for organic production, and it is not quite clear how far the desire for
locality alone extends.
The craft beer industry uses various aspects to market locality. However, there is minimal
literature on consumers’ perceptions of local craft beer and the role that locality plays in
consumers’ purchasing decisions. By studying consumers’ perceptions of locally brewed beer,
this research aims to gain a better understanding of consumers’ purchasing motivators.
Additionally, consumers’ lifestyles were shown as important determinants of consumer behavior
and purchasing decisions (Orth, McDaniel, Shellhammer, & Lopetcharat, 2004). Using the
concept of lifestyle craft beer consumers’ segmentation, this research investigates attitudes and
purchasing motivators for different groups of craft beer consumers.
Literature review
Sense of place
This study uses the conceptual framework of sense of place, focusing on the place
attachment and place identity aspects. Sense of place is defined as a “personal means of relating
to the world” (Hay, 1988, p. 160). It transforms mere space into one’s personal place; the place
to which a human belongs, which contains more than administrative boundaries. Places can exist
in a symbolic or physical manner, and present themselves in a variety levels (Kaltenborn, 1997).
A person’s place may entail their home, neighborhood, community, state, or nation. An
individual’s perception of these places may be positive or negative, and is largely dependent on
the individual’s collective life experiences, and the influences of the social groups with whom
they associate (Eyles, 1985). An individual’s perspective can change considerably based on the
factors contribute to developing an individual’s sense of place, which dictates how an individual
relates to the environments in which he/she lives (Shumaker & Hankin, 1984).
A key aspect of the sense of place is the role that an individual’s place of residence takes
in their life, beyond just being a shared space (Hay, 1988). As people develop more intricate
relationships with a place, they tend to become an active part of that place rather than merely
residing there. By extension, this gives them a stronger sense of attachment to local businesses,
an increased desire to support their neighbors, and motivation to maintain their natural
surroundings. As longer periods of time pass, the sense of belonging to a place can develop from
a bond that simulates an immediate sensory delight, to an anchor of one’s personal identity (Hay,
1988).
There are three main constructs that comprise the sense of place theory: place attachment,
place identity, and place dependence (Jorgensen & Stedman, 2001). This study will primarily
focus on place attachment and place identity. Craft beer is not pertinent to an individual’s
dependence on a particular place, since the product under investigation is not considered a
necessity.
Place attachment is often described as the positive affective bond created between people
and their environment (Hidalgo & Hernandez, 2001; Williams, Patterson, Roggenbuck, &
Watson, 1992). This can extend beyond a physical location (which often constitutes place
attachment) into the symbols of a specific place (Kaltenborn, 1997). With much of the craft beer
production being at a state level, there are strong associations between breweries and their
locations. These associations may cause local craft beer to become symbols of the area, in the
Lobster, and Idaho Potatoes). From the consumer standpoint, purchasing of craft beer may be
motivated by attachments to the place where the beer is produced.
Whereas place attachment entails an individual’s positive connection with a place, place
identity focuses on the relationship between people and their environment (Uzzell, Pol, &
Badenes, 2002). Place identity is often considered the most direct contributor to sense of place,
since it is largely based on personal interpretations of events that occurred in that place
(Rubinstein & Parmalee, 1992). These personal interpretations often lead to the positive bond
that people feel toward a place, leading to place attachment. So, place identity acts as the catalyst
to the development of sense of place. Combined with Proshansky, Fabian, & Kaminoff’s work
(1983) indicating that place identity also influences preferences and behavioral tendencies, place
identity may potentially influence how consumers make their purchasing decisions of local
products.
The current study develops a case for craft beer contributing to sense of place.
Specifically, it evaluates consumers’ purchasing drivers for craft beer in association with their
perceptions of locality. The study will also examine if certain behavioral cues (lifestyles)
differentiate one’s attachment with the place.
Local production
Darby, Batte, Ernst, and Roe(2008) claimed that locality of production can be the main
purchasing motivator, independent from other factors, such as a desire to buy fresh or organic
products. The researchers further noted that state lines often act as natural boundaries for
consumers’ perceptions of local production. While previous research dealt mostly with fresh
agricultural products that are grown, sold, and consumed in the same location, only a few studies
Woods, & Ernst, 2012; Baginski & Bell, 2011). Craft beer is a local product that acquires
ingredients from non-local sources. Thus, consumers’ perceptions of craft beer locality may not
be the same as for other agricultural products.
In their study of locality, Hu et al. (2012) used blackberry jam as an example and found
that typically consumers would pay more for a national brand than a store or regional brand.
However, if the item was labeled as a ‘product of small farms’, consumers were more willing to
purchase that product. Moreover, they were willing to pay on average 31 cents more for the
product if it was labeled with the smaller region within a state, compared to the state-only label.
Schnell (2013) found that a local product has less to do with the distance from the source
of the food to the consumption point, as it does with the connections between consumption and
production. Therefore, by rooting production in a specific place, consumer experiences are
shaped in a way that establishes a strong connection with that place. With many local breweries
identifying themselves with smaller communities, rather than the entire state, it is worth
investigating if craft beer shares the same local boundaries as other agricultural products, and if
the motivations for buying local craft beer products enforces an attachment to the place.
Since craft breweries’ production is usually too small to reach larger markets, these
breweries often have strong relationships with the places in which they are located. To promote
themselves effectively within the local markets, craft breweries often align themselves with local
heroes, prominent historical figures, and local landmarks (Hede & Watne, 2013). They make
these alignments through the name of a beer or the brewery itself, or designing labels to portray
the local context. By using these strategies, breweries are striving to ‘humanize’ their brands and
provide a sense of place to all consumers – including non-locals - due to the story and imagery
be highly involved with their local communities. They often participate in local festivals,
volunteer at local organizations, and donate to local philanthropic endeavors (Kleban &
Nickerson, 2012). It is interesting to investigate the reciprocal side of these relationships – that
is, whether consumers feel that by buying locally produced craft beer, they support the local
economy. The current study will examine this issue.
Lifestyles
To target consumers effectively, companies often segment their consumers based on a
variety of characteristics. Segmentation criteria are usually based on consumption behavior,
demographic data, and psychological attributes; the latter being used with increased frequency.
Of the psychological attributes, lifestyle is proficient in identifying consumption and behavioral
patterns, as well as purchasing decisions (Zepeda & Nie, 2012; Vyncke, 2002).
Using lifestyle as a segmentation criterion was shown to be effective in studies of beer,
wine, and spirits consumption (e.g., Lesch, Luk, & Leonard, 1991; Orth et. al., 2004). While
Orth et al. (2004) examined craft beer consumers’ lifestyles, their research did not consider the
local aspect of craft beer or occasion consumption behavior, both of which are considered in the
current study. With lifestyle being a significant predictor for consumer preferences for other
alcoholic beverages, it is worthwhile to examine whether consumer lifestyles are indicators for
local craft beer purchasing motivations, as well as craft beer consumption behavior.
Purpose of the study
With a dearth of previous research on the perceptions of locality for craft beer, it deems
necessary to examine what motivates consumers to purchase local craft beer. Furthermore, there
is a void in research on craft beer consumer profiles – both for basic demographic profiling, and
a) develop a profile for craft beer consumers, b) determine consumers’ perceptions of locally
produced craft beer, c) determine lifestyle groups among craft beer consumers, and d) evaluate
the similarities and differences among the different segments of craft beer consumers.
Research questions
To fulfill the purpose of the study, the following research questions were advanced:
RQ1: What is the profile of craft beer consumers?
RQ2: What are consumers’ perceptions of locality for craft beer production? RQ3: What lifestyles are most prevalent among craft beer consumers?
RQ4: What are the similarities and differences in consumption behavior and purchasing motivations among different groups of craft beer consumers?
Methodology
Data collection
Data were collected via a self-administered structured survey, programmed in Qualtrics.
Oklahoma was selected as the location for data collection due to the emerging craft beer industry
in the state, which currently has a 416-million-dollar economic impact and is producing 34,381
barrels of craft beer annually (Brewers Association, 2015). Furthermore, since 2011, Oklahoma
has a minimum of 4,000-barrel increase in production each year, including a 10,000-barrel jump
from 2014 to 2015. Thus, the state residents have relatively high exposure to craft beer. The data
were collected via tablets at the Oklahoma Craft Beer Festival in June 2016.
Sample
The sample was composed of the festival attendees. Consumption frequency of craft beer
was used as a screening question to eliminate respondents who never consumed craft beer or
Instrument
Craft beer consumption behavior was measured using items adapted from wine literature
(e.g., Velikova, Charters, Bouzdine-Chameeva, Fountain, Ritchie, & Dodd, 2015). For
perceptions of locality, one measure was borrowed from Denver and Jensen (2014), where
locality was defined by various administrative boundaries (city, county, state lines, region, and
country). For the second measure of locality, respondents were asked what distance (in miles)
from the craft beer place of production to its purchase point they would consider acceptable for
the beer to be called ‘local’.
Measures for the motivators for local beer purchasing were adapted from a study on
consumer preferences for local and organically produced apples (Denver & Jensen, 2014),
namely, “a desire to try new products’, ‘a desire to try something local’, ‘a desire to try
something not available where they live’, ‘to support the local economy’, feeling that locally
brewed beer is ‘a better value’, ‘better for the environment’, and ‘is something hand-made’.
Items were measured on five-point Likert scales, ranging from 1 = strongly disagree, to 5 =
strongly agree.
The lifestyle measures, comprised of thirty-one items, were adapted from a combination
of the VALS measures and the values lifestyle categorization (Kahle, Beatty, & Homer, 1986;
Mitchell, 1983), also measured on five-point Likert scales. Finally, socio-demographic measures
included questions on state of residence, age, annual household income, gender, ethnicity, and
education level.
Data analysis
Descriptive statistics were used to examine the profile of the sample. Lifestyle measures
groups. Crosstabs were applied to determine differences and similarities among the lifestyle
clusters; and analysis of variance (ANOVA) was used to examine the differences in purchasing
motivators between the groups.
Results
Sample description
The sample was a bit skewed towards males (60.9%). Respondents were primarily
Caucasian (87%), with the next highest ethnicities being Native Americans and Hispanics at
4.3% each. The vast majority (95.1%) of respondents were Oklahoma residents. About
two-thirds were under 40 years old. Respondents were highly educated, with 78.3% having earned
either an undergraduate or graduate degree. Only slightly over 20% made less than $40,000, and
37.1% had an annual household income over $100,000.
With data collection occurring at a craft beer festival, it came as no surprise that 79% of
the respondents chose beer as their most often consumed alcoholic beverage. Over 60% drink
craft beer at least once a week, with 17.9% indicating they consume craft beer daily. Full results
TableI.
TableI about here
Perceptions of locality
Over two-thirds of the respondents chose ‘brewed in the same state’ as their perception of
a locally produced beer; and an additional 26.6% chose production areas smaller than state-wide.
Respondents were further asked to use a slider (0-600 miles) to mark how far from the selling
point a beer could be brewed and still be considered local. The mean mileage was 140 miles, and
the median fell at 121 miles. This lines up fairly well with the categorized production territories,
as the mileage from the place of data collection to the state line averaged approximately 142
miles.
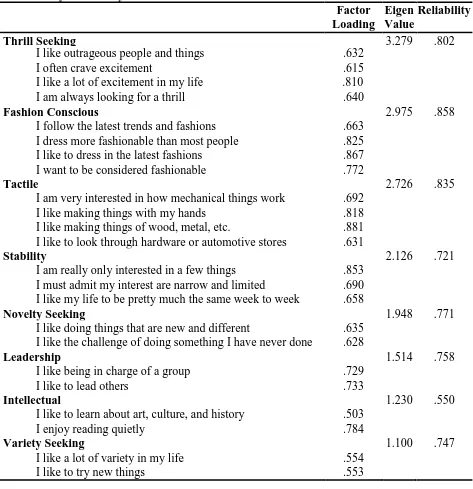
Lifestyle factors
An exploratory factor analysis with a Varimax rotation was used to analyze the lifestyle
measures, resulting in an eight-factor solution. Items that did not load at the acceptable factor
loading level of .50 were removed from further analysis. Based on the evaluation of items
loading under each factor grouping, the factors were labeled as shown in Table II. The eight
factors accounted for 56.37% of the total variance.
Insert Table II about here
Cluster analysis
The K-means clustering algorithm was applied to classify the respondents into clusters. A
five-cluster configuration was regarded the most appropriate, as the group sizes were substantial
and comparable, and seemed to show differences in perceptions of locality and purchasing
motivators. After a closer examination of the average means for the lifestyle factors for each
cluster (as shown in Table III), they were titled: Adventurers, Preservers, Conservatives,
Insert Table III about here
Examination of clusters
Demographics
Gender and ethnicity were the only two demographic variables to show significant
differences, and thus reported here. Gender differences (2 (6, N = 207) = 20.836, p < .05) were
most evident in the Conservatives and Tradesmen clusters. The Conservatives were the only
group to have a higher number of females than males, with a 60:40 ratio that was approximately
inverse from the overall sample distribution. There were no women in the Tradesmen cluster,
which may be largely due to the lifestyle items relating to manual labor and working with
machines, historically a higher draw to males than females.
Significant differences in ethnicities (2 (10, N = 207) = 34.001, p < .05) may be
attributed to the fact that the Adventurers group had the highest percentage of Hispanics, African
Americans, and Asians. On the other hand, the Conservatives group were a much higher
percentage of Caucasians at 95%, with only two respondents of different ethnicities. Although
the smallest cluster, the Tradesmen had the highest percentage of American Indians at 11.1%.
Consumption differences
While all the clusters identified craft beer as the most often consumed alcoholic beverage,
the results of cross-tabulation revealed that the clusters significantly differed in their preferences
for alcoholic beverages in four consumption environments – home consumption, a gathering
with friends, restaurant, and bar consumption.
Differences in the home consumption environment (2 (16, N = 207) = 31.157, p < .05)
may be explained in large part by the Conservatives’ and Adventurers’ propensity to drink wine
to be consumed at home, whereas no one in the Tradesmen cluster chose wine for this
consumption environment. Adventurers had the highest number of respondents who preferred to
drink spirits at home. The Learners were significantly above the sample average with the
majority choosing craft beer for home consumption. Less than one-third of the Tradesmen and
less than a quarter of the Preservers chose traditional beer for home consumption, while the rest
of the sample showed less preference for consuming traditional beer at home.
For a gathering with friends, (2 (16, N = 207) = 28.047, p < .05), the Learners stood out,
having 32 members (out of 40) choose craft beer. Once again, the Adventurers had the highest
number of respondents choosing spirits. The Preservers were the most likely to go with
traditional beer, with almost a quarter of this group choosing it.
In the restaurant consumption environment (2 (16, N = 207) = 36.159, p < .05), the
Conservatives and Adventurers preferred wine, while the Tradesmen and Learners chose craft
beer. For bar consumption, significance differences (2 (12, N = 207) = 26.450, p < .05) may be
attributed to the Adventurers’ and Preservers’ preferences for spirits. The Learners were again
the most prominent craft beer consumers.
Purchasing motivators for locally produced beer
A one-way ANOVA was utilized to examine what motives consumers with different
lifestyles to purchase local craft beer. Of the seven purchasing motivators tested, four showed
significant differences among the clusters: ‘supporting the local economy’ F(4, 202) = 5.12, p =
.001; ‘desire to try something new’ F(4, 202) = 4.70, p= .001; ‘desire to try something local’,
F(4, 201) = 3.15, p = .015; and ‘it’s better for the environment’ F(4, 192) = 2.83, p = .026).
The Preservers and Tradesmen were similar in their attitudes toward the ‘supporting the
Adventurers and Learners. The Preservers were least driven by the desire to try something new,
while the other four clusters were highly motivated by the novelty factor when buying craft beer.
Likewise, the Preservers attributed significantly less importance to the desire to try something
local. Tradesmen and Conservatives were similar to each other in viewing environmental
consciousness as less important, while Learners and Adventurers viewed it as slightly more
important.
Insert Table IV about here
Discussion and implications for the industry
The study aimed to add to the body of knowledge about craft beer consumers by
developing consumer profiles and examining attitudes and purchase motivators of craft beer
consumers with different lifestyles.
Demographic profile (RQ1)
Previous research indicated that craft beer is a predominately male market (Murray &
O’Neill, 2012). Gender distribution in this study was about 60% males and 40% females. As
previously indicated, the craft beer market is growing rapidly. This leaves room for the
possibility that a significant part of the growth is due to females turning to craft beer, instead of
cocktails or wine. Secondly, due to the nature of the data collection, a certain percentage of
women may have accompanied their male partners, or friends, to the beer festival. Still, this
study indicates that more females are now geared towards craft beer. We suggest that the
industry pays closer attention to female craft beer drinkers.
The sample being highly educated was unsurprising, as previous studies showed that craft
beer consumers possess higher levels of education (Baginski & Bell, 2011). The age distribution,
This study found that craft beer appeals primarily to higher income individuals; so the industry
might want to focus on more affluent areas to market, host events, or even build a brewery in
those markets. Overall, craft beer consumers tend to be younger, mostly males, highly-educated,
and with the higher ranges of annual household income. This demographic profile is suggested
as the main target market for the industry.
Perceptions of locality (RQ2)
When it comes to agricultural products (including wine), there is no single definition of
‘locality’. The issue with discussing locality with reference to craft beer is that beer is made from
ingredients that can only be sourced from certain areas in the world (e.g. hops are primarily
grown in the Pacific Northwest). With over two-thirds of the respondents perceiving local craft
beer to be produced in the same state where it is consumed, it is reasonable to assume this can be
extrapolated to a more general agreement on consumer viewpoints of craft beer locality. These
perceptions of locality were fairly consistent with previous research on products with a sense of
place (Denver & Jensen, 2014; Hu et al., 2012). The results of the current study contribute to the
justification of using state lines as a definition of locality in terms of craft beer.
Lifestyle profiles (RQ3)
Based on the lifestyle factors that respondents most identified themselves with, five
clusters of craft beer consumers emerged: Adventurers, Preservers, Conservatives, Learners, and
Tradesmen.
The Adventurers were the most prevalent lifestyle grouping. Due to their desire to seek
variety, novelty, and a high aversion to stability, it is unsurprising that they constitute the largest
group of craft beer consumers. The craft beer industry should focus on consumers with these
also in the different producers that are accessible. The novelty component of the lifestyle group
may also be satisfied by limited releases and ‘rare’ beers that are available only in particular
establishments or communities. This is also the group that contained the most millennials, further
supporting the evidence that millennials are the largest driving force behind the growth of craft
beer. Due to the prevalence of this lifestyle cluster, and the behavioral cues that causes craft beer
to appeal to them, industry professionals should consider this segment as their target market.
Although the Preservers preferred beer for all consumption environments, the locality
aspect of the beer did not appeal to them. This group had the highest stability score on the
lifestyle measures and the lowest scores for variety and novelty seeking factors. These
consumers are most likely to be the target market for the larger, regional craft breweries that
have their product widely available.
The only cluster to have more females than males was the Conservatives group. These
consumers scored highly on ‘novelty’, ‘thrill seeking’, and ‘variety seeking’. It is not surprising
then that their main purchasing motivators for craft beer was a desire to try something new and
something local. With the growing number of women being interested in craft beer, the industry
needs to develop marketing messages to appeal to the Conservatives group by focusing on
originality and uniqueness of craft beer.
The Learners group were the most consistent consumers of craft beer in all consumption
environments; and they were adverse to drinking traditional beer. This could be due to their high
scores on the ‘intellectual,’ and ‘variety seeking’ factors. This group also placed high values on
the local purchasing motivators overall, and especially on supporting the local economy and
environmental consciousness. This lifestyle cluster would be the most appropriate target market
The least populous group was Tradesmen. The unique nature of craft beer was not
appealing to these consumers. Combined with their high ‘stability’ scores, it is reasonable to
assume that most people with these lifestyle characteristics are primarily traditional beer
drinkers, due to the consistent and reliable nature of those products. While it was the smallest
cluster, and may not seem yet open to the craft beer market, the industry could put forth an effort
to appeal and connect to the Tradesmen by sponsoring events that would draw that lifestyle (e.g.
car shows, woodworking expositions).
Lifestyle groups differences and similarities (RQ4)
Two demographic differences stood out: gender and ethnicity. The Conservative group
was the only one that had more women than men. The other deviation was the Tradesmen, where
the entire cluster was male. This was unsurprising as the defining feature of that cluster was the
‘tactile’ factor, entailing several blue-collar type of activities that historically are
male-dominated.
The ethnicity differences were largely represented in the Adventurers cluster, which
contained African American and Asian respondents. This is possibly due to the fact that the
Adventurers group was drawn more to variety, so it would be expected that ethnic diversity was
a part of that as well. The Conservatives cluster had the lowest level of diversity, with the vast
majority being Caucasian consumers.
For consumption behavior, most respondents chose beer as the most frequently consumed
alcoholic beverage. This was unremarkable since the data collection occurred at a craft beer
festival. The differences began appearing with the choice of consumption environments. Overall,
the Learners were more prone to choose craft beer in any consumption environment. The
an inclination for spirits consumption. This may be indicative of the development of craft
cocktails made with locally produced spirits and other ingredients, as a competitor with craft
beer. This may satisfy the desire to try something local while still having a high novelty value.
The Preservers and Tradesmen were predominately beer drinkers. With both clusters preferring
stability, it is likely that they stay with a limited number of preferred craft beers that they almost
exclusively drink, or they revert to drinking traditional beers. The Conservatives consistently
preferred wine in every consumption environment, which is understandable due to the highest
representation of women. However, they also showed preferences for craft beer in three
consumption environments, showing potential for craft beer drinking among female consumers.
The craft beer industry may appeal to this group through developing more beers that draw
females to transition from wine to craft beer. Possibly producing more mild fruit-forward beers,
or by using seasonal selections, would achieve this goal.
Looking at purchasing motivators for local craft beers, the desire to try something new,
and the desire to try something local were the two most important purchase drivers. However,
some differences were found among clusters. The Preservers were the least motivated by the
desire to try something new or something local. Since the Preservers prefer routine and are
opposed to novelty and variety seeking, it makes sense that they would have little inclination to
try new or locally-made products. Due to the Tradesmen’s propensity to stability, their
inclination to try something new was somewhat surprising. This may be a result of their high
variety-seeking score and high income levels, which would allow them to try new beers freely
and without perceived financial risks.
Other differences included the Preservers and Tradesmen having a much lower
supporting the local economy and their aversion to buying local products, it is reasonable to
assume that the Preserver and Tradesmen segments are not the target consumers for the local
craft beer movement. Since the Tradesmen’s defining factor is working with their hands, it
stands to reason that they contribute to local economies. This makes it surprising that they are
not compelled to support the local economy through purchasing local beer. The Tradesmen also
had a lower environment motivation for drinking craft beer, especially when comparted to the
Learners and Adventurers. There are numerous studies showing that education is tied to
environmental awareness (e.g., Aminrad, Sayed Berni, & Hadi, 2011; Diamantopoulos,
Schlegelmilch, Sinkovics, & Bohlen, 2003), so the differences between the clusters could
possibly be due to differing education levels, as the Tradesmen were the least educated group,
whereas the Learners and Adventurers were the two most highly educated groups.
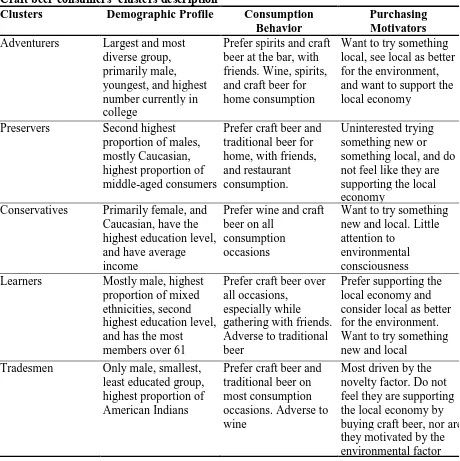
In summary, this study finds that lifestyle groupings are an effective way to segment the
craft beer consumer market. Table V summarizes the similarities and differences among the
clusters in terms of demographic profiles, various alcoholic beverages consumption behavior,
and craft beer purchasing motivators. Industry professionals may use the lifestyle findings to
hone their marketing practices. The study also found that using state lines as an indication of
locality for craft beer is an acceptable practice for the industry.
Insert Table V about here
Limitations and future research
While this study offered many insights for academic literature and the craft beer industry,
it is important to acknowledge its limitations. The sampling method and smaller sample size is a
limitation. The study utilized a convenience sampling strategy, where respondents were limited
results and conclusions drawn are generalizable to other markets. Replications of the study with
larger, more geographically and demographically diverse samples, are recommended. This
would enable researchers to examine the differences between various geographical areas and
various demographics, which could serve to further validate the findings of this research.
Since the purchasing motivations measures were adapted from previous studies
pertaining to other agricultural products, and not necessarily beer, all possible motivations for
local craft beer purchasing may not have been explored. Along the same lines, an alternative
lifestyle measurement tool may produce different results. Future research might focus on
developing a more comprehensive survey instrument to validate the findings of this study.
Future studies could also expand on purchasing motivations beyond primarily local
products motivators. The local motivators for this study were chosen to help fill the gap in
literature for the sense of place theory, but more broad motivational factors, such as price,
purchasing location, and packaging could be considered to contribute to the body of knowledge
on craft beer.
Conclusions
The current study aimed to add to the body of knowledge about the craft beer market by
developing profiles of South/Midwest U.S. craft beer consumers. Major findings of this study
indicated that craft beer consumers tend to be younger, mostly males, highly-educated, with
higher incomes. This study also articulated consumers’ perceptions of local craft beer, the
lifestyle types that are most prevalent among craft beer drinkers, and how lifestyle affects
consumption habits and purchasing decisions. To be considered local, consumers feel the beer
must be produced and consumed in the same state, or within 140 miles between production and
new and something local, along with the desire to support the local economy. Based on their
lifestyles, respondents were segmented into five groups. The research suggests that lifestyle
grouping is an effective way to segment the market. Findings on perceptions of locality and
purchasing motivators will help industry professionals refine their marketing practices to
References
Aminrad, Z., Sayed Berni, S.Z.B., & Hadi, A.S. (2011). Influence of age and level of education on environmental awareness and attitude: Case study on Iranian students in Malaysian universities. Social Sciences, 6(1), 15–19.
Baginski, J., & Bell, T.L. (2011). Under-tapped?: An analysis of craft brewing in the southern United States. Southeastern Geographer, 51(1), 165–185.
Brewers Association. (2015). National beer sales and production. Retrieved from
https://www.brewersassociation.org/statistics/national-beer-sales-production-data/
Carpio, C.E., & Isengildina-Massa, O. (2009). Consumer willingness to pay for locally grown products: The case of South Carolina. Agribusiness, 25(3), 412–426.
Darby, K., Batte, M.T., Ernst, S., & Roe, B. (2008). Decomposing local: A conjoint analysis of locally produced foods. American Journal of Agricultural Economics, 90(2), 476–486.
Denver, S., & Jensen, J.D. (2014). Consumer preferences for organically and locally produced apples. Food Quality & Preference, 31, 129–134.
Diamantopoulos, A., Schlegelmilch, B.B., Sinkovics, R.R., & Bohlen, G.M. (2003). Can socio-demographics still play a role in profiling green consumers? A review of the evidence and an empirical investigation. Journal of Business Research, 56(6), 465–480.
Eyles, J. (1985). Senses of place. Warrington, England: Silverbook Press.
Hay, R. (1988). Toward a theory of sense of place. Trumpeter, 5(4), 159–164.
Hede, A., & Watne, T. (2013). Leveraging the human side of the brand using a sense of place: Case studies of craft breweries. Journal of Marketing Management, 29(1–2), 37–41.
Hidalgo, M.C., & Hernandez, B. (2001). Place attachment: Conceptual and empirical questions. Journal of Environmental Psychology, 21(3), 273–281.
Hu, W., Batte, M.T., Woods, T., & Ernst, S. (2012). Consumer preferences for local production and other value-added label claims for a processed food product. European Review of Agricultural Economics, 39(3), 489–510.
Jorgensen, B.S., & Stedman, R.C. (2001). Sense of place as an attitude: Lakeshore owners’ attitudes toward their properties. Journal of Environmental Psychology, 21(3), 233–248.
Kahle, L., Beatty, S., & Homer, P. (1986). Alternative measurement approaches to consumer values: The list of values (LOV) and values and lifestyles (VALS). Journal of Consumer Research, 13(3), 405–409.
Kaltenborn, B.P. (1997). Nature of place attachment: A study among recreation homeowners in southern Norway. Leisure Sciences, 19(11), 175–189.
Lesch, W.C., Luk, S.H., & Leonard, T.L. (1991). Lifestyle and demographic influences on females’ consumption of alcoholic beverages. International Journal of Advertising, 10(1), 59–78.
Mitchell, A. (1983). The nine American lifestyles. New York, NY: Warner.
Murray, D.W., & O’Neill, M. (2012). Craft beer: Penetrating a niche market. British Food Journal,114(7), 899–909.
Orth, U.R., McDaniel, M., Shellhammer, T., & Lopetcharat, K. (2004). Promoting brand benefits: The role of consumer psychographics and lifestyle. Journal of Consumer Marketing, 21(2), 97–108.
Proshansky, H.M., Fabian, A.K., & Kaminoff, R., (1983). Place-identity: Physical world socialization of the self. Journal of Environmental Psychology, 3(1), 57–83.
Rubinstein, R.I., & Parmalee, P.A. (1992). Attachment to place and the representation of the life course by the elderly, In I. Altman, I., & S.M. Low (Eds.) Place Attachment (pp. 139-163). New York, NY: Springer Publishing.
Schnell, S.M. (2013). Food miles, local eating, and community supported agriculture: Putting local food in its place. Agriculture and Human Values, 30(4), 615–628.
Shumaker, S.A., & Hankin, J. (1984). The bonds between people and their residential environments: Theory and research. Population and Environment, 7(2), 59–60.
Uzzell, D., Pol, E., & Badenes, D. (2002), “Place identification, social cohesion and environmental sustainability”, Environment and Behavior, 34(1), 26–53.
Velikova, N., Charters, S., Bouzdine-Chameeva, T., Fountain, J., Ritchie C., & Dodd T.H. (2015). Seriously pink: A cross-cultural examination of the perceived image of rosé wine. International Journal of Wine Business Research, 27(4), 281–298.
Vyncke, P. (2002). Lifestyle segmentation: From attitudes, interests and opinions, to values, aesthetic styles, live visions, and media preferences. European Journal of
Communication, 17(4), 445–463.
Williams, D.R., Patterson, M.E., Roggenbuck, J.W., & Watson, A.E. (1992). Beyond the commodity metaphor: Examining emotional and symbolic attachment to place. Leisure Sciences, 14(1), 29–46.
Table I
Socio-demographic profile and consumption behavior of the sample (N=207)
Characteristic Frequency Percent
Gender Male 126 60.9
Female 81 39.1
Ethnicity Caucasian 181 87.4
American Indian 9 4.3
Hispanic/Latino 9 4.3
Black/African American 2 1.0
Asian 2 1.0
Other 4 1.9
Age 21-30 75 38.9
31-40 49 25.4
41-50 30 15.5
51-60 20 10.4
Over 60 19 9.8
Education High school not completed 2 1.0
High school diploma 16 7.7
Vocational/Technical school 7 3.4
Currently in college 20 9.7
Undergraduate degree 101 48.8
Graduate degree 61 29.5
Income Under $19,000 15 7.3
$20,000-$39,999 29 14.1
$40,000-$59,999 31 15.1
$60,000-$79,999 20 9.8
$80,000-$99,999 35 16.6
Over $100,000 76 37.1
Most often consumed alcoholic beverage
Wine 22 10.7
Beer 162 79.0
Spirits 21 10.2
Craft beer consumption frequency
Daily 37 17.9
Several times a week 73 35.3
About once a week 53 25.6
Several times a month 25 12.1
Table II
Factor analysis of lifestyle measures
Factor
Loading
Eigen Value
Reliability
Thrill Seeking 3.279 .802
I like outrageous people and things .632
I often crave excitement .615
I like a lot of excitement in my life .810
I am always looking for a thrill .640
Fashion Conscious 2.975 .858
I follow the latest trends and fashions .663 I dress more fashionable than most people .825 I like to dress in the latest fashions .867 I want to be considered fashionable .772
Tactile 2.726 .835
I am very interested in how mechanical things work .692 I like making things with my hands .818 I like making things of wood, metal, etc. .881 I like to look through hardware or automotive stores .631
Stability 2.126 .721
I am really only interested in a few things .853 I must admit my interest are narrow and limited .690 I like my life to be pretty much the same week to week .658
Novelty Seeking 1.948 .771
I like doing things that are new and different .635 I like the challenge of doing something I have never done
before
.628
Leadership 1.514 .758
I like being in charge of a group .729
I like to lead others .733
Intellectual 1.230 .550
I like to learn about art, culture, and history .503
I enjoy reading quietly .784
Variety Seeking 1.100 .747
I like a lot of variety in my life .554
Table III.
Clusters mean score for factor solution
Clusters
Factors
Adventurers
n=60
Preservers
n=49
Conservatives
n=40
Learners
n=40
Tradesmen
n=18
Thrill Seeking 4.26 3.21 3.35 3.95 3.58
Fashion Conscious 3.46 2.59 2.5 1.8 1.93
Tactile 3.55 3.64 2.17 4.2 4.39
Stability 2.18 3.31 2.33 1.91 3.19
Novelty Seeking 4.51 3.42 3.75 4.29 3.78
Leadership 4.19 3.17 3.43 3.03 2.89
Intellectual 3.92 3.65 3.88 4.3 2.14
Table IV
Local purchasing motivations for different craft beer consumers’ lifestyles
Mean SD F Sig.
Supporting the local economy Adventurers 4.38 .92 5.12 .001 Preservers 3.67 1.14
Conservatives 4.25 .84
Learners 4.43 .93
Tradesmen 3.89 .90
Desire to try something new Adventurers 4.58 .72 4.70 .001 Preservers 4.00 1.24
Conservatives 4.43 .64
Learners 4.60 .67
Tradesmen 4.72 .46
Desire to try something local Adventurers 4.52 .75 3.15 .015 Preservers 3.98 1.19
Conservatives 4.40 .71
Learners 4.50 .88
Tradesmen 4.53 .62
It is better for the environment Adventurers 3.54 1.04 2.83 .026 Preservers 3.09 .94
Table V
Craft beer consumers’ clusters description
Clusters Demographic Profile Consumption Behavior
Purchasing Motivators
Adventurers Largest and most diverse group, primarily male, youngest, and highest number currently in college
Prefer spirits and craft beer at the bar, with friends. Wine, spirits, and craft beer for home consumption
Want to try something local, see local as better for the environment, and want to support the local economy
Preservers Second highest
proportion of males, mostly Caucasian, highest proportion of middle-aged consumers
Prefer craft beer and traditional beer for home, with friends, and restaurant consumption.
Uninterested trying something new or something local, and do not feel like they are supporting the local economy
Conservatives Primarily female, and Caucasian, have the highest education level, and have average income
Prefer wine and craft beer on all
consumption occasions
Want to try something new and local. Little attention to
environmental consciousness Learners Mostly male, highest
proportion of mixed ethnicities, second highest education level, and has the most members over 61
Prefer craft beer over all occasions,
especially while gathering with friends. Adverse to traditional beer
Prefer supporting the local economy and consider local as better for the environment. Want to try something new and local
Tradesmen Only male, smallest, least educated group, highest proportion of American Indians
Prefer craft beer and traditional beer on most consumption occasions. Adverse to wine
Most driven by the novelty factor. Do not feel they are supporting the local economy by buying craft beer, nor are they motivated by the environmental factor