DETERMINING THE EFFECTS OF
CUTTING PARAMETERS ON
WORKPIECE-TOOL INTERFACE
TEMPERATURE DURING TURNING OF
AISI 1020 STEEL USING TAGUCHI
APPROACH
MANDEEP SINGH
Department of Mechanical Engineering, SSGI, Pathankot, Pathankot, Punjab-145001, India
ASHWANI KUMAR
Department of Mechanical Engineering, SSGI, Pathankot, Pathankot, Punjab-145001, India
Abstract : For a successful machining operation, controlling the workpiece-tool interface temperature is an important criterion. The value of optimum machining parameters (for lower workpiece-tool interface temperature ) can be either decided on the basis of a large number of experimental trails or design of experiments (DoE) can be used to predict the same with significantly lesser number of experimental trails. The aim of this work was to reveal the application of Taguchi method to study the effect of the machining/cutting parameters on workpiece-tool interface temperature during turning of AISI 1020 steel under different cutting environments. Using MINITAB software, statistical techniques analysis of variance (ANOVA) were also performed to confirm results of Taguchi analysis. The results demonstrated that the application of cutting fluids produced significantly different results in form of workpiece-tool interface temperature as compared to dry turning.
Keywords: Machining; Turning; Temperature; Steel; Taguchi; ANOVA, MINITAB. 1. Introduction
effect of cutting parameters on the workpiece-tool temperature during turning of AISI 1020 steel are still to be established. So in this study, AISI 1020 steel was turned with HSS tool with similar cutting parameters in dry as well as wet environment to study their effect on workpiece-tool temperature. Two types of cutting fluids were also investigated: straight cutting fluid (mineral oil) and water based cutting fluid.
2. Materials and Methods
The conventional lathe machine (Kirloskar, India) was used for turning of AISI 1020 steel by using HSS M-series tool (Trident Tools Pvt. Ltd, India). Turning process was carried out in three different cutting environments: dry, wet turning with water based cutting fluid (water:cutting fluid = 25:1) and wet turning with mineral oil as cutting fluid. The two types of cutting fluids used in this study i.e. straight cutting oil and water based cutting fluid having flash point 226 °C and 160 °C, respectively . The cutting parameters and their factoe levels considered in this study are shown in table 1. The experimental layout was based on the L9 orthogonal array and is shown in table 2. To measure the workpiece-tool interface temperature digital infrared thermometer MEXTECH - 8811 having range between -50°C to 550°C was used. For each experimental run, five different workpieces were turned and average value of workpiece-tool temperature is reported in this work. MINITAB 17 software was utilised for the statistical analysis of response data, which included Taguchi (S/N ratio) analysis and analysis of variance (ANOVA).
Table 1 Factor levels of cutting parameters
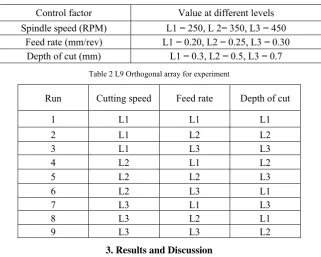
Control factor Value at different levels Spindle speed (RPM) L1 = 250, L 2= 350, L3 = 450
Feed rate (mm/rev) L1 = 0.20, L2 = 0.25, L3 = 0.30 Depth of cut (mm) L1 = 0.3, L2 = 0.5, L3 = 0.7
Table 2 L9 Orthogonal array for experiment
Run Cutting speed Feed rate Depth of cut
1 L1 L1 L1 2 L1 L2 L2 3 L1 L3 L3 4 L2 L1 L2 5 L2 L2 L3 6 L2 L3 L1 7 L3 L1 L3 8 L3 L2 L1 9 L3 L3 L2
3. Results and Discussion 3.1 Dry Turning
The value of workpiece-tool temperature and corresponding S/N ratio is mentioned in table 3. As per orthogonal experimental design, it is possible to differentiate the effect of each cutting parameter at different level. For example, the mean S/N ratio for the spindle speed at levels 1, 2 and 3 can be calculated by averaging the S/N ratios for the experiments 1–3, 4–6, and 7–9, respectively. The mean S/N ratio for each level of the cutting parameters is summarized and called the mean S/N response table for that specific parameter. The mean S/N response table for workpiece-tool temperature is as table 4.
Table 3 workpiece-tool temperature and S/N ratio values for dry turning
Run Ra (μm) S/N Ratio
1 104.55 -40.38
2 108.01 -40.66
3 115.07 -41.21
4 108.64 -40.71
5 126.50 -42.04
6 118.05 -41.44
7 169.48 -44.58
8 155.02 -43.80
Table 4 Mean S/N response table for workpiece-tool temperature for dry turning
Level Spindle speed Feed rate Depth of cut
1 - 40.76 - 41.90 - 41.88
2 - 41.40 - 42.17 - 41.87
3 - 44.21 - 42.30 - 42.61
Delta 3.44 0.40 0.74
Rank 1 3 2
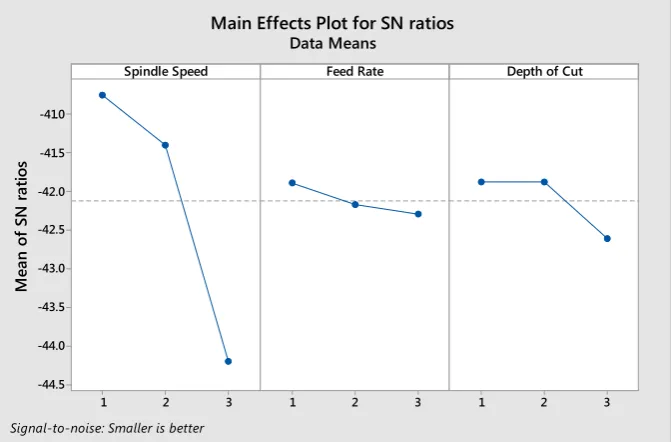
In the table 4, value of ‘Delta’ reveals the difference in highest and lowest mean response of levels for the corresponding cutting parameter. ‘Rank’ describes the relative influence of cutting parameter on response. So from table 4 it is observed that spindle speed had greatest influence on workpiece-tool temperature followed by federate and depth of cut. The main effect plot for workpiece-tool temperature is given in figure 1. In the plots, x-axis indicates the value of each cutting parameter at three level and y-axis indicates the response value. Optimal factor settings for optimum response are obtained through the main effects plot. In Taguchi analysis, optimum response is obtained by maximizing S/N ratio. Figure 1 shows that to reduce level of workpiece-tool interface temperature, spindle speed, feed rate and depth of cut should be set to their lowest level.
3 2 1 -41.0
-41.5
-42.0
-42.5
-43.0
-43.5
-44.0
-44.5
3 2
1 1 2 3
Spindle Speed
Me
an
o
f S
N
ra
tio
s
Feed Rate Depth of Cut Main Effects Plot for SN ratios
Data Means
Signal-to-noise: Smaller is better
Fig. 1 The main effects plot for S/N ratios of workpiece-tool interface temperature for dry turning
General Linear Model (GLM) was used in analysis of variance (ANOVA) of workpiece-tool interface temperature. In ANOVA, the 95% confidence level was chosen to determine the factors effect on the workpiece-tool interface temperature. Table 5 shows the results of ANOVA for workpiece-tool interface temperature. Factors having ‘p-value’ less than 0.05 are significant. The percentage contribution of each factor is represented by corresponding ‘ %C ’ value.
Table 5 spindle speed was the most significant factor which effected workpiece-tool interface temperature having percentage contribution up to 93.84%. After that, second influencing factor was depth of cut having percentage contribution up 4.50% and feed rate had very little role to play on workpiece-tool interface temperature. It is the same order of significance for the cutting parameters on workpiece-tool interface temperature which was observed in table 4.
Table 5 ANOVA table for workpiece-tool interface temperature for dry turning
Source DoF Adj SS Adj MS F- value p-value %C
Spindle speed 2 4905.01 2452.50 85.79 0.012 93.84
Feed rate 2 29.36 14.68 0.51 0.661 0.56
Depth of cut 2 235.36 117.68 4.12 0.195 4.50
Error 2 57.18 28.59 - - 1.10
3.2 Wet turning with water based Cutting fluid
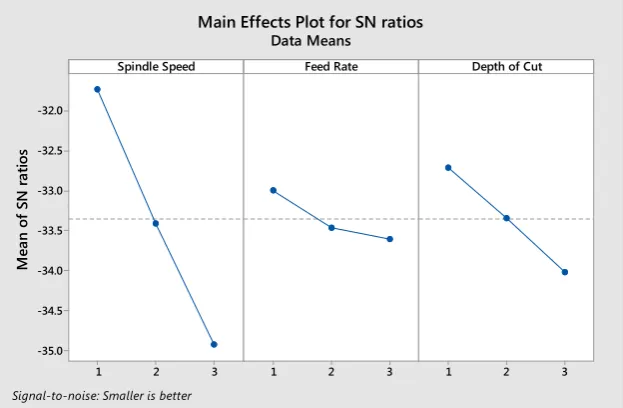
The value of workpiece-tool interface temperature and corresponding S/N ratio and the mean S/N response table for workpiece-tool interface temperature are mentioned in table 6 and table 7, respectively. From the table7, it is observed that spindle speed had highest impact on workpiece-tool interface temperature and depth of cut had greater influence than feed rate. The main effect plots for workpiece-tool interface temperature is given in figure 2, which shows that to reduce level of workpiece-tool interface temperature, spindle speed, feed rate and depth of cut should be set to their lowest level.
Table 6 Ra and S/N ratio values for workpiece-tool interface temperature wet turning with water based fluid
Table 7 Mean S/N response table for workpiece-tool interface temperature for wet turning with water based fluid
Level Spindle speed Feed rate Depth of cut
1 -31.73 -32.99 -32.71
2 -33.41 -33.47 -33.34
3 -34.93 -33.61 -34.02
Delta 3.20 0.61 1.31
Rank 1 3 2
Table 8 shows the results of ANOVA for workpiece-tool interface temperature obtained in wet turning with water based fluid. From table 8, it is confirmed that that spindle speed was the most significant factor which affected workpiece-tool interface temperature having percentage contribution up to 84.46%. After that, second influencing factor was depth of cut having percentage contribution up 12.79% and feed rate had very little role to play on workpiece-tool interface temperature. It is the same order of significance for the cutting parameters which was observed in table 7.
3 2 1 -32.0
-32.5
-33.0
-33.5
-34.0
-34.5
-35.0
3 2
1 1 2 3
Spindle Speed
M
ea
n of
S
N
ra
tios
Feed Rate Depth of Cut Main Effects Plot for SN ratios
Data Means
Signal-to-noise: Smaller is better
Fig. 2 The main effects plot for S/N ratios of workpiece-tool interface temperature for wet turning with water based fluid
Run Ra (μm) S/N Ratio
Table 8 ANOVA table for workpiece-tool interface temperature obtained in wet turning with water based fluid.
Source DoF Adj SS Adj MS F- value p-value %C
Spindle speed 2 434.687 217.343 37.67 0.026 83.46
Feed rate 2 7.904 3.952 0.68 0.594 1.51
Depth of cut 2 66.639 33.320 5.77 0.148 12.79
Error 2 11.541 5.770 - - 2.24
Total 8 520.772 - - - -
3.3 Wet Turning with Mineral oil as cutting Fluid
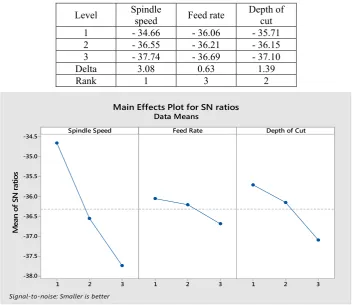
The value of S/N ratio for workpiece-tool interface temperature for each experimental run is given in table 9. The mean S/N response table for workpiece-tool interface temperature is given as table 10. From the table 10, similarly to the wet turning with water based cutting fluid, spindle speed had greatest influence on workpiece-tool interface temperature as well as in this case. Similarly, depth of cut was the second influencing factor followed by feed rate in case of workpiece-tool interface temperature in this case also. The main effect plot for workpiece-tool interface temperature is given in figure 3. It shows that in this case also to reduce level of workpiece-tool interface temperature; all three parameters should be adjusted to their lowest level.
Table 9 S/N ratio values for workpiece-tool interface temperature for wet turning with mineral oil as cutting fluid
Run Ra (μm) S/N Ratio
1 47.96 -33.61 2 52.74 -34.44 3 62.55 -35.92 4 64.85 -36.23 5 71.23 -37.05 6 65.79 -36.36 7 82.32 -38.31 8 71.92 -37.13 9 77.43 -37.77
Table 10 Mean S/N response table of workpiece-tool interface temperature for wet turning with mineral oil as cutting fluid
Level Spindle speed Feed rate Depth of cut
1 - 34.66 - 36.06 - 35.71
2 - 36.55 - 36.21 - 36.15
3 - 37.74 - 36.69 - 37.10
Delta 3.08 0.63 1.39
Rank 1 3 2
3 2 1 -34.5
-35.0
-35.5
-36.0
-36.5
-37.0
-37.5
-38.0
3 2
1 1 2 3
Spindle Speed
Me
an
o
f S
N
ra
tio
s
Feed Rate Depth of Cut Main Effects Plot for SN ratios
Data Means
Signal-to-noise: Smaller is better
Table 11 shows the results of ANOVA for workpiece-tool interface temperature. Table 11 confirms the results of table 10, i.e. spindle speed was the most significant factor which affected workpiece-tool interface temperature having percentage contribution up to 80.62%. After that, second influencing factor was depth of cut having percentage contribution up 16.64% and feed rate had very little role to play on workpiece-tool interface temperature.
Table 11 ANOVA table for workpiece-tool interface temperature for wet turning with mineral oil as cutting fluid
Source DoF Adj SS Adj MS F- value p-value %C
Spindle speed 2 784.538 392.269 256.54 0.004 80.62
Feed rate 2 23.489 11.745 7.68 0.115 2.41
Depth of cut 2 161.975 80.987 52.96 0.019 16.64
Error 2 3.058 1.529 - - 0.33
Total 8 973.060 - - - -
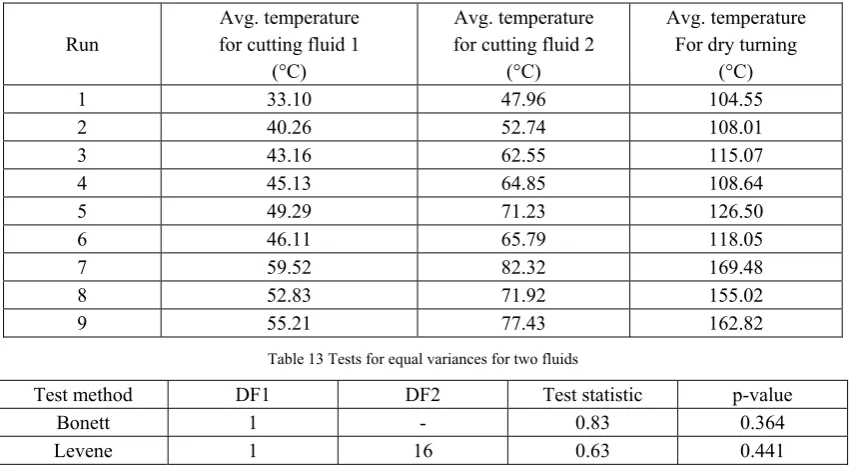
3.4 Comparison of different machining environments with tests for equal variances
Cooling characteristics of the three cutting environments were compared using two tests namely Bonett test and Levene test assuming equal population variances. The value of average workpiece-tool interface temperature,
for corresponding experimental runs, for different cases is given in table 4.25.
The result of two tests namely Bonett test and Levene test, to prove that variances are equal for workpiece-tool interface temperature for two fluids are given in table 13. Both the tests were carried out at 95% confidence level. The variances of workpiece-tool interface temperature values of two fluids were assumed to be equal and the hypothesis was tested using tests given in table 13. The hypothesis was found true as p-value in any of the test is not less than 0.05; hence it can be concluded that there was no significant difference in variances of workpiece-tool interface temperature produced by two different cutting fluids.
Table 12 Average workpiece-tool interface temperature for cutting fluids
Run
Avg. temperature for cutting fluid 1
(°C)
Avg. temperature for cutting fluid 2
(°C)
Avg. temperature For dry turning
(°C)
1 33.10 47.96 104.55
2 40.26 52.74 108.01
3 43.16 62.55 115.07
4 45.13 64.85 108.64
5 49.29 71.23 126.50
6 46.11 65.79 118.05
7 59.52 82.32 169.48
8 52.83 71.92 155.02
9 55.21 77.43 162.82
Table 13 Tests for equal variances for two fluids
Test method DF1 DF2 Test statistic p-value
Bonett 1 - 0.83 0.364
Levene 1 16 0.63 0.441
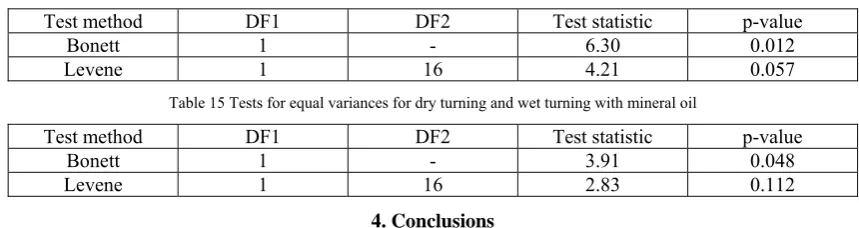
Table 14 Tests for equal variances for dry turning and wet turning with water based cutting fluid
Test method DF1 DF2 Test statistic p-value
Bonett 1 - 6.30 0.012
Levene 1 16 4.21 0.057
Table 15 Tests for equal variances for dry turning and wet turning with mineral oil
Test method DF1 DF2 Test statistic p-value
Bonett 1 - 3.91 0.048
Levene 1 16 2.83 0.112
4. Conclusions
This study has presented the application of Taguchi design of experiments and statistical method like S/N ratio analysis and ANOVA method for studying the effect of different cutting parameters on workpiece-tool interface temperature during dry and wet turning of AISI 1020. In wet turning two different types of cutting fluids,, namely water based cutting fluid and mineral oil were used. The following conclusions were drawn from from the experiment.
In case of all the cases , spindle speed was the most significant factor which affected workpiece-tool interface temperature. After that second influencing factor was depth of cut followed by feed rate.
The tests for equal variances proved that the application of both the cutting fluids produced a significant difference in workpiece-tool interface temperature when compared to dry turning.
No significant difference in workpiece-tool interface temperature was observed when both the cutting fluids were compared to each other.
For further study new factors like different tool geometry, fluid flow rate, workpiece materials could be considered, a new type of experimental design and statistical analysis could be used, no interaction of factors was considered in the experiment, and interactions could be considered using larger designs from experimental designs.
References
[1] Abhang, L.B. and Hameedullah, M., (2014): Parametric investigation of turning process on en-31 steel. Procedia Materials Science, 6, pp.1516-1523.
[2] Azam, M., Jahanzaib, M., Wasim, A. and Hussain, S., (2015): Surface roughness modeling using RSM for HSLA steel by coated carbide tools. The International Journal of Advanced Manufacturing Technology, 78(5-8), pp.1031-1041.
[3] Ciftci, I., (2006): Machining of austenitic stainless steels using CVD multi-layer coated cemented carbide tools. Tribology International, 39(6), pp.565-569.
[4] Debnath, S., Reddy, M.M. and Yi, Q.S., (2016): Influence of cutting fluid conditions and cutting parameters on surface roughness and tool wear in turning process using Taguchi method. Measurement, 78, pp.111-119.
[5] Dhiman, S., Sehgal, R., Sharma, S.K. and Sharma, V.S., (2008): Machining behavior of AlSI 1018 steel during turning. Journal of Scientific and Industrial Research, 67(5), p.355.
[6] Dornfeld, D.A.; Helu, M.M (2007): Precision Manufacturing, First Edition, Springer Publishing: Midtown Manhattan, New York City. [7] Juneja, B.L.; Seth, N.; Sekhon, G.S. (2003): Fundamentals of Metal Cutting and Machine Tools, Second Edition, New Age
Publications: Daryaganj, New Delhi.
[8] Khan, M.M.A., Mithu, M.A.H. and Dhar, N.R., (2009): Effects of minimum quantity lubrication on turning AISI 9310 alloy steel using vegetable oil-based cutting fluid. Journal of materials processing Technology, 209(15), pp.5573-5583.
[9] Reddy, S.; Kumar, S; Rao, P., (2005): A Genetic Algorithm Approach for Optimization of Surface Roughness Prediction Model in Dry Milling, Machining Science and Technology - An International Journal, pp. 63-81.
[10] Patel, J.M. and Panchal, P.,( 2014): Parametric Analysis of Dry and Wet Turning on CNC Lathe using Design Of Experiment, International Journal For Technological Research In Engineering, 1(9), pp. 686-694.
[11] Dhar, S.; Islam, M.; Kamruzzaman, S.; Paul, R., (2006): Wear Behaviour of Uncoated Carbide Inserts under Dry, Wet and Cryogenic Cooling Conditions in Turning C-60 Steel, Journal of Brazilian Society of Mechanical Science and Engineering, 28, pp. 146-152. [12] Suresh, R., Basavarajappa, S. and Samuel, G.L., (2012): Some studies on hard turning of AISI 4340 steel using multilayer coated