https://doi.org/10.5194/os-15-853-2019
© Author(s) 2019. This work is distributed under the Creative Commons Attribution 4.0 License.
Tidal variability in the Hong Kong region
Adam T. Devlin1,2,3, Jiayi Pan1,2,3, and Hui Lin1,2
1School of Geography and Environment, Jiangxi Normal University, Nanchang, Jiangxi, China 2Institute of Space and Earth Information Science, The Chinese University
of Hong Kong, Shatin, Hong Kong SAR, China
3Shenzhen Research Institute, The Chinese University of Hong Kong, Shenzhen, Guangdong, China
Correspondence:Jiayi Pan (panj@cuhk.edu.hk)
Received: 15 May 2018 – Discussion started: 11 June 2018
Revised: 29 May 2019 – Accepted: 5 June 2019 – Published: 4 July 2019
Abstract. Mean sea level (MSL) is rising worldwide, and correlated changes in ocean tides are also occurring. This combination may influence future extreme sea levels, pos-sibly increasing coastal inundation and nuisance flooding events in sensitive regions. Analyses of a set of tide gauges in Hong Kong reveal complex tidal behavior. Most prominent in the results are strong correlations of MSL variability to tidal variability over the 31-year period of 1986–2016; these tidal anomaly correlations (TACs) express the sensitivity of tidal amplitudes and phases (M2,S2,K1,O1) to MSL fluctu-ations and are widely observed across the Hong Kong region. At a few important harbor locations, time series of approx-imations of the parameterδ-HAT, computed from combina-tions of the major tidal constituents, are found to be highly sensitive to MSL variability, which may further increase cal flood levels under future MSL rise. Other open-water lo-cations in Hong Kong only show TACs for some individ-ual tidal constituents but not for combined tidal amplitudes, suggesting that the dynamics in enclosed harbor areas may be partially frequency dependent and related to resonance or frictional changes. We also observe positive correlations of the fluctuations of diurnal (D1) tides to semidiurnal (D2) tides at most locations in the region, which may lead to fur-ther amplified tidal ranges under MSL. It is demonstrated here that tidal changes in the Hong Kong coastal waters may be important in combination with MSL rise in impacting fu-ture total water levels.
1 Introduction
Ocean tides have long been thought of as a stationary pro-cess as they are driven by the gravitational forcing of the Sun and Moon whose motions are complex but highly predictable (Cartwright and Tayler, 1971). Yet, long-term changes in the tides have been observed recently on regional (Ray, 2006; Jay, 2009; Zaron and Jay, 2014; Rasheed and Chua, 2014; Feng et al., 2015; Ross et al., 2017) and global spatial scales (Woodworth, 2010; Müller et al., 2011; Haigh et al., 2014; Mawdsley et al., 2014), concurrent with long-term global mean sea level (MSL) rise (Church and White, 2006, 2011). Since gravitational changes are not the reason for this, the tidal changes are likely related to terrestrial factors such as changes in water depth – which can alter friction (Arbic et al., 2009), coastal morphology, and resonance changes in harbor regions (Cartwright, 1972; Bowen and Gray, 1972; Amin, 1983; Vellinga et al., 2014; Jay et al., 2011; Chernet-sky et al., 2010; Familkhalili and Talke, 2016) – or stratifi-cation changes induced by increased upper-ocean warming (Domingues et al., 2008; Colosi and Munk, 2006; Müller, 2012; Müller et al., 2012), all of which are also related to sea level rise.
fluctuations may amplify this variability and would imply that flood risk based only on the superposition of present-day tides and surge onto a higher baseline sea level will be inaccurate in many situations. The analysis of the correla-tions between tides and sea level at a local or regional scale can indicate locations where tidal evolution should be con-sidered a substantial complement to sea level rise. Moreover, since storm surge is a long-wave process, factors affecting tides can also alter storm surge (Familkhalil and Talke, 2016; Arns et al., 2017). Hong Kong is often subject to typhoons, with some recent storms yielding anomalously high storm surges, so this issue is of critical interest if all such factors are undergoing change.
Recent works surveyed tidal anomaly correlations (TACs) at multiple locations in the Pacific; a TAC quantifies the sen-sitivity of tides to short-term sea level fluctuations (Devlin et al., 2014, 2017a); they found that over 90 % of tide gauges analyzed exhibited some measure of correlation in at least one tidal component. In a related work (Devlin et al., 2017b), the combined TACs of the four largest tidal components was calculated as a proxy for what can be described as changes in the highest astronomical tide (δ-HAT), with 35 % of gauges surveyed exhibiting a sensitivity ofδ-HATs to sea level fluc-tuations of at least ±50 mm under a 1 m sea level change (∼5 %). A step-by-step description of the TAC andδ-HAT methods, including the details of the calculations of the re-gressions and statistics, can be found in the supplementary materials of Devlin et al. (2017a, b), and in this paper we summarize the meaning and interpretations of the TACs and theδ-HATs in the Appendix.
A recent paper performed a similar analysis in the Atlantic Ocean, finding comparable results to the Pacific (Devlin et al., 2019). Comparing all worldwide locations found that the greatest (positive)δ-HAT response was seen in Hong Kong (+650 mm m−1). A probability distribution function analysis revealed that an extreme sea level exceedance which includes tidal changes can be nearly double (+150 mm) that which only considers MSL exceedance alone (+78 mm) over the past 50 years (Devlin et al., 2017b). However, this approach did not consider water level extremes due to nontidal or non-MSL factors, such as storm surge, which may further compli-cate extreme water levels. Yet, even without storm surge in-cluded, it was demonstrated that the nonstationarity of tides can be a significant contributor to total (non-storm) water lev-els in this region and warrants closer examination. Further-more, tides and storm surge are both long-wave processes and may be sensitive to the same forcing factors, so the havior of tides may be a possible instructor of the future be-havior of storm surge events.
Hong Kong and Pearl River Delta (PRD) regions contain many densely populated areas with extensive coastal infras-tructure and significant and continuous recent land reclama-tion projects. Sea level rise in the region has exhibited a vari-able rate in the region over the past 50 years (Li and Mok, 2012; Ip and Wai, 1990) but a common feature of all sea
level records in the South China Sea (SCS) is a steep in-crease in the late 1990s with a subsequent dein-crease in the early 2000s, followed by a sustained increase to the present day. In addition to this variable MSL behavior, there are also anomalous tidal events observed at gauges in semi-enclosed harbor regions during the late 1990s and early 2000s (shown and discussed below), corresponding to times of both rapidly changing sea level and aggressive land reclamation. In this study, we perform a spatial and temporal analysis of tidal sensitivity to MSL variations in Hong Kong using the tidal anomaly correlation (TAC) method at 12 closely located tide gauges.
2 Methods 2.1 Data sources
A set of 12 tide gauge records in the Hong Kong region was provided by the Hong Kong Observatory (HKO) and the Hong Kong Marine Department (HKMD), spanning from 12 to 63 years in length, including two gauges that are “his-torical” (i.e., no longer operational). The longest record is the North Point/Quarry Bay tide gauge, located in Victoria Har-bour, established originally in 1952 and relocated from North Point to Quarry Bay in 1986. The datums were adjusted and quality controlled by HKO to provide a continuous record (Ip and Wai, 1990). Another long and continuous record is lo-cated at Tai Po Kau inside Tolo Harbour. Gauge locations in Hong Kong are shown in Fig. 1, with the gauges from HKO indicated by green markers, gauges from HKMD by light blue, and historical (nonoperational) gauges by red. Four of six of the HKO gauges (Quarry Bay, Tai Po Kau, Tsim Bei Tsui, and Waglan Island) are sea level pressure transducer types, and the other two (Shek Pik and Tai Miu Wan) are pneumatic-type tide gauges. The Quarry Bay gauge was re-cently updated from a float-type gauge (2017), and the Tai Po Kau gauge was also updated from a float gauge in 2006, and all gauges operated by the HK Marine Department were set up in 2004 as sea level pressure transducers (https://www. hko.gov.hk/publica/pubsmo.htm, last access: 1 June 2019).
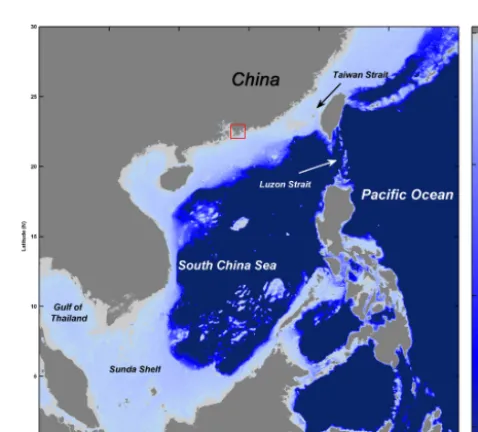
Figure 2 shows the geographical setting of the South China Sea, with the location of Hong Kong indicated by the red box. Table 1 lists the metadata for all locations, including station name and station code, latitude, etc., and the ranges of the data records used in this study.
2.2 Tidal admittance calculations
Table 1.Metadata for all tide gauge locations, giving the station names and station codes, latitude/longitude, year of the available records, and the range of data analyzed.
Station Latitude Longitude Start End Number of year year years used
Quarry Bay (QB) 22.27◦N 114.21◦E 1954 2016 31 (1986–2016) Tai Po Kau (TPK) 22.42◦N 114.19◦E 1963 2016 31 (1986–2016) Tsim Bei Tsui (TBT) 22.48◦N 114.02◦E 1974 2016 31 (1986–2016) Chi Ma Wan (CMW) 22.22◦N 114.00◦E 1963 1997 36 (1963–1997) Cheung Chau (CHC) 22.19◦N 114.03◦E 2004 2016 12 (2004–2016) Lok On Pai (LOP) 22.35◦N 114.00◦E 1981 1999 18 (1981–1999) Ma Wan (MW) 22.35◦N 114.06◦E 2004 2016 12 (2004–2016) Tai Miu Wan (TMW) 22.26◦N 114.29◦E 1996 2016 20 (1996–2016) Shek Pik (SP) 22.21◦N 113.89◦E 1999 2016 17 (1999–2016) Waglan Island (WAG) 22.17◦N 114.30◦E 1995 2016 21 (1995–2016) Ko Lau Wan (KLW) 22.45◦N 114.34◦E 2004 2016 12 (2004–2016) Kwai Chung (KC) 22.31◦N 114.12◦E 2004 2016 12 (2004–2016)
Figure 1.Tide gauge locations in Hong Kong used in this study. Green markers indicate active gauges provided by the Hong Kong Observatory (HKO), light blue markers indicate gauges provided by the Hong Kong Marine Department (HKMD), and red markers indicate historical gauges (once maintained by HKO) that are no longer operational.
Yearly harmonic analyses are performed on bothZobs(t )and Zpot(t ) at each location using the R_T_TIDE package for MATLAB (Leffler and Jay, 2009), a robust analysis suite based on T_TIDE (Pawlowicz et al., 2002). The tidal poten-tial is determined based on the methods of Cartwright and Tayler (1971).
The result from a single harmonic analysis of Zobs(t )or Zpot(t )determines an amplitude,A, and phase,θ, at the cen-tral time of the analysis window for each tidal constituent, with error estimates. A moving analysis window (e.g., at mid-year) produces an annual time series of amplitude,A(t ), and phase,θ (t ), with the complex amplitude,Z(t ), given by
Z(t )=A(t )eiθ (t ). (1)
Figure 2.Location of Hong Kong in the South China Sea shown by the red box with some major oceanographic features labeled. Depth is given by the color bar in units of meters.
The tidal admittance (A) and phase lag (P) are formed using Eqs. (2) and (3)
A(t )=abs
Zobs(t ) Zpot(t )
, (2)
always hold true in shallow-water areas (Amin, 1983) but does seem valid for the locations and tides analyzed in Hong Kong. The harmonic analysis procedure also provides an an-nual MSL time series. For each resultant dataset (MSL, A andP), the mean and trend are removed from the time series to allow direct comparison of their covariability. The magni-tude of the long-term trends is typically much less than the magnitude of the short-term variability, which is more appar-ent in the datasets used here (Devlin et al., 2017a, b).
Tidal sensitivity to sea level fluctuations is quantified us-ing tidal anomaly correlations (TACs), the relationships of detrended tidal variability to detrended MSL variability (see Appendix). With the use of the TACs we determine the sen-sitivity of the amplitude and phase of individual constituents (M2, S2,K1, O1) to sea level perturbations at the yearly-analyzed scale. We also consider a proxy for the change in the approximate highest astronomical tide (δ-HAT; see Ap-pendix for details). The approximation δ-HAT reflects the maximum tide-related water level that would be obtained in a year from a combination of time-dependent amplitudes and phases of the four largest tidal constituents (M2,S2,K1, and O1) extracted by the admittance method, typically∼75 % of the full tidal range.
The detrended time series of the year-to-year change in the δ-HATs are compared to detrended yearly MSL variability in an identical manner as the TACs, and both are expressed in units of millimeter change in tidal amplitude per 1 m fluc-tuation in sea level (mm m−1). These units are adopted for convenience, though in practice the observed fluctuations in MSL are on the order of∼0.25 m. The phase TACs are re-ported in units of degree change per 1 m fluctuation in sea level. The TAC methodology can also be used to examine correlations between different parts of the tidal spectrum. We additionally examine the sensitivity of combined diurnal (D1:K1+O1) tidal amplitudes to semidiurnal (D2:M2+S2) tidal amplitudes (D1/D2 TACs). The units of the D1/D2 TACs are dimensionless (i.e., mm mm−1) and statistics are calculated as above.
The use of a window of a year in a harmonic analysis may have an influence on the value of the TAC orδ-HAT, e.g., calendar year (January–December) vs. water year (October– September). To provide a better estimate of the overall cor-relations for all data we take a set of determinations of the correlations using 12 distinct year definitions (i.e., 1-year windows running from January–December, February– January, . . . , December–January). We take the average of the set of significant determinations (i.e.,pvalues of<0.05) as the magnitude of the TAC orδ-HAT. For an estimate of the confidence interval of the TAC or δ-HAT, the interquartile range (middle 50 % of the set) is used.
For the very long record stations (e.g., Quarry Bay and Tai Po Kau), we only consider the past 31 years for TAC and δ-HAT determinations (Table 1). The TAC values may change over time so we adopt a common epoch to better match the rest of the Hong Kong tide gauge networks, which are
typi-cally∼12–31 years long. Finally, we highlight some anoma-lous tidal events observed at certain Hong Kong gauges and discuss the temporal evolution of the tidal characteristics in Hong Kong.
3 Results
The individual TACs for amplitude and phase in Hong Kong are discussed first, followed by theδ-HATs and theD1/D2 TACs. In all figures, significant positive results will be re-ported by red markers, significant negative results by blue markers, and insignificant values are shown as black mark-ers. The relative size of the markers will indicate the rela-tive magnitude of the TAC orδ-HAT according to the legend scale on each plot. All numerical results for the major ampli-tude TACs (M2,S2,K1, andO1) are listed in Table 2, and the δ-HATs andD1/D2TACs are listed in Table 3. Phase TACs of the individual constituents are reported in Table S1 of the Supplement.
3.1 Tidal anomaly correlations (TACs)
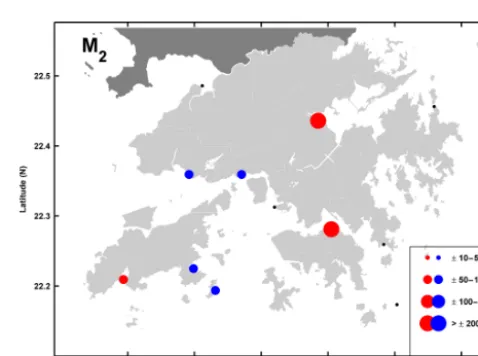
The strongest positive M2 TACs are seen at Quarry Bay (+218±37 mm m−1) and at Tai Po Kau (+267±42 mm m−1) with a smaller positive TAC seen at Shek Pik (Fig. 3). In the waters west of Victoria Harbour, all other gauges except Kwai Chung exhibit moderate negative TACs. The semidi-urnal phase TACs in Hong Kong (shown in the Supplement, Fig. S1) show an earlierM2tide under higher MSL at Quarry Bay and Tai Po Kau and a later tide west of Victoria Harbour. TheS2results in Hong Kong (Fig. 4) show that only Quarry Bay and Tai Po Kau have significant amplitude TAC values (though smaller thanM2) and theS2-phase TACs in Hong Kong (Fig. S2) also show an earlier tide at Quarry Bay and Tai Po Kau under higher MSL.
The diurnal TACs in Hong Kong generally exhibit a larger-magnitude and more spatially coherent response than semid-iurnal TACs. Like M2, the strongest K1 values in Hong Kong (Fig. 5) are seen at Quarry Bay (+220±15 mm m−1) and Tai Po Kau (+190±68 mm m−1). The O1 results in Hong Kong (Fig. 6) are like the M2 results showing posi-tive TACs at Quarry Bay (+146±11 mm m−1) and Tai Po Kau (+100±25 mm m−1) and strongly negative TACs west of Quarry Bay. However, unlike the semidiurnal constituents, the phase TACs forK1are mostly insignificant in Hong Kong (Fig. S3) andO1phase TACs (Fig. S4) are only significant at Quarry Bay.
3.2 Combined tidal variability (δ-HATs) and tidal covariability
magni-Table 2.Amplitude TACs forM2,S2,K1, andO1for the period of 1986–2016. All values given are in units of millimeter change in tidal amplitude for a 1 m fluctuation in sea level (mm m−1). Statistically significant positive values are given in bold text.
Station M2TAC S2TAC K1TAC O1TAC
Quarry Bay (QB) +218±37 +85±16 +220±15 +146±11 Tai Po Kau (TPK) +267±42 +98±17 +190±68 +100±25 Tsim Bei Tsui (TBT) +7±80 −10±15 +32±22 +24±22 Chi Ma Wan (CMW) −58±11 −7±5 −18±8 −37±10 Cheung Chau (CHC) −63±20 −22±35 +69±48 +50±92 Lok On Pai (LOP) −81±24 −18±8 +8±32 −24±12 Ma Wan (MW) −68±4 +1±25 +52±4 −62±21 Tai Miu Wan (TMW) +22±59 −1±9 +10±22 +3 8 Shek Pik (SP) +62±29 +11±18 +70±4 +28±17 Waglan Island (WAG) +1±21 +3±6 +9±7 −9±8 Ko Lau Wan (KLW) −46±39 −11±17 +29±65 +60±57 Kwai Chung (KC) −90±46 −10±29 −91±226 −202±161
Table 3. The δ-HAT andD1/D2 TACs for the period of 1986– 2016. The δ-HAT values given are in units of millimeter change in tidal amplitude for a 1 m fluctuation in sea level (mm m−1). D1/D2TACs are in unitless ratios (i.e., mm mm−1). Statistically significant values are given in bold text.
Station δ-HAT D1/D2
Quarry Bay (QB) +665±82 +1.08±0.05 Tai Po Kau (TPK) +612±210 +1.01±0.04 Tsim Bei Tsui (TBT) +56±117 +0.37±0.02 Chi Ma Wan (CMW) −119±19 +0.74±0.19 Cheung Chau (CHC) −12±42 +0.81±1.03 Lok On Pai (LOP) −114±45 +0.26±0.05 Ma Wan (MW) −91±73 +0.57±1.02 Tai Miu Wan (TMW) +42±100 +1.04±0.20 Shek Pik (SP) +138±37 +0.89±0.06 Waglan Island (WAG) +3±31 +1.11±0.17 Ko Lau Wan (KLW) −66±47 +1.31±0.62
tudes (+665±85 mm m−1and+612±210 mm m−1, respec-tively) and Shek Pik having a lesser magnitude of +138±
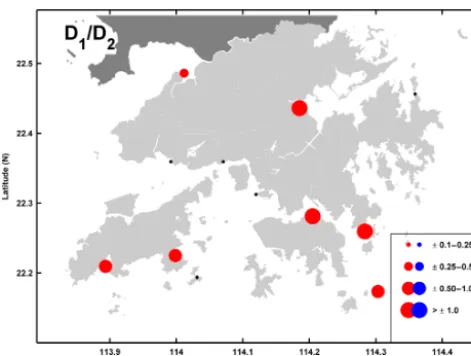
47 mm m−1. Conversely, Ma Wan and Chi Ma Wan exhibit moderate negativeδ-HAT values (∼ −100 mm m−1). The re-mainder of gauges (which are mainly open-water locations) have statistically insignificant results for the combined tidal amplitudes, even where some large individual TACs were observed. This shows that the combined tidal amplitude ef-fect as expressed by theδ-HATs is most important in semi-enclosed harbors. The D1/D2 TACs are also important in Hong Kong and are seen at almost every location. All signif-icantD1/D2TACs results are positive (Fig. 8) and at most locations the correspondence is nearly 1 to 1, indicating that a change inD1can yield a nearly identical magnitude change inD2, and vice versa. Smaller magnitude relations are seen in the western areas of the Hong Kong region.
Figure 3.Tidal anomaly correlations (TACs) of detrendedM2 am-plitude to detrended MSL in Hong Kong with the marker size showing the relative magnitude according to the legend in units of mm m−1. Red/blue markers indicate positive/negative TACs and black markers indicate TACs which are not significantly different from zero.
3.3 Anomalous tidal events at Hong Kong harbor locations
Figure 4.Tidal anomaly correlations (TACs) of detrendedS2 ampli-tude to detrended MSL in Hong Kong with the marker size showing the relative magnitude according to the legend in units of mm m−1. Red/blue markers indicate positive/negative TACs and black mark-ers indicate TACs which are not significantly different from zero.
Figure 5.Tidal anomaly correlations (TACs) of detrendedK1 am-plitude to detrended MSL in Hong Kong with the marker size showing the relative magnitude according to the legend in units of mm m−1. Red/blue markers indicate positive/negative TACs and black markers indicate TACs which are not significantly different from zero.
The HKPD determined for the years 1965–1983 was ap-proximately 1.23 m below MSL. The HKPD has been re-cently redetermined using data from 1997–2015 to be 1.30 m below MSL. Therefore, all MSL values reported here are given relative to the HKPD for the epoch 1965–1985 (https: //www.hko.gov.hk/contente.htm, last access: 1 March 2019). Some very notable features of the tides are clear. At Quarry Bay, the early part of the record shows nearly constant tidal amplitudes in D1, while D2 amplitudes show a slight de-crease, and MSL exhibits a slight positive trend. In the
Figure 6.Tidal anomaly correlations (TACs) of detrendedO1 am-plitude to detrended MSL in Hong Kong with the marker size showing the relative magnitude according to the legend in units of mm m−1. Red/blue markers indicate positive/negative TACs and black markers indicate TACs which are not significantly different from zero.
Figure 7.The tidal anomaly correlation computed from the combi-nation of the four largest tidal constituent amplitudes (given by the detrended sum ofM2+S2+K1+O1) as a proxy for the change in the approximate highest astronomical tide (δ-HAT) relative to detrended MSL in Hong Kong with the marker size showing the relative magnitude according to the legend in units of mm m−1. Red/blue markers indicate positive/negative TACs and black mark-ers indicate TACs which are not significantly different from zero.
Figure 8.TheD1/D2TACs; the relations of detrended diurnal tidal amplitude sum (D1:K1+O1) to detrended semidiurnal tidal ampli-tude sum (D2:M2+S2) in Hong Kong with the marker size show-ing the relative magnitude accordshow-ing to the legend in dimensionless units. Red/blue markers indicate positive/negative TACs and black markers indicate TACs which are not significantly different from zero.
2000, and then a steep decrease concurrent with the time of diminished tides before increasing again. The gauge at Tai Po Kau shows a similar tidal behavior, although the timing and magnitudes are different. The increase in D1 and D2 at Tai Po Kau in the 1980s is much larger and peaks ear-lier than Quarry Bay, reaching a maximum around 1996, and then decreasing around 1998, about 5 years before the drop at Quarry Bay. Both locations experience an absolute mini-mum around 2007 inD2but theD1minimum at TPK leads the Quarry Bay minimum by a few years. These observed anomalies are only observed at these two gauges; other loca-tions in Hong Kong did not reveal similar behavior.
4 Discussion
4.1 Summary of observed tidal variability
This survey has identified several types of tidal variability in Hong Kong. The individual TACs are significant at many Hong Kong locations, while the TACs of the approximate δ-HATs appear to be more locally important, as the strongest responses are mainly concentrated at specific locations (e.g., Quarry Bay and Tai Po Kau). The M2 response (Fig. 3) is negative at gauges just west of Quarry Bay and positive at Shek Pik, with a similar pattern seen for the O1 TACs (Fig. 6). Conversely, theK1TAC results are generally posi-tive (Fig. 5). At both Quarry Bay and Tai Po Kau, the posiposi-tive reinforcements of individual tidal fluctuations lead to very largeδ-HATs, though moderately negativeδ-HATs are seen near Quarry Bay at Chi Ma Wan and Ma Wan (Fig. 7). The
spatial similarity in the semi-enclosed center harbor regions suggest a connected mechanism; this area is where most re-cent Hong Kong coastal reclamation projects have occurred, including the construction of a new island for an airport, shipping channel deepening, and other coastal morphology changes. Such changes in water depth and coastal geometry strongly suggest a relation to frictional or resonance mecha-nisms.
TheD1/D2TAC relations (Fig. 8) are a more regionally relevant phenomenon, being significant nearly everywhere in Hong Kong. The majority of significantD1/D2 TACs are positive with most being nearly 1 to 1 (i.e., a∼1 mm change in D1 will yield a ∼1 mm change in D2), confirmed by the close similarity of temporal tidal trends of the D1 and D2tidal bands in Hong Kong (Fig. 9). This aspect of tidal variability in Hong Kong may be related to the dynamics near the Luzon Strait, where large amounts of baroclinic conver-sion in bothD1 andD2tides may tend to couple the vari-abilities (Jan et al., 2007, 2008; Lien et al., 2015; Xie et al., 2008, 2011, 2013). TheD1andD2internal tides may inter-act with each other as well as with processes at other fre-quencies, such as at the local inertial frequency,f, via para-metric subharmonic instability (PSI) interactions (McComas and Bretherton, 1977; MacKinnon and Winters, 2005; Al-ford, 2008; Chinn et al., 2012), a form of resonant triad inter-actions (Craik, 1985). The low-mode baroclinic energy can travel great distances, being enhanced upon arrival at the shelf and leading to the further generation of baroclinic en-ergy. In the western part of Hong Kong, theD1/D2 relation-ships are less than 1 to 1 (∼0.33 to∼0.25 at TBT and LOP, respectively). This may be partially influenced by effects of the Pearl River, which discharges part of its flow along the Lantau Channel. The flow of the river is highly seasonal and ejects a freshwater plume at every ebb tide that varies with prevailing wind conditions and with the spring–neap cycle (Pan et al., 2014). The plumes may affect turbulence and mixing in the region and can dissipate tidal energy, which may “decouple” the correlated response ofD1andD2seen in the rest of the Hong Kong coastal waters.
Figure 9.Time series of water level spectrum components at Quarry Bay (QB; blue) and Tai Po Kau (TPK; red) tide gauges in Hong Kong, showing theD1band(a), theD2band(b), and mean sea level (MSL)(c). Components are plotted as a function of normalized amplitudes to show relative variability with mean values given in the legend.
variations appear to only be amplified in harbor areas. De-creases in friction associated with sea level rise may lead to larger tides and those changes may also be amplified by the close correlations ofD1andD2variability or local harbor de-velopment, which may further decrease local friction. Hence, a small change in friction due to a small sea level change may induce a significant change in tidal constituents. The positive reinforcement of multiple tidal constituent correlated with re-gional sea level adjustments may amplify the risks of coastal inundation and coastal flooding, as evidenced by the gauges that had the largestδ-HAT values.
4.3 Limitations of this study and future steps
The analysis of tides in the Hong Kong tide gauge network revealed new dynamics and spatial connections in the area. However, some records are of shorter length and/or have many gaps, making a full analysis of the area problematic. For example, the Tsim Bei Tsui gauge covers a long pe-riod but there are significant gaps in the record, which com-plicated our analysis. This gauge is located within a har-bor region (Deep Bay, har-bordered to the north by Shenzhen, PRC, which has also grown and developed its coastal infras-tructure in past decades; therefore, one might expect simi-lar dynamics as was seen at Quarry Bay and Tai Po Kau. While there were moderately significantD1/D2correlations at Tsim Bei Tsui, no significant TACs orδ-HATs were ob-served. The large anomalies seen at Quarry Bay and Tai Po
5 Conclusions
This study has presented new information about the tidal variability in Hong Kong, based on observations of a set of closely located tide gauges in Hong Kong. The TACs, D1/D2relations,δ-HATs, and the anomalous events in tidal amplitudes seen at the Quarry Bay and Tai Po Kau gauges show an amplified tidal response to MSL fluctuations in these harbor regions as opposed to more open-water loca-tions, where individual TACs were sometimes significant but theδ-HAT changes were less significant. The reason for the observed behavior may be due to changing friction or reso-nance induced by coastal engineering projects that are only significant at highly local (i.e., individual harbor) scales. Al-ternatively, the observed behavior could be related to regional South China Sea changes due to climate change (such as in-creased upper-ocean warming and/or regional stratification and internal tide generation). It is difficult to separate the local engineering changes from regional climatic changes without closer investigations. However, even without exact knowledge of the relevant mechanisms, these anomalies do suggest that a pronounced change in tidal properties occurred around the year 2000 in Hong Kong, with the effect be-ing most pronounced at gauges in semi-enclosed harbors. Overall, the tidal variability in Hong Kong documented here may have significant impacts on the future of extreme sea level in the region, especially if the strong positive reinforce-ments hold or increase in coming decades. Short-term inun-dation events, such as nuisance flooding, may be amplified under scenarios of higher sea levels that lead to correspond-ing changes in the tides, which may amplify small changes in water levels and/or reductions in friction due to harbor im-provements. The δ-HAT and D1/D2 TAC results illustrate that the tidal variability in multiple constituents may be ad-ditive and may reinforce MSL changes at some locations, which may further aggravate coastal flooding under MSL future rise. Since tides and storm surge are both long-wave processes, the locations of strong tidal response may also ex-perience an exaggerated storm surge in the near future.
Code availability. All code employed in this study was developed using MATLAB, version R2011B. All code and methods can be provided upon request.
Appendix A: Methodology details A1 Tidal anomaly correlations (TACs)
Tidal admittances are constructed as described above, em-ploying the use of the tidal potential and Eqs. (2) and (3) to constrain the nodal variation present in the observed tidal am-plitudes and phases. Our primary interest in this paper is the interannual to decadal variations and not the long-term trends in mean values. Therefore, we first remove the long-term trends and mean values using the MATLAB “detrend” func-tion. The detrended time series of residual variations in A andP, and the residual variations in MSL, can now be ex-amined for coherence, using scatter plots, cross correlations, and regression statistics. We define the tidal anomaly corre-lation (TAC) as the slope between detrended tidal properties (amplitude and phase) and detrended MSL, expressed as the millimeter change in tidal amplitude per meter of sea level rise (mm m−1). The same approach is used with the phase difference time series to provide phase anomaly trends, with the trends expressed as degree change in tidal phase per me-ter of sea level rise (deg m−1). The errors of the TAC deter-minations are defined as the 95 % confidence interval (CI) of the linear trend determination. Trends are deemed significant if the signal-to-noise ratio (SNR) of the linear trend to the associated error is greater than 2.0.
A2 Approximate change in the highest astronomical tide (δ-HAT)
We also construct a proxy quantity as an approximate change in the highest astronomical tide (δ-HAT) using an extension of the TAC method. To do this, we combine the tidal admit-tance amplitudes of the (typically) four largest astronomical tides (M2,S2,K1, andO1) then detrend the resultant com-bined time series as above. Next, we perform a similar scat-ter plot and regression approach against the detrended MSL time series as was done with the TACs. The benefit of this ap-proach is to give a clear picture of the overall changes in tides related to sea level changes. Some locations may show that the variability in multiple tidal constituents partially cancel each other (e.g., semidiurnal tides may have a large positive tendency compared to MSL variability while diurnal tides may have a large negative tendency, resulting in an offset-ting of variabilities under MSL changes, and a smaller over-all magnitudeδ-HAT), while other locations may show a re-inforced variability (e.g., both diurnal and semidiurnal tides have positive tendencies compared to MSL changes, result-ing in an amplifiedδ-HAT). Thus, the accurate interpretation of theδ-HAT is that it reflects the maximum tide-related wa-ter level that would be obtained in a given analysis period (here, 1 year) from a chosen set of time-dependent ampli-tudes extracted from the admittance method.
Two details about theδ-HAT parameter should be noted here. First, only the amplitude of the tidal admittance can be combined in this manner, as combining the phase vari-ability in multiple frequencies may be inaccurate at worst and at best is not very helpful. Second, we acknowledge that the use of the term “δ-HAT” may be somewhat confusing as previous literature about tidal analysis uses the term “High-est Astronomical Tide” (HAT) to denote the high“High-est water level that can be expected to occur under average meteoro-logical conditions due purely to astronomical forcing in a given epoch. This typical period is 19 years, which consid-ers the full nodal cycle. This definition of HAT does not re-flect the highestpossiblewater level at a given location, since storm surge or other non-average meteorological conditions may amplify water levels far above this level on a shorter timescale than a 19-year determination can reveal. The in-tention behind our chosen nomenclature of the “approximate change in the highest astronomical tide” (δ-HAT) attempts to expand on this concept by considering the full tidal vari-ability (not strictly true since the four largest tides are only about 75 % of the full tidal range but these tidal components are nearly always stable in 1-year analyses, so it is a depend-able and easily compardepend-able metric) at timescales shorter than a nodal period (∼19 years), but longer than a storm surge (∼2–5 d) or other meteorological anomalies. Furthermore, our interest is the changes in tidal components that is not due to astronomy or to meteorology. Rather, we show possi-ble changes to tide-related water level modifications due to MSL modifications, which may be important on seasonal to decadal timescales, induced by mechanisms associated with global climate change (e.g., steric sea level rise due to ice melt, thermal sea level rise due to upper-ocean warming) or to more local effects (such as rapid harbor modifications or land reclamation that adjusts tidal resonance at a particular location).
Supplement. The supplement related to this article is available online at: https://doi.org/10.5194/os-15-853-2019-supplement.
Author contributions. ATD worked on all analyses, figures, tables, the majority of writing, and complied the paper. JP provided editing, insight, guidance, and direction to this study. HL provided critical insight and helpful input.
Competing interests. The authors declare that they have no conflict of interest.
Acknowledgements. This work is supported by The National Basic Research Program of China (2015CB954103), the National Nat-ural Science Foundation of China (project 41376035), the Gen-eral Research Fund of Hong Kong Research Grants Council (RGC) (CUHK 14303818), and the talent startup fund of Jiangxi Normal University. The authors also thank the Hong Kong Observatory. In addition to sharing their data archive, they were also a part of the discussions that led to this paper.
Review statement. This paper was edited by John M. Huthnance and reviewed by two anonymous referees.
References
Alford, M. H.: Observations of parametric subharmonic instability of the diurnal internal tide in the South China Sea, Geophys. Res. Lett., 35, L15602, https://doi.org/10.1029/2008GL034720, 2008. Amin, M.: On perturbations of harmonic constants in the Thames Estuary, Geophys. J. Roy. Astron. Soc., 73, 587–603, https://doi.org/10.1111/j.1365-246X.1983.tb03334.x, 1983. Arbic, B. K., Karsten, R. H., and Garrett, C.: On tidal
res-onance in the global ocean and the back-effect of coastal tides upon open-ocean tides, Atmos.-Ocean, 47, 239–266, https://doi.org/10.3137/OC311.2009, 2009.
Arns, A., Dangendorf, S., Jensen, J., Bender, J., Talke, S. A., and Pattiaratchi, C.: Sea level rise induced amplification of coastal protection design heights, Nature: Scient. Rep., 7, 40171, https://doi.org/10.1038/srep40171, 2017.
Bowen, A. J. and Gray, D. A.: The tidal regime of the River Thames; long-term trends and their possible causes, Philos. T. Roy. Soc. Lond. A, 272, 187–199, https://doi.org/10.1098/rsta.1972.0045, 1972.
Buchanan, M. K., Oppenheimer, M., and Kopp, R. E.: Am-plification of flood frequencies with local sea level rise and emerging flood regimes, Environ. Res. Lett., 12, 064009, https://doi.org/10.1088/1748-9326/aa6cb3, 2017.
Cartwright, D. E.: Secular changes in the oceanic tides at Brest, 1711–1936, Geophysical J. Int., 30, 433–449, https://doi.org/10.1111/j.1365-246X.1972.tb05826.x, 1972. Cartwright, D. E. and Tayler, R. J.: New computations of the
tide-generating potential, Geophys. J. Roy. Astron. Soc., 23, 45–74, https://doi.org/10.1111/j.1365-246X.1971.tb01803.x, 1971.
Chernetsky, A. S., Schuttelaars, H. M., and Talke, S. A.: The effect of tidal asymmetry and temporal settling lag on sedi-ment trapping in tidal estuaries, Ocean Dynam., 60, 1219–1241, https://doi.org/10.1007/s10236-010-0329-8, 2010.
Cherqui, F., Belmeziti, A., Granger, D., Sourdril, A., and Le Gauf-fre, P.: Assessing urban potential flooding risk and identifying effective risk-reduction measures, Sci. Total Environ., 514, 418– 425, 2015.
Chinn, B. S., Girton, J. B., and Alford, M. H.: Observations of internal waves and parametric subharmonic instability in the Philippines archipelago, J. Geophys. Res.-Oceans, 117, C05019, https://doi.org/10.1029/2011JC007392, 2012.
Church, J. A. and White, N. J.: A 20th century acceleration in global sea-level rise, Geophys. Res. Lett., 33, L01602, https://doi.org/10.1029/2005GL024826, 2006.
Church, J. A. and White, N. J.: Sea level rise from the late 19th to the early 21st century, Surv. Geophys., 32, 585–602, https://doi.org/10.1007/s10712-011-9119-1, 2011.
Colosi, J. A. and Munk, W.: Tales of the venerable Hon-olulu tide gauge, J. Phys. Oceanogr., 36, 967–996, https://doi.org/10.1175/JPO2876.1, 2006.
Craik, A. D. D.: Wave Interactions and Fluid Flows, Cambridge Univ. Press, Cambridge, UK, ISBN: 978-0521368292, 1985. Devlin, A. T., Jay, D. A., Talke, S. A., and Zaron, E.: Can
tidal perturbations associated with sea level variations in the western Pacific Ocean be used to understand future ef-fects of tidal evolution?, Ocean Dynam., 64, 1093–1120, https://doi.org/10.1007/s10236-014-0741-6, 2014.
Devlin, A. T., Jay, D. A., Zaron, E. D., Talke, S. A., Pan, J., and Lin, H.: Tidal variability related to sea level variability in the Pacific Ocean, J. Geophys. Res.-Oceans, 122, 8445–8463, https://doi.org/10.1002/2017JC013165, 2017a.
Devlin, A. T., Jay, D. A., Talke, S. A., Zaron, E. D., Pan, J., and Lin, H.: Coupling of sea level and tidal range changes, with implications for future water levels, Scient. Rep., 7, 17021, https://doi.org/10.1038/s41598-017-17056-z, 2017b.
Devlin, A. T., Pan, J., and Lin, H.: Extended spectral analysis of tidal variability in the North Atlantic Ocean, J. Geophys. Res.-Oceans, 124, 506–526, 2019.
Domingues, C. M., Church, J. A., White, N. J., Gleckler, P. J., Wi-jffels, S. E., Barker, P. M., and Dunn, J. R.: Improved estimates of upper-ocean warming and multi-decadal sea level rise, Nature, 453, 1090, https://doi.org/10.1038/nature07080, 2008.
Familkhalili, R. and Talke, S. A.: The effect of chan-nel deepening on tides and storm surge: A case study of Wilmington, NC, Geophys. Res. Lett., 43, 9138–9147, https://doi.org/10.1002/2016GL069494, 2016.
Feng, X., Tsimplis, M. N., and Woodworth, P. L.: Nodal vari-ations and long-term changes in the main tides on the coasts of China, J. Geophys. Rese.-Oceans, 120, 1215–1232, https://doi.org/10.1002/2014JC010312, 2015.
Haigh, I. D., Wijeratne, E. M. S., MacPherson, L. R., Pattiaratchi, C. B., Mason, M. S., Crompton, R. P., and George, S.: Es-timating present day extreme water level exceedance proba-bilities around the coastline of Australia: tides, extra-tropical storm surges and mean sea level, Clim. Dynam., 42, 121–138, https://doi.org/10.1007/s00382-012-1652-1, 2014.
provided by the Hong Kong Observatory, available at: https:// www.hko.gov.hk/publica/publist.htm (last access: 1 June 2019), 1990.
Jan, S., Chern, C. S., Wang, J., and Chao, S. Y.: Generation of di-urnalK1internal tide in the Luzon Strait and its influence on surface tide in the South China Sea, J. Geophys. Res.-Oceans, 112, C06019, https://doi.org/10.1029/2006JC004003, 2007. Jan, S., Lien, R. C., and Ting, C. H.: Numerical study of
baroclinic tides in Luzon Strait, J. Oceanogr., 64, 789–802, https://doi.org/10.1007/s10872-008-0066-5, 2008.
Jay, D. A.: Evolution of tidal amplitudes in the east-ern Pacific Ocean, Geophys. Res. Lett., 36, L04603, https://doi.org/10.1029/2008GL036185, 2009.
Jay, D. A., Leffler, K., and Degens, S.:, Long-term evolution of Columbia River tides, ASCE J. Waterway Port Coast. Ocean Eng., 137, 182–191, https://doi.org/10.1061/(ASCE)WW.1943-5460.0000082, 2011.
Leffler, K. E. and Jay, D. A.: Enhancing tidal harmonic analysis: Robust (hybrid L1/L2) solutions, Cont. Shelf Res., 29, 78–88, https://doi.org/10.1016/j.csr.2008.04.011, 2009.
Li, K. W. and Mok, H. Y.: Long term trends of the regional sea level changes in Hong Kong and the adjacent waters, in: Asian And Pacific Coasts 2011, published by the Hong Kong Observa-tory, in: The 6th International Conference on Asian and Pacific Coasts (APAC2011), 14 December 2011, Hong Kong, China, 349–359, https://doi.org/10.1142/9789814366489_0040, 2012. Lien, R. C., Tang, T. Y., Chang, M. H., and d’Asaro, E. A.: Energy
of nonlinear internal waves in the South China Sea, Geophys. Res. Lett., 32, L05615, https://doi.org/10.1029/2004GL022012, 2005.
MacKinnon, J. A. and Winters, K. B.: Subtropical catastrophe: Sig-nificant loss of low-mode tidal energy at 28.9◦, Geophys. Res. Lett., 32, L15605, https://doi.org/10.1029/2005GL023376, 2005. Mawdsley, R. J., Haigh, I. D., and Wells, N. C.: Global changes in mean tidal high water, low water and range, J. Coast. Res., 70, 343–348, https://doi.org/10.2112/SI70-058.1, 2014.
McComas, C. H. and Bretherton, F. P.: Resonant interaction of oceanic internal waves, J. Geophys. Res., 82, 1397–1412, https://doi.org/10.1029/JC082i009p01397, 1977.
Moftakhari, H. R., AghaKouchak, A., Sanders, B. F., Feldman, D. L., Sweet, W., Matthew, R. A., and Luke, A.: Increased nui-sance flooding along the coasts of the United States due to sea level rise: Past and future, Geophys. Res. Lett., 42, 9846–9852, https://doi.org/10.1002/2015GL066072, 2015.
Moftakhari, H. R., AghaKouchak, A., Sanders, B. F., and Matthew, R. A.: Cumulative hazard: The case of nuisance flooding, Earth’s Future, 5, 214–223, https://doi.org/10.1002/2016EF000494, 2017.
Müller, M.: The influence of changing stratification conditions on barotropic tidal transport and its implications for seasonal and secular changes of tides, Cont. Shelf Res., 47, 107–118, https://doi.org/10.1016/j.csr.2012.07.003, 2012.
Müller, M., Arbic, B. K., and Mitrovica, J. X.: Secular trends in ocean tides: Observations and model results, J. Geophys. Res.-Oceans, 116, C05013, https://doi.org/10.1029/2010JC006387, 2011.
Müller, M., Cherniawsky, J. Y., Foreman, M. G. G., and Storch, J. S.: GlobalM2internal tide and its seasonal variability from high resolution ocean circulation and tide modeling, Geophys. Res. Lett., 39, L19607, https://doi.org/10.1029/2012GL053320, 2012.
Pan, J., Gu, Y., and Wang, D.: Observations and numerical modeling of the Pearl River plume in summer season, J. Geophys. Res., 119, 2480–2500, https://doi.org/10.1002/2013JC009042, 2014. Pawlowicz, R., Beardsley, B., and Lentz, S.: Classical tidal
harmonic analysis including error estimates in MAT-LAB using T_TIDE, Comput. Geosci., 28, 929–937, https://doi.org/10.1016/S0098-3004(02)00013-4, 2002. Rasheed, A. S. and Chua, V. P.: Secular trends in tidal
param-eters along the coast of Japan, Atmos.-Ocean, 52, 155–168, https://doi.org/10.1080/07055900.2014.886031, 2014.
Ray, R. D.: Secular changes of the M2 tide in the Gulf of Maine, Cont. Shelf Res., 26, 422–427, https://doi.org/10.1016/j.csr.2005.12.005, 2006.
Ray, R. D. and Foster, G.: Future nuisance flooding at Boston caused by astronomical tides alone, Earth’s Future, 4, 578–587, https://doi.org/10.1002/2016EF000423, 2016.
Ross, A. C., Najjar, R. G., Li, M., Lee, S. B., Zhang, F., and Liu, W.: Fingerprints of Sea Level Rise on Changing Tides in the Chesa-peake and Delaware Bays, J. Geophys. Res.-Oceans, 122, 8102– 8125, https://doi.org/10.1002/2017JC012887, 2017.
Sweet, W. V. and Park, J.: From the extreme to the mean: Accelera-tion and tipping points of coastal inundaAccelera-tion from sea level rise, Earth’s Future, 2, 579–600, 2014.
Vellinga, N. E., Hoitink, A. J. F., van der Vegt, M., Zhang, W., and Hoekstra, P.: Human impacts on tides over-whelm the effect of sea level rise on extreme water lev-els in the Rhine–Meuse delta, Coast. Eng., 90, 40–50, https://doi.org/10.1016/j.coastaleng.2014.04.005, 2014. Woodworth, P. L.: A survey of recent changes in the main
com-ponents of the ocean tide, Cont. Shelf Res., 30, 1680–1691, https://doi.org/10.1016/j.csr.2010.07.002, 2010.
Xie, X. H., Chen, G. Y., Shang, X. D., and Fang, W. D.: Evolution of the semidiurnal (M2) internal tide on the continental slope of the northern South China Sea, Geophys. Res. Lett., 35, L13604, https://doi.org/10.1029/2008GL034179, 2008.
Xie, X. H., Shang, X. D., van Haren, H., Chen, G. Y., and Zhang, Y. Z.: Observations of parametric subharmonic instability-induced near-inertial waves equatorward of the critical diurnal latitude, Geophys. Res. Lett., 38, L05603, https://doi.org/10.1029/2010GL046521, 2011.
Xie, X., Shang, X., Haren, H., and Chen, G.: Observa-tions of enhanced nonlinear instability in the surface reflec-tion of internal tides, Geophys. Res. Lett., 40, 1580–1586, https://doi.org/10.1002/grl.50322, 2013.
Zaron, E. D. and Jay, D. A.: An analysis of secular change in tides at open-ocean sites in the Pacific, J. Phys. Oceanogr., 44, 1704– 1726, https://doi.org/10.1175/JPO-D-13-0266.1, 2014.