This is the peer reviewed version of the following article Paterson, A. M., Wallis, G. P., Kennedy, M. and Gray, R. D. (2014), Behavioural
Behavioral evolution in penguins does not reflect phylogeny
1
2
3
Adrian M. Patersona,*, Graham P. Wallisb, Martyn Kennedyc and Russell D. Grayd 4
5
6
a Department of Ecology, Lincoln University 7
b Department of Zoology, University of Otago 8
c Allan Wilson Centre for Molecular Ecology and Evolution, Department of Zoology, 9
University of Otago 10
d Department of Psychology, University of Auckland 11
12
13
* Correspondence: 14
Dr Adrian Paterson 15
Department of Ecology 16
Faculty of Agriculture and Life Sciences 17
Lincoln University 18
PO Box 84, Lincoln 7647 19
New Zealand 20
21
E-mail address [email protected] 22
Phone +64 3 325 2811 23
Fax +64 3 325 3844
24
Word count: ~5900 (excluding the references onwards) 26
Abstract 28
Over the last two decades, behavioral biologists and ecologists have made effective 29
use of the comparative method but have often stopped short of adopting an explicitly 30
phylogenetic approach. We examined 68 behavior and life history (BLH) traits of 15 penguin 31
species to: 1) infer penguin phylogeny, 2) assess homology of behavioral characters, and 3) 32
evaluate hypotheses about character evolution and ancestral states. Parsimony analysis of the 33
BLH dataset found either two shortest trees (characters coded as unordered) or a single 34
shortest tree (characters coded as a combination of unordered and dollo). The BLH data had 35
significant structure. Kishino-Hasegawa tests indicated that BLH trees were significantly 36
different from most previous estimates of penguin phylogeny. The BLH phylogeny generated 37
from dollo characters appeared to be less accurate than the tree derived from the completely 38
unordered dataset. Dividing BLH data into display and non-display traits resulted in no 39
significant differences in level of homoplasy and no difference in the accuracy of phylogeny. 40
Tests for homology of BLH traits were performed by mapping the characters onto a molecular 41
tree. Assuming that independent gains are less likely than losses of character states, 65 of the 42
68 characters were likely to be homologous across taxa and at least several characters 43
appeared to have been stable since the origin of modern penguins around 30 million years. 44
Finally, the likely BLH traits of the most recent common ancestor of extant penguins were 45
reconstructed from character states along the internal branch leading to the penguins. This 46
analysis suggested that the ‘proto-penguin’ probably had a similar life history to current 47
temperate penguins but few ritualised behaviors. A southern, cool- temperate origin of 48
penguins is suggested. 49
50
51
Despite a "flowering in phylogenetics" (Doyle, 1993), most comparative behavioral 53
studies have taken the ‘convergence approach’ (Winkler, 2000) where correlations among 54
similar events across lineages are explored using one of several methods (e.g., Gittleman and 55
Kot, 1990; Harvey and Pagel, 1991). Fewer behavioral studies have taken the ‘homology 56
approach’ (Winkler, 2000) where unique events within lineages are explored and similar traits 57
in different species are assumed to be homologous. On this basis Lorenz (1958) and 58
Tinbergen (1959) claimed that behavioral characters could be used to infer evolutionary 59
relationships (see also Hinde and Tinbergen, 1965; Brooks and McLennan, 1991). Critics of 60
the use of behavioral characters, however, pointed out that similarities among behavioral traits 61
were not always indicative of homology. They claimed that behavior may be more prone to 62
convergence than other types of traits (Atz, 1970; Aronson, 1981). As Tinbergen (1959) 63
himself stated, 64
"I suggest that it is because of the limited number of possibilities of doing 'the 65
opposite' to showing preparedness to attack, that we find some curious similarities 66
in the defensive threat and appeasement postures of widely separated species." 67
[author's italics]. 68
Other often-cited problems with investigations of behavioral evolution are the 69
supposed instability, evanescence, lack of character independence, and small likelihood of 70
fossilisation of behavioral characters (Atz, 1970). Thus, a major challenge for those who 71
championed use of behavioral characters was to demonstrate the homology of behavioral 72
characters. Only characters that have arisen once can be considered to be homologous 73
(Wagner, 1989), that is, traits are shared due to common ancestry (see Nixon and Carpenter, 74
2012). As suggested by Japyassu and Machado (2010), and following Brower and 75
Schawaroch (1996), assigning behavioural homology is a three- stage process where 76
comparable features are discovered among taxa, then character variability is partitioned into 77
Finally, congruence between character state distribution and a phylogenetic hypothesis, such 79
as a cladogram, is obtained either confirming the homology or identifying homoplasy (either 80
through convergence or observational error (Nixon and Carpenter, 2012)). Using parsimony-81
based phylogenetic methods, character homology can be assessed by mapping a character onto 82
an independent tree to assess whether it has arisen more than once (Brooks and McLennan, 83
1991). The phylogenetic content of a behavioral dataset can also be evaluated by comparing 84
trees based on behavior with independently derived trees. 85
In a renaissance of phylogenetic behavioral studies lead by Brooks and McLennan 86
(1991), many studies concentrated on testing hypotheses of behavioral homology by mapping 87
behaviors onto a genetic or morphological tree (e.g., Beehler and Swaby, 1991; Langtimm and 88
Dewsbury, 1991; Packer, 1991; McKitrick, 1992; Sillen-Tullberg and Møller, 1993; Winkler 89
and Sheldon, 1993; Price and Lanyon, 2002). Other studies used behavioral characters, or a 90
mixture of behavioral and other characters, to reconstruct the phylogenetic relationships of 91
organisms (e.g., Cracraft, 1985; McLennan et al., 1988; Arntzen and Sparreboom, 1989; 92
Prum, 1990; Crowe et al., 1992; Proctor, 1992; Paterson et al., 1995; Kennedy et al., 1996; 93
Slikas, 1998; Stuart and Hunter, 1998; McLennan and Mattern, 2001; Stuart and Currie, 2001; 94
Noll, 2002; Mattern and McLennan, 2004; Robillard et al., 2006). These studies have 95
generally shown relatively low levels of convergence (e.g., Prum, 1990; de Queiroz and 96
Wimberger, 1993; Paterson et al., 1995; Kennedy et al., 1996; Slikas, 1998; McLennan and 97
Mattern, 2001; Stuart and Currie, 2001), and high levels of congruence between trees derived 98
from behavior and different character types (e.g., McLennan et al., 1988; Arntzen and 99
Sparreboom, 1989; Prum, 1990; Paterson et al., 1995; Kennedy et al., 1996; Slikas, 1998; 100
Noll, 2002; Stuart et al., 2002). Highly predictable, and often stereotypical, behaviors and life 101
history traits present in all appropriate individuals are assumed to be inherited and, if found in 102
different species, are potential homologues (Hapyassu and Machado, 2010). De Queiroz and 103
homoplasy in behavioral traits than morphological traits. Similarly, in a study examining 105
multiple datasets for seabird species, Paterson et al. (1995) showed that retention indices of 106
the molecular datasets were not significantly higher than that of behavioral data. Several 107
techniques may assess whether congruence between behavioral and other trees is significant, 108
from the strictly topological based (e.g., Page, 1990; Page, 1992) to those that examine the 109
underlying uncertainty of the data generating the tree (e.g., Kishino and Hasegawa, 1989). 110
Here, we use behavior and life history (BLH) characters to derive a phylogeny for 111
penguins (Order Sphenisciformes) and to assess the accuracy of this phylogeny by comparing 112
with those constructed from other data types. Penguins are a homogenous group of seabirds 113
that became extremely modified for swimming with the complete loss of aerial flight (Bertelli 114
and Giannini, 2005). There has never been any doubt over monophyly of spenisciforms, 115
which are very distinct from all possible sister groups with an origin in excess of 60 million 116
years ago (Clarke et al, 2007). 117
Congruence among trees generated from independent datasets will generally indicate 118
common phylogenetic history unless there has been lineage sorting, hybridisation of taxa 119
and/or non-independence of characters (Penny et al., 1982; Bledsoe and Raikow, 1990; Zink 120
and Avise, 1990; Paterson et al., 1993; Miyamoto and Fitch, 1995). The degree of congruence 121
among phylogenies generated from penguin BLH data and other character types will indicate 122
how useful BLH characters are in reconstructing phylogeny. Each BLH character is examined 123
for homology by calculating the number of times it is gained over a tree based on molecular 124
data from several gene regions. Finally, evolution of BLH traits is examined by the 125
reconstruction of ancestral BLH character states. 126
127
Penguin phylogeny 128
To assess the accuracy of the phylogeny derived from BLH characters, phylogenies 129
contentious. While it is generally accepted that the order is monophyletic and contains six 131
extant genera, only a few studies have examined the relationships among these genera. The 132
studies that have investigated the relationships of most extant penguin species include: a 133
phenetic study of myology (Schreiweis, 1972), a study of behavior with no formal character 134
analysis (Jouventin, 1982), a study of integumentary and breeding characters (Giannini and 135
Bertelli, 2004), phenetic studies of both external morphology and skeletal measurements 136
(Livezey, 1989), a molecular phylogenetic study of several gene regions (Baker et al., 2006), 137
cladistic studies of general morphology and two gene regions (Bertelli and Giannini, 2005) 138
and a parsimony analysis of skeletal traits (Ksepka and Clarke, 2010). Generic level 139
relationships have been investigated using a cladistic study of myology (McKitrick, 1991), a 140
cladistic study of osteology (O'Hara, 1989), a phenetic analysis of DNA-DNA hybridization 141
(Sibley and Ahlquist, 1990) and a likelihood analysis of gene regions (Baker et al., (2006). 142
Each of these analyses produces a different phylogeny for the penguin genera and species 143
(Fig. 1). This lack of congruence is perhaps to be expected, as penguins are highly adapted to 144
the marine environment and under intense convergent selection pressure in their morphology. 145
In studies of morphology and behaviour, phylogenetic signal may thus be obscured by 146
adaptation. Molecular traits, such as the gene regions examined by Baker et al. (2006) and 147
BLH (particularly terrestrial) traits, may be more appropriate for reconstructing penguin 148
phylogeny. 149
150
Homology testing 151
In addition to assessing homology of individual BLH characters it is useful to know 152
whether certain types of BLH characters are, on average, more likely to show homoplasy than 153
others. End-products of behavior may show more homoplasy (e.g. caddisfly cases;(Stuart and 154
Currie, 2002), or be as reliable as other character types (e.g. ovenbird nests;(Zyskowski and 155
phylogenetic characters than other BLH traits, although Tinbergen (1959) argued that, on 157
average, displays would contain no more phylogenetic information than other BLH traits. 158
Paterson et al. (1995) found that seabird agonistic and reproductive displays contained no 159
more phylogenetic information than foraging behavior and life history characters. This lack of 160
difference between display and non-display BLH traits in seabirds may also be the same for 161
penguins. There have, however, been more detailed studies of penguin displays than of 162
seabird displays (e.g., Jouventin, 1982), and this may influence the phylogenetic content of 163
such information. Ksepka and Clarke (2010) also used five behaviour and life history traits in 164
their large morphological analysis of penguins. 165
166
Character evolution 167
Characters states do not arise de novo but are assembled over evolutionary time in a 168
particular sequence (McLennan, 1991). This is especially apparent in the evolution of 169
behavior (Brooks and McLennan, 1991; McLennan, 1991; McKitrick, 1992). Most 170
phylogenetic work on behavior has involved reconstructing evolutionary sequences and co-171
occurring displays. These studies include: courtship sequence of newts (Arntzen and 172
Sparreboom, 1989), rodent copulation (Langtimm and Dewsbury, 1991), breeding behavior of 173
three-spined sticklebacks (McLennan, 1991), nest architecture of sweat bees (Packer, 1991), 174
avian parental care (McKitrick, 1992), cooperative breeding of perching birds (Edwards and 175
Naeem, 1993), nest architecture of swallows (Winkler and Sheldon, 1993) and courtship 176
displays in birds of paradise (Scholes, 2008). 177
Phylogenetic analysis can be used to infer likely BLH states found in ancestors of 178
extant organisms by optimising or mapping characters onto an independent phylogeny 179
(McLennan, 1991). Such analyses have not progressed significantly over the last decade since 180
work by Omland (1999). There are several different approaches as characterised by Martins 181
(McArdle and Rodrigo, 1994), maximum likelihood (Schluter et al., 1997), and generalised 183
least squares (Martins and Hansen, 1997). We attempt to reconstruct the mode of life and 184
appearance of the most recent common ancestor (MRCA). Current views about the MRCA 185
claim that it was a small Eudyptula-like diver that arose in the New Zealand region 186
(Jouventin, 1982). Stonehouse (1975) suggested that the flightless condition arose in the 187
MRCA which was no larger than the smallest living species (Eudyptula). In terms of its BLH 188
traits, the most recent common ancestor for the extant clade probably walked and swam in a 189
manner similar to extant penguins, was a general forager in productive shallow water habitats, 190
had few predators, and no migration (Simpson, 1976). Early penguins are thought to have 191
evolved in a broad southern zone where water temperatures (12–18°C) were warmer than 192
today (Simpson, 1975). Fordyce and Jones (1990) have reported a penguin fossil (24 million 193
years before present - mybp) morphologically similar to Eudyptula minor, although it is likely 194
that this is due to convergence and does not represent relatedness (Clarke et al., 2007). Baker 195
et al. (2006) suggested that the ancestor of most modern penguin groups moved out of 196
Antarctica and successfully colonised lower latitudes. In as much as behavior and life history 197
are linked to morphology we might expect some BLH traits to be as conservative over 198
penguin evolution as their morphological traits appear to be. 199
In this study we obtain behavioral and life history characters for the penguins. We test 200
the following predictions: that there is significant structure in these data and that it is largely 201
phylogenetic signal, that individual characters are good hypotheses of homology and that 202
different data types share similar levels of homology, and that ancestral states can be 203
reconstructed. An estimate for the BLH character states for the most recent common ancestor 204
will be made. 205
206
Methods 207
Fifteen penguin species were analysed in this study (see Table 1). The unrepresented 209
species were Spheniscus humboldti (Humboldt's Penguin) and S. mendiculus (Galapagos 210
Penguin), which were excluded because of insufficient information (i.e. states for more than 211
half of the characters were unknown). We used the gull Larus dominicanus (Order 212
Charadriiformes) as the outgroup throughout. This order is thought to be relatively closely 213
related to the Order Sphenisciformes (see Sibley and Ahlquist, 1990; McKitrick, 1991; 214
Paterson et al., 1995). Behavioral information for the species was largely extracted from the 215
Handbook of Australian, New Zealand and Antarctic Birds (Marchant and Higgins, 1990). 216
This handbook is in a standardized format, with each species described by a specialist 217
researcher, and summarizes virtually all of the literature to that date. Information for all 218
species was also collected from other sources (Eggleton and Siegfried, 1979; del Hoyo et al., 219
1992). Additional information was collected for specific species: S. magellanicus from 220
Stonehouse (1975), S. demersus from Eggleton and Siegfried (1979), Eudyptula minor from 221
Waas (1991), Eudyptes pachyrhynchus from Warham (1974) and L. dominicanus from 222
numerous sources (Tinbergen, 1959; Saunders, 1971; Watson, 1975; Soper, 1976; Nugent, 223
1982; Cramp, 1983; Robertson, 1985; Ehrlich et al., 1988). While datasets compiled from the 224
literature may be weaker than those derived from direct observation, we have ensured that our 225
BLH information is of high quality by going back to primary sources where possible. 226
Our choice of characters came down to two basic kinds. Traits that were explicitly 227
behavioral were those identified as stereotypical (often as fixed action patterns) displays and 228
included characters 14–25, 30–35 and 27–40. Traits that were life history related were those 229
that had measurable consequences as a result of behavioral decisions made reliably by all 230
appropriate individuals of a species. Life history traits, such as which vegetation type a nest is 231
located in, are the outcome of the interaction of several behavioral systems. They are no 232
different to measuring other behavioral outcomes such as caddis fly cases (Stuart and Currie 233
to assess the overall information content of BLH characters, efforts were made to utilise all 235
available penguin BLH information. We omitted only two types of characters prior to 236
finalizing the dataset: characters that were invariant (across these taxa and a range of other 237
outgroups) and characters with unknown states in more than half of the taxa. We used the 238
principle of primary homology (Ignarsson and Coddington 2007), where homology is assumed 239
based on similarity, in order to assign our characters. We used the principle of secondary 240
homology, congruence with other phylogenetic hypotheses generated with other data, to test 241
these character states (Ignarsson and Coddington 2007). 242
243
Phylogenetic analysis 244
Of the 68 BLH characters (Appendix 1), 27 were multi-state and analysed as 245
unordered. Numerical character states were partitioned where there were natural breaks in 246
quantitative data. An important issue in the use of BLH characters to reconstruct phylogeny 247
concerns coding and weighting of these characters. Some authors (Felsenstein, 1983; 248
Templeton, 1983) have argued that strict parsimony, where a loss is as likely as a gain, may 249
not be the optimal coding for characters, particularly where losses are more likely than 250
independent gains. One such situation may be complex behavioral displays and actions such 251
as head circling, found in A. forsteri and A. patagonicus. This behavior features birds 252
throwing their heads back, then moving them forward in lateral, half circling motions while 253
groaning. It would seem less likely that a complex behavior of this sort would arise 254
independently than it would be lost, and should be coded as such. One way of factoring such 255
directionality is dollo parsimony ( Maddison and Maddison, 2005; Cruickshank and Paterson, 256
2006), which allows convergence for character loss but assumes that a state gain can only 257
occur once. Note that dollo parsimony makes no assumption about the length of time required 258
for complex characters to evolve or be lost, only that losses are much more likely than gains. 259
gains heavier than losses (Paterson et al., 1995). Our first analysis of the BLH data coded all 261
characters equally as unordered. A second analysis used the same characters, but designated 262
15 of them (those that we hypothesised as less likely to have arisen more than once) as dollo 263
characters (10, 15, 22, 32, 33, 37, 38, 40, 52, 53, 54, 56, 65, 66, 67). All characters were 264
assumed to be independent and were weighted equally. It is probable that some characters 265
have a more rapid rate of evolutionary change than others but there were no reasons a priori 266
for selecting differential weighting (see Eernisse et al., 1992). The independence of characters 267
was assessed by ensuring that all character states were mutually exclusive within and between 268
characters. Just as ‘organisms are hierarchies of parts’ (McKitrick, 1994), we view complex 269
behaviors as hierarchies of simple behaviors and, moreover, as diagnostic features for 270
underlying neural structures and organization (see Japyassu and Machado, 2010). For 271
example, a complex behaviour, such as nest building, was considered to be a suite of 272
phylogenetically independent characters, i.e., made up of several less complex behaviors with 273
their own individual, but congruent, evolutionary history. 274
The data were analysed using the branch and bound option of PAUP* 4.0b10 275
(Swofford, 2002) to generate BLH cladograms. The most fundamental question that can be 276
asked about the data derived from the penguin BLH dataset is whether it contains any more 277
cladistic information than a random dataset. To answer this question we employed a 278
permutation tail probability (PTP) test (Faith, 1991; Faith and Cranston, 1991) in PAUP* to 279
test for significant cladistic structure and used the g1 statistic to evaluate the skew in the tree 280
length distributions. The PTP test shows whether the structure in the most parsimonious tree 281
could have arisen by chance alone. This test randomises character states without replacement 282
across taxa for each character and derives the shortest tree-length for the randomised dataset. 283
Tree-length reflects the degree to which shared characters co-vary upon a tree for a given 284
character set. A value for the cladistic covariation was obtained by comparing the length of 285
tree-length of the BLH shortest tree is not significantly smaller than shortest trees from the 287
same dataset after randomisation then BLH data contains no significant phylogenetic 288
structure. This study used 10000 randomised datasets to test for phylogenetic structure. 289
We assessed whether the incongruence between the BLH trees and the other estimates 290
of penguin phylogeny (Fig. 1) could be due to sampling error or noise in the data by using the 291
KH test (Kishino and Hasegawa, 1989) in PAUP*. We used the SH test (Shimodaira and 292
Hasegawa, 1999) implemented in PAUP* (with a resample estimated log-likelihood [RELL] 293
test distribution using 1000 bootstrap replicates) to compare the molecular tree of Baker et al. 294
(2006) with the trees generated from other datasets. 295
296
Homology testing 297
The homology of the BLH characters was assessed by mapping them onto the best 298
estimate of penguin phylogeny - that derived from the concatenated sequences. Individual and 299
overall measures of homoplasy, and instances of convergence, gains and losses, were 300
calculated for BLH characters by mapping them onto the concatenated sequence tree. We took 301
as our best measure of penguin phylogeny a tree derived from >5kb of mitochondrial and 302
nuclear DNA (Baker et al., 2006). Other molecular studies, e.g., Bertelli and Giannini (2005) 303
and Ksepka and Clarke (2010) provide largely similar placements of penguin taxa. This tree 304
will hereafter be described as the molecular tree. 305
306
Display characters 307
In order to assess relative phylogenetic value of display or behavioral (14–25, 30–35, 308
37–40) compared to non-display or life history (1–13, 26–29, 36, 41–68) characters, these 309
characters were mapped onto the molecular tree and measures of homoplasy (consistency 310
index [CI] and retention index [RI]) and numbers of gains and losses were calculated for each 311
using the branch and bound option of PAUP*. The trees were then compared to the molecular 313
tree. 314
315
Character evolution 316
The non-continuous BLH characters were optimized onto the molecular tree using a 317
parsimony approach and character states were reconstructed to determine the likely states 318
present in the most recent common ancestor of extant penguins (MRCA). There are several 319
methods by which characters are optimized onto trees and ancestors reconstructed. The most 320
appropriate method of optimising BLH characters is the Acctran option of PAUP*. The 321
Acctran option prefers reversals over parallelisms which approximates our assumption that 322
complex behaviors are unlikely to continue to evolve in concert in different species. Retention 323
indices were calculated for each character (when mapped onto the molecular tree), and these 324
were compared for display versus non-display characters. 325
326
Results 327
Phylogenetic analysis 328
Parsimony analysis of the 68 unordered BLH characters (Table 1, Appendix 1) 329
produced two shortest trees (Fig. 2; TL = 190, CI = 0.56 and RI = 0.59). Parsimony analysis of 330
the same BLH dataset using dollo parsimony for 15 of the characters produced a single most-331
parsimonious tree (Fig. 3, TL = 196, CI = 0.54, RI = 0.67). The dollo tree differed from both 332
unordered trees (although not significantly). For example, both unordered trees had 333
Megadyptes antipodes as sister to a clade comprising the black-footed penguin together with 334
all Pygoscelis and Eudyptes, whereas M. antipodes was placed within Pygoscelis in the dollo 335
analysis. 336
The PTP tests (for both unordered and dollo parsimony) revealed that penguin BLH 337
substantially shorter than all of the trees generated by randomising the data. Similarly, the 339
significantly skewed tree length distributions (g1 = -0.911 for unordered parsimony and g1 = -340
0.629 for dollo parsimony from 10000 random trees, P <0.01; Hillis and Huelsenbeck, 1992) 341
indicates that the data contain significant signal. The BLH trees were generally incongruent 342
with previous estimates of penguin phylogeny (Fig. 1), with some exceptions. Estimates were 343
not significantly different for Jouventin, O’Hara, or Sibley and Ahlquist for the unordered 344
data (Table 2); or for Livezey (external morphology), O’Hara, or Sibley and Ahlquist for the 345
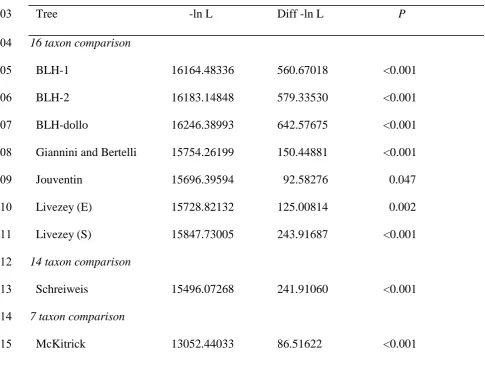
dollo data (Table 3). The SH tests showed that the molecular data could reject the BLH tree 346
topologies and the other alternatives to the molecular tree, except that of Sibley and Ahlquist 347
(Table 4). 348
349
Homology testing 350
The BLH characters were mapped onto the molecular tree. Assessing the covariance of 351
characters onto the trees found seventeen characters (2, 9, 11, 13, 17, 19, 21, 25, 29, 34, 37, 352
38, 43, 47, 50, 65, 67) that had RIs of ≥0.80, i.e. fitted well. Ten characters (4, 10, 14, 20, 23, 353
26, 32, 33, 61, 64) showed a total lack of fit (RI = 0.00), one (27) with an RI of 0.17, and one 354
(44) with an RI of 0.20. Nine characters (3, 5, 6, 28, 53, 55, 56, 57, 62) were autapomorphic, 355
making their RIs irrelevant. 356
357
Display characters 358
Mapping of display and non-display characters onto the molecular tree indicated that 359
they had similar levels of homoplasy (see Fig. 4), i.e. the difference between the RIs was not 360
significant (Mann-Whitney, U = 373.5, df = 1, P = 0.599). This finding suggests that penguin 361
display characters are no less homoplasious than the other BLH characters. 362
Parsimony analysis of the display characters alone produced 268 shortest trees (Fig. 5; 363
shortest trees (Fig. 6; TL = 130, CI = 0.53, RI = 0.569). The Kishino-Hasegawa tests indicated 365
that the display dataset could reject, whereas the non-display dataset could not reject (just), the 366
molecular tree (display: Ldiff = 6, t = 2.3238, P (one tailed) = 0.0152; non-display: Ldiff = 8, t 367
= 1.6641, P (one-tailed) = 0.0515). 368
369
Character evolution 370
The distribution of BLH traits estimated for the MRCA are hypothesized as a pursuit 371
diver that used crustaceans and/or fish as food, capturing food in short local trips in groups. 372
The monogamous MRCA was a hillside nester, probably in arid conditions, had only a local 373
migration phase, and bred in summer with the male contributing to nest and chick duties. 374
Chicks were semi-altrical, nidicolous and creched soon after birth. Moults were complete and 375
occurred in late summer. It performed few current reproductive displays, other than ecstatic 376
and mutual bowing, and few current agonistic displays, except for primarily aggressive 377
behaviors such as bite-nape fighting. Similar results were obtained if alternative outgroups of 378
southern seabirds, Procellariiformes (Pterodroma inexpectata) and Pelecaniformes 379
(Stictocarbo punctatus), were used. 380
381
Discussion 382
Our phylogenetic analyses indicate that penguin behavior and life history traits contain 383
only limited phylogenetic information, unlike the results of several other similar studies of 384
different taxa (e.g., McLennan et al., 1988; Arntzen and Sparreboom, 1989; Prum, 1990; 385
Paterson et al., 1995; Kennedy et al., 1996; Slikas, 1998; Noll, 2002; Stuart et al., 2002). The 386
PTP test and g1 statistics revealed that BLH characters contained more structure than expected 387
due to chance, but the KH and SH tests showed that this signal was significantly different 388
from the presumed correct molecular phylogeny derived from several gene regions. When 389
common phylogenetic signal contained within each (Penny et al., 1982; Zink and Avise, 391
1990). However, the KH tests were significant (P = 0.0432 and 0.0291, thus the BLH data can 392
reject the molecular tree topology) as are the SH tests (all <0.001, thus the molecular data can 393
rejects the BLH tree topologies), all of which implies that there is not a great deal in common 394
between the BLH and molecular trees. Therefore, the structure found in the BLH data is not 395
necessarily generated by phylogeny. This is readily apparent from even a cursory inspection of 396
the BLH trees. In the unordered, dollo, display and non-display trees (Figs. 2–3, 5–6) only the 397
position of Aptenodytes as sister to the rest of the penguins and the monophyly of Eudyptes is 398
the same as the molecular tree. The sister relationship of Aptenodytes agreed with Schreiweis, 399
Jouventin, Livezey, and Sibley and Ahlquist. Both unordered and dollo trees found that 400
Pygoscelis and Spheniscus were polyphyletic, with Black-footed (S. demersus) as sister taxon 401
to Yellow-eyed (M. antipodes) in the dollo tree. The unordered trees agreed with the 402
molecular tree in the placement of most of the Eudyptes taxa. Only the placement of the Erect-403
crested (E. sclateri) within the genus differed from the molecular tree for one of the BLH 404
trees. The dollo tree only found the Macaroni (E. chrysolophus) and Royal (E. schlegeli)pair 405
within Eudyptes. There is no evidence from the other datasets that the pygoscelid penguins are 406
a paraphyletic group. 407
Why is there a minimal amount of phylogenetic information in the BLH dataset? The 408
display characters showed similar levels of homoplasy to the non-display characters, and, if 409
anything, the resulting non-display based phylogeny was marginally less inaccurate (given that 410
it was only just significantly different from the molecular phylogeny) than the display based 411
phylogeny. Adaptation is particularly effective at erasing traces of phylogeny. It may be that 412
penguin behavior and life history is itself severely constrained by the constraints of the marine 413
environment (and changes in morphology to survive there) and that character states often 414
represent convergence and parallelisms rather than homology. Such convergence has been 415
actually produce sounds (Henry et al., 1999). Another issue is that of our homology 417
hypotheses. Although all of our characters satisfied primary homology requirements 418
(characters were similar) and most satisfied secondary homology requirements (character 419
states were congruent with an accepted phylogeny), there are difficulties in coding 420
behavioural character states because there are multiple hypotheses that can be encoded. For 421
example, Ksepka and Clarke (2010) have five reproductive characters in their data set that are 422
similar to ours. However, where Ksepka and Clarke have a character for clutch size and one 423
for size of first egg to second, we have one character where all of this information in encoded 424
into multiple states. Ksepka and Clarke (2010) have one character on nest information 425
whereas we have three. Ksepka and Clark (2010) use the ecstatic display as either present or 426
absent whereas we have six different states. None of these differences are contradictory but 427
they do represent different hierarchical views on the primary homology of penguin behavioral 428
traits. 429
430
Homology testing 431
Studies of behavioral characters have shown that these characters may be no more 432
homoplasious than other types of characters (de Queiroz and Wimberger, 1993; Paterson et 433
al., 1995). We assumed this to be true of the BLH characters used in this study. In general this 434
assumption was supported by the overall distribution of individual RIs. For instance, there 435
were more characters that fitted the molecular tree well (17 with RI ≥0.80) than those that 436
fitted poorly (12 with RI ≤0.20, see Fig. 4), although these 12 introduced considerable 437
homoplasy to estimates of phylogeny. Levels of homoplasy in non-display relative to display 438
characters were similar. A more direct test for the homology of individual characters is to 439
assess whether the behavior has arisen only once. Each display character was mapped on the 440
molecular tree and numbers of gains and losses of each character were derived under two 441
independent gains were thought to be much less likely than independent losses (dollo). 443
Thirteen characters appear to have clearly arisen once. For example, treading (34) arose deep 444
in the lineage and has been retained by all descendent taxa (Fig. 7a). Seven display characters 445
(14, 16, 18, 20, 25, 31, 40) may have arisen twice if gains and losses are considered equally 446
likely and two (24, 35) may have arisen three times. Each of these nine characters was 447
reassessed to calculate the likely number of losses implied if the display had arisen only once 448
(Table 5). For example, the stare behavior (character 18) appears to have arisen twice: in A. 449
patagonicus and in the ancestor of the other penguin genera. If this behavior is assumed to 450
have arisen only once then a loss in the A. forsteri branch is required to explain the observed 451
pattern (Fig. 7b). Only three characters (25: bill hiding, 31: allopreening, and 35: head shake 452
and whine) posit fewer evolutionary events by assuming that the characters are not 453
homologous. For example, bill-hiding (25) may have either evolved twice, once in the 454
Eudyptes and once in the Spheniscus (two events, Fig. 7c), or once deeper in the tree but then 455
lost once in Eudyptula and once in Megadyptes (three events). These BLH characters may 456
represent the type of traits that Tinbergen (1959) hypothesized to be similar "because of the 457
limited number of possibilities of doing the opposite". 458
Stability of behavior over evolutionary time is vital for behavioral characters to be 459
useful in the construction of phylogeny. Penguins have a fossil history of more than 60 mybp 460
(Slack et al., 2006). BLH characters appear to have persisted in penguin lineages over 461
considerable evolutionary periods, e.g., pursuit diving (character 3: state 1), stare (18: 1), bite 462
nape fight (20: 1), ecstatic (30: 1-5), mutual bowing (32: 1), treading (34: 1), and nesting 463
behavior (54: 1). The most parsimonious inference is that many behaviors have persisted since 464
the origin of the extant penguin species, i.e. the behavioral characters have persisted for at 465
least 13 million years (Ksepka and Clarke, 2010) or possibly as much as 30 million years 466
(Baker et al., 2006). Ethologists have often assumed that behaviors can be simply divided into 467
this division is simplistic and misleading (Lehrman, 1953; Gray, 1992). One assumption that 469
is typically thought to follow is that only behaviors considered to be "innate" contain 470
phylogenetic information. This would exclude many behaviors that may have phylogenetic 471
value. What is important for the persistence of behavioral characters down lineages is not how 472
the behavior develops but that the conditions necessary for the development of the behavior 473
reliably reoccur through the phylogenetic history of organisms (Gray, 1989; Gray, 1992). 474
Many features of the penguin's physical (e.g. marine habitat, constant temperature, salinity) 475
and social (e.g. predators, competitors, colonial nesting) environment, and morphology (e.g. 476
flippers, monotypic feathers) have remained unaltered over millions of years. The persistence 477
of these features may lead to repeated development of phylogenetically informative behavioral 478
characters. 479
480
Character evolution 481
By examining the distribution of BLH character states at the internal branch between 482
the outgroup and penguins,we reconstructed the likely BLH traits of the MRCA. The penguin 483
ancestor has been claimed to be either a member of the genus Eudyptula or at least 484
eudyptulid-like and inhabited the New Zealand region (Jouventin, 1982). Phylogenetic 485
evidence from the molecular tree indicated that Eudpytula is not the basal genus of the 486
penguins (or in any of the hypotheses of Fig.1). The Magellanic (S. magellanicus) and Gentoo 487
(P. papua) were found to have most sequence composition in common with the hypothesised 488
MRCA. Most of the shared BLH character states between the MRCA and these species are 489
those in common with the majority of the other penguin taxa. It appears unlikely, therefore, 490
that the most recent common ancestor of extant penguins was more similar, in terms of 491
behavior and life history, to the Little blue (E. minor) than to the other penguin species. 492
The MRCA had a similar life history to extant penguins but had few of the ritualised 493
(1975; 1976), Jouventin (1982) and Fordyce and Jones (1990). One problem with assessing 495
BLH character states of ancestors is that we obviously cannot reconstruct extinct behaviors. 496
The reconstructed MRCAappears to have had few complex displays, or if it did, they were 497
subsequently lost in lineages leading to extant species. The latter seems unlikely, as the 498
likelihood of most of the MRCA complex behaviors completely disappearing to be replaced 499
by new complex behaviors would require many evolutionary events. The idea of the 500
MRCAwith fairly simple BLH traits is also consistent with several ethological views on the 501
evolution of behavior. For example, the ritualisation of behavior is the evolutionary change of 502
a behavior in a direction that exaggerates the signal delivered to the receiver (Tinbergen, 503
1959; Harper, 1991). A simple behavior may change over evolutionary time to become more 504
complex (ritualised) to reduce signal ambiguity and manipulate and deceive the receiver 505
(Harper, 1991). Alternatively, a simple behavior may become more complex over time by run-506
away sexual selection due to a Fisherian process or because the behavior is an advertisement 507
for male quality (Kodric-Brown and Brown, 1984). All of these alternatives are consistent 508
with an ancestor possessing less complex behaviors. 509
Did the MRCA inhabit Zealandia (Trewick et al., 2007)? New Zealand, and its 510
surrounding islands, shows the greatest diversity of penguin species with five of the six 511
penguin genera breeding or migrating throughout the region. New Zealand has, thus, been 512
viewed as the likely area for origin of penguins (Jouventin, 1982; Fordyce and Jones, 1990). 513
During the key phase of extant penguin diversification, the Zealandia region was largely 514
inundated with only small island groups available for habitation (Landis et al., 2008). Baker et 515
al. (2006) have suggested that extant penguins moved out of Antarctica during this period and 516
colonised the more temperate regions. Both of the basal penguin genera, Aptenodytes and 517
Pygoscelis, currently inhabit high southern latitudes. BLH traits of the MRCA are generally 518
consistent with inhabiting this region with short summers in which to breed, (e.g. breeding in 519
period, creching of chicks, moulting in late summer, when there is plentiful food). In the mid 521
to late Cretaceous New Zealand occupied a more cold temperate and southerly position, 85– 522
55°S (Fleming, 1979; Stevens, 1989; Cooper and Millener, 1993). Given that the MRCA is 523
most similar in behavior and life history to the extant Magellanic (S. magellanicus) and 524
Gentoo (P. papua) and that both of these species inhabit high latitude temperate regions the 525
evidence is consistent with a hypothesis that penguins originated in the Zealandia region. 526
One particular confounding factor in this study may be the use of a single outgroup. 527
The lack of several outgroups was largely the result of a difficulty in homologising behaviors 528
in other possible bird groups. Penguins are a very distinct taxonomical group with a 529
behavioral environment that differs from other birds. Close relatives, like Procellariiformes, 530
share a common ancestor with penguins in excess of 60 million years ago (Ksepka and 531
Clarke, 2010). We attempted to obtain traits from Procellariiformes and Pelecaniformes but 532
found it difficult to make sensible homologies. Nixon and Carpenter (2012) suggest that it is 533
more sensible not to hypothesize homology when analogy is more likely. We could sensibly 534
find homologies between Charadriiformes species and the penguins but given that the origin 535
of the extant penguins may be as recent as 12 million years ago (Ksepka and Clarke, 2010) 536
there is no simple way to break the long branch to the outgroup. This is a weakness of using 537
behaviour traits and may affect the rooting of the phylogeny and other aspects of topology. 538
A parsimony approach to reconstructing ancestral states is not without its flaws 539
(Cunningham, 1999). Several other methods using maximum likelihood (Schluter et al., 1997; 540
Maddison and Maddison, 2011) and generalised least squares (Martins, 1999; 2004) are more 541
sophisticated approaches. For the most part, however, these work with continuous characters 542
which make up only a few of those presented in this study or require models of evolution for 543
traits that are currently unknown for behavior. 544
In summary, Brooks and McLennan (1991) have emphasized the productive links that 545
that phylogenetic methods can 1) partially reconstruct penguin phylogeny from behavioral and 547
life history data, 2) assess the homology of behavioral characters, and 3) make inferences 548
about behavioral and ecological evolution. Why are BLH characters in penguins less 549
phylogenetically informative than BLH traits in other bird groups, such as procellariiforms 550
(Paterson et al., 1995), manakins (Prum, 1990), pelecaniforms (Kennedy et al., 1996) and 551
storks (Slikas, 1998)? Homoplasy can be an indication that you have made an error in 552
homologising traits (Nixon and Carpenter, 2012). Penguin BLH traits are either more difficult 553
to operationally group into characters and states, or are more prone to convergence. Most of 554
the behavioral traits appear to have persisted for a great length of time. It may be that, like 555
morphology, much of penguin behavior and life history is subject to intense constraints from 556
the marine environment and that this adaptive force tends to obscure phylogenetic signal. 557
Identifying penguin BLH traits that are less prone to adaptive pressure from the marine 558
environment, like reproductive displays, clutch size and nest-site fidelity, may provide a 559
source of characters that contain primarily phylogenetic information. 560
561
Acknowledgements 562
Thanks to John Croxall, Steve Broni and Lloyd Davis for comments on an earlier 563
version of our behavioral and life history characters. This work was funded by: a University of 564
Otago Research Grant and Research Assistantship (GPW and RDG), Lincoln University 565
Research Fund (AMP), and a University of Auckland Research Grant (RDG). 566
567
References 568
Agnarsson, I., Coddington, J. A. 2007. Quantitative test of primary homology. Cladistics 23, 569
1–11. 570
Arntzen, J. W., Sparreboom, M. 1989. A phylogeny for the old world newts, genus Triturus: 571
Aronson, L. R. 1981. Evolution of telencephalic function in lower vertebrates. In: Laming, P. 573
R. (Ed.) Brain mechanisms of behavior in lower vertebrates. Cambridge University 574
Press, Cambridge, pp. 33–58. 575
Atz, J. W. 1970. The application of the idea of homology to behavior. In: Aronson, L. R., 576
Tobach, E., Lehrman, D. S., Rosenblatt, J. S. (Eds.), Development and evolution of 577
behavior: essays in memory of T.C. Schneirla. W.H. Freeman, San Francisco, pp. 53– 578
74. 579
Baker, A. J., Pereira, S. L., Haddrath, O. P., Edge, K.-A. 2006. Multiple gene evidence for 580
expansion of extant penguins out of Antarctica due to global cooling. Proc. R. Soc. 581
Lond. B. 273, 11–17. 582
Beehler, B. M., Swaby, R. J. 1991. Phylogeny and biogeography of the Ptiloris riflebirds 583
(Aves: Paradisaeidae). Condor 43, 738–745. 584
Bertelli, S., Giannini, N. P. 2005. A phylogeny of extant penguins (Aves: Sphenisciformes) 585
combining morphology and mitochondrial sequences. Cladistics 21, 209–239. 586
Bledsoe, A. H., Raikow, R. J. 1990. A quantitative assessment of congruence between 587
molecular and nonmolecular estimates of phylogeny. J. Mol. Evol. 30, 247–259. 588
Brooks, D. R., McLennan, D. A. 1991. Phylogeny, ecology and behavior: a research program 589
in comparative biology. University of Chicago Press, Chicago. 590
Brower, A. V. Z., Schawaroch, V. 1996. Three steps of homology assessment. Cladistics 12, 591
265–272. 592
Clarke, J. A., Ksepka, D. T., Stucchi, M., Rubina, M., Giannini, N., Bertelli, S., Narvaez, Y., 593
Boyd, C. A. 2007. Paleogene equatorial penguins challenge the proposed relationship 594
between biogeography, diversity, and Cenozoic climate change. Proceedings of the 595
National Academy of Sciences 104, 11545–11550. 596
Cooper, R. A., Millener, P. R. 1993. The New Zealand biota: Historical background and new 597
Costa, D. P. 1991. Reproductive and foraging energetics of high latitude penguins, albatrosses 599
and pinnipeds: Implications for life history patterns. Am. Zool. 31, 111–131. 600
Cracraft, J. 1985. Monophyly and the phylogenetic relationships of the Pelecaniformes: A 601
numerical cladistic analysis. Auk 102, 834-853. 602
Cramp, S. 1983. The birds of the Western Palearctic. Oxford University Press, Oxford. 603
Crowe, T. M., Harley, E. H., Jakutowicz, M. B., Komen, J., Crowe, A. A. 1992. Phylogenetic, 604
taxonomic and biogeographical implications of genetic, morphological, and 605
behavioural variation in francolins (Phasianidae: Francolinus). Auk 109, 24-42. 606
Cruickshank, R. C., Paterson, A. M. 2006. The Great Escape: Do Parasites Break Dollo’s 607
Law? Trends in Parasitology 22, 509–515. 608
Cunningham, C. W. 1999. Some limitations of ancestral character-state reconstruction when 609
testing evolutionary hypotheses. Systematic Biology 48, 665–674. 610
de Queiroz, A., Wimberger, P. H. 1993. The usefulness of behaviour for phylogeny 611
estimation: Levels of homoplasy in behavioural and morphological characters. 612
Evolution 47, 46-60. 613
del Hoyo, J., Elliot, A., Sargatal, J. (Eds.) 1992. Handbook of the birds of the world. Lynx 614
Edicions, Barcelona. 615
Doyle, J. J. 1993. DNA, phylogeny, and the flowering of plant systematics. Bioscience 43, 616
380–389. 617
Edwards, S. V., Naeem, S. 1993. The phylogenetic component of cooperative breeding in 618
perching birds. American Naturalist 141, 754-789. 619
Eernisse, D. J., Albert, J. S., Anderson, F. E. 1992. Annelida and Arthropoda are not sister 620
taxa: A phylogenetic analysis of spiralian metazoan morphology. Systematic Biology 621
41, 305-330. 622
Ehrlich, P. R., Dobkin, D. S., Wheye, D. 1988. The birders handbook. Simon and Schuster 624
Incorparated, New York. 625
Faith, D. P. 1991. Cladistic tests for monophyly and nonmonophyly. Systematic Zoology 40, 626
366-375. 627
Faith, D. P., Cranston, P. S. 1991. Could a cladogram this short have arisen by chance alone? 628
On permutation tests for cladistic structure. Cladistics 7, 1-28. 629
Felsenstein, J. 1983. Parsimony in systematics: biological and statistical issues. Ann. Rev. 630
Ecol. Syst. 14, 313–333. 631
Fleming, C. A. 1979. The geological history of New Zealand and its life. University of 632
Auckland and Oxford University Press, Auckland. 633
Fordyce, R. E., Jones, C. M. 1990. Penguin history and new fossil material from New 634
Zealand. In: Davis, L. S., Darby, J. T. (Eds.), Penguin Biology. Academic Press, San 635
Diego, pp. 419–446. 636
Giannini, N. P., Bertelli, S. 2004. Phylogeny of extant penguins based on integumentary and 637
breeding characters. Auk 121, 422–434. 638
Gittleman, J. L., Kot, M. 1990. Adaptation: Statistics and a null model for estimating 639
phylogenetic effects. Syst. Zool. 39, 227–241. 640
Gray, R. D. 1989. Oppositions in panbiogeography: Can the conflicts between selection, 641
constraint, ecology, and history be resolved? N. Z. J. Zool. 16, 787–806. 642
Gray, R. D. 1992. Death of the gene: Developmental systems strike back. In: Griffiths, P. E. 643
(Ed.) Trees of life. Kluwer, Dordrecht, pp. 165-209. 644
Harper, D. G. C. 1991. Communication. In: Krebs, J. R., Davies, N. B. (Eds.), Behavioural 645
Ecology: an Evolutionary Approach. Blackwell, Oxford, pp. 374–397. 646
Harvey, P. H., Pagel, M. D. 1991. The comparative method in evolutionary biology. Oxford 647
Henry, C. S., Wells, M. L. M., Simon, C. M. 1999. Convergent evolution of courtship songs 649
among cryptic species of the carnea group of green lacewings (Neuroptera: 650
Chrysopidae: Chrysoperla). Evolution 53, 1165-1179. 651
Hillis, D. M., Huelsenbeck, J. P. 1992. Signal, noise, and reliability in molecular phylogenetic 652
analyses. Journal of Heredity 83, 189-195. 653
Hinde, R. A., Tinbergen, N. 1965. The comparative study of species-specific behavior. In: 654
T.E., M. (Ed.) Readings in animal behavior. Holt, Rinehart and Winston, New York, 655
pp. 58–70. 656
Japyassu, H. F., de A. Machado, F. 2010. Coding behavioural data for cladistic analysis: using 657
dynamic homology without parsimony. Cladistics 26, 625–642. 658
Jouventin, P. 1982. Visual and vocal signals in penguins, their evolution and adaptive 659
characters. Verlag Paul Parey, Berlin and Hamburg. 660
Kennedy, M., Spencer, H. G., Gray, R. D. 1996. Hop, step and gape: Do the social displays of 661
the Pelecaniformes reflect phylogeny? Animal Behaviour 51, 273-291. 662
Kishino, H., Hasegawa, M. 1989. Evaluation of the maximum likelihood estimate of the 663
evolutionary tree topologies from DNA sequence data, and the branching order in 664
Hominoidea. Journal of Molecular Evolution 29, 170-179. 665
Kodric-Brown, A., Brown, J. H. 1984. Truth in advertising: the kinds of traits favored by 666
sexual selection. Am. Nat. 124, 309–323. 667
Ksepka, D. T., Clarke, J. A. 2010. The basal penguin (Aves: Sphenisciformes) Perudyptes 668
devriesi and a phylogenetic evaluation of the penguin fossil record. Bulletin of the 669
American Museum of Natural History 337, 1–77. 670
Landis, C. A., Campbell, H. J., Begg, J. G., Mildenhall, D. C., Paterson, A. M., Trewick, S. A. 671
2008. The Waipounamu erosion surface: questioning the antiquity of the New Zealand 672
Langtimm, C. A., Dewsbury, D. A. 1991. Phylogeny and evolution of rodent copulatory 674
behaviour. Animal Behaviour 41, 217-225. 675
Lehrman, D. S. 1953. A critique of Konrad Lorenz's theory of instinctive behaviour. Quarterly 676
Review of Biology 28, 337-363. 677
Livezey, B. C. 1989. Morphometric patterns in recent and fossil penguins (Aves, 678
Sphenisciformes). J. Zool. 219, 269–307. 679
Lorenz, K. Z. 1935. Der kumpan in der umwelt des vogels. J. Orn. 83. 680
Lorenz, K. Z. 1941. Vergleichende bewegungsstudien an anatinen. J. Orn. 89, 194-294. 681
Lorenz, K. Z. 1958. The evolution of behavior. Sci. Am. 199, 67–68. 682
Maddison, D. R., Maddison, W. P. 2005. MacClade 4: Analysis of phylogeny and character 683
evolution. Sinauer Associates, Sunderland, Massachusetts. 684
Maddison, W. P., Maddison, D. R. 2011. Mesquite: A modular system for evolutionary 685
analysis. 686
Marchant, S., Higgins, P. J. 1990. Handbook of Australian, New Zealand and Antarctic birds, 687
Vol.1: Ratites to ducks. Oxford University Press, Oxford. 688
Martins, E. P. 1999. Estimation of ancestral states of continuous characters: A computer 689
simulation study. Syst. Biol. 48, 642–650. 690
Martins, E. P. 2004. COMPARE, version 4.6b. Computer programs for the statistical analysis 691
of comparative data. Department of Biology, Indiana University, Bloomington IN, pp. 692
Distributed by the author at http://compare.bio.indiana.edu/. 693
Martins, E. P., Hansen, T. F. 1997. Phylogenies and the comparative method: A general 694
approach to incorporating phylogenetic information into the analysis of interspecific 695
data. Am. Nat. 149, 646–667. 696
Mattern, M. Y., McLennan, D. A. 2004. Total evidence phylogeny of Gasterostiedae: 697
McArdle, B., Rodrigo, A. G. 1994. Estimating the ancestral states of a continuous–valued 699
character using squared-change parsimony: An analytical solution. Syst. Biol. 43, 573– 700
578. 701
McKitrick, M. C. 1991. Phylogenetic analysis of avian hindlimb musculature. University of 702
Michigan, Ann Arbor. 703
McKitrick, M. C. 1992. Phylogenetic analysis of avian parental care. Auk 109, 828-846. 704
McKitrick, M. C. 1994. On homology and the ontological relationship of parts. Syst. Biol. 43, 705
1–10. 706
McLennan, D. A. 1991. Integrating phylogeny and experimental ethology: From pattern to 707
process. Evolution 45, 1773-1789. 708
McLennan, D. A., Brooks, D. R., McPhail, J. D. 1988. The benefits of communication 709
between comparative ethology and phylogenetic systematics: a case study using 710
gasterosteid fishes. Canadian Journal of Zoology 66, 2177-2190. 711
McLennan, D. A., Mattern, M. Y. 2001. The phylogeny of the Gasterosteidae: Combining 712
behavioral and morphological data sets. Cladistics 17, 11-27. 713
Miyamoto, M. M., Fitch, W. M. 1995. Testing species phylogenies and phylogenetic methods 714
with congruence. Systematic Biology 44, 64-76. 715
Nixon, K. C., Carpenter, J. M. 2012. On homology. Cladistics 28, 160–169. 716
Noll, F. B. 2002. Behavioral phylogeny of corbiculate Apidae (Hymenoptera: Apinae), with 717
special reference to social behavior. Cladistics 18, 137–153. 718
Nugent, G. 1982. Sexing Black-backed Gulls from external measurements. Notornis 29, 37-719
40. 720
O'Hara, R. J. 1989. An estimate of the phylogeny of the living penguins (Aves: Spheniscidae). 721
Am. Zool. 29, A11. 722
Omland, K. E. 1999. The assumptions and challenges of ancestral state reconstructions. Syst. 723
Packer, L. 1991. The evolution of social behaviour and nest architecture in sweat bees of the 725
subgenus Evylaeus (Hymenoptera: Halictidae): a phylogenetic approach. Behavioural 726
Ecology and Sociobiology 29, 153-160. 727
Page, R. D. M. 1990. Component analysis: A valiant failure? Cladistics 6, 119-136. 728
Page, R. D. M. 1992. COMPONENT user manual (Release 2.0). Natural History Museum, 729
London. 730
Paterson, A. M., Gray, R. D., Wallis, G. P. 1993. Parasites, petrels and penguins: Does louse 731
phylogeny reflect seabird phylogeny? International Journal of Parasitology 23, 515-732
526. 733
Paterson, A. M., Wallis, G. P., Gray, R. D. 1995. Penguins, petrels and parsimony: Does 734
cladistic analysis of behaviour reflect seabird phylogeny? Evolution 49, 974-989. 735
Penny, D., Foulds, L. R., Hendy, M. D. 1982. Testing the theory of evolution by comparing 736
phylogenetic trees constructed from five different protein sequences. Nature 297, 197-737
200. 738
Price, J. J., Lanyon, S. M. 2002. Reconstructing the evolution of complex bird song in the 739
oropendolas. Evolution 56, 1514–1529. 740
Proctor, H. C. 1992. Sensory exploitation and the evolution of male mating behaviour: A 741
cladistic test using water mites (Acari: Parasitengona). Animal Behaviour 44, 745-742
752. 743
Prum, R. O. 1990. Phylogenetic analysis of the evolution of display behaviour in the 744
neotropical mannakins (Aves: Pipridae). Ethology 84, 202–231. 745
Robertson, C. J. R. 1985. Reader's Digest complete book of New Zealand birds. Read 746
Methuen, Sydney. 747
Robillard, T., Höbel, G., Gerhardt, H. C. 2006. Evolution of advertisement signals in North 748
American hylid frogs: vocalizations as end-products of calling behavior. Cladistics 22, 749
Saunders, D. 1971. Seabirds. Hamlyn Press, London. 751
Schluter, D., Price, T., Mooers, A. O., Ludwig, D. 1997. Likelihood of ancestor states in 752
adaptive radiation. Evolution 51, 1699–1711. 753
Scholes, E. 2008. Evolution of the courtship phenotype in the birds of paradise genus Parotia 754
(Aves: Paradisaedae): homology, phylogeny, and modularity. Biological Journal of the 755
Linnean Society 94, 491–504. 756
Schreiweis, D. O. 1972. A comparative study of the appendicular musculature of the Order 757
Sphenisciformes. Washington State University., Pullman. 758
Shimodaira, H., Hasegawa, M. 1999. Multiple comparisons of log-likelihoods with 759
applications to phylogenetic inference. Molecular Biology and Evolution 16, 1114– 760
1116. 761
Sibley, C. G., Ahlquist, J. E. 1990. Phylogeny and classification of birds: A study in 762
molecular evolution. Yale University Press, New Haven. 763
Sillen-Tullberg, B., Møller, A. P. 1993. The relationship between concealed ovulation and 764
mating systems in anthropoid primates: A phylogenetic analysis. American Naturalist 765
141, 1-25. 766
Simpson, G. G. 1975. Fossil penguins. In: Stonehouse, B. (Ed.) The Biology of Penguins. 767
MacMillan Press, London, pp. 19–41. 768
Simpson, G. G. 1976. Penguins: Past and present, here and there. Yale University Press, New 769
Haven. 770
Slack, K. E., Jones, C. M., Ando, T., Harrison, G. L. A., Fordyce, R. E., Arnason, U., Penny, 771
D. 2006. Early penguin fossils, plus mitochondrial genomes, calibrate avian evolution. 772
Molecular Biology and Evolution 23, 1144–1155. 773
Slikas, B. 1998. Recognizing and testing homology of courtship displays in storks (Aves: 774
Ciconiiformes: Ciconiidae). Evolution 52, 884-893. 775
Stevens, G. R. 1989. The nature and timing of biotic links between New Zealand and 777
Antarctica in Mesozoic and early Cenozoic times. In: Crame, J. A. (Ed.) Origins and 778
Evolution of the Antarctic Biota. Geological Society Special Publication, pp. 141–166. 779
Stonehouse, B. 1975. Penguin Biology. MacMillan Press, London. 780
Stuart, A. E., Currie, D. C. 2001. Using caddisfly (Trichoptera) case-building behaviour in 781
higher level phylogeny reconstruction. Canadian Journal of Zoology 79, 1842-1854. 782
Stuart, A. E., Currie, D. C. 2002. Behaviour is not reliably inferred from end-product structure 783
in Caddisflies. Ethology 108, 837–856. 784
Stuart, A. E., Hunter, F. F. 1998. End-products of behaviour versus behavioural characters: A 785
phylogenetic investigation of pupal cocoon construction and form in some North 786
American black flies (Diptera: Simuliidae). Systematic Entomology 23, 387-398. 787
Stuart, A. E., Hunter, F. F., Currie, D. C. 2002. Using behavioural characters in phylogeny 788
reconstruction. Ethology, Ecology & Evolution 14, 129–139. 789
Swofford, D. L. 2002. PAUP*. Phylogenetic Analysis Using Parsimony (*and Other 790
Methods). Sinauer Associates, Sunderland, Massachusetts. 791
Swofford, D. L., Maddison, W. P. 1987. Reconstructing ancestral character states under 792
Wagner parsimony. Math. Biosci. 87, 199–229. 793
Templeton, A. R. 1983. Phylogenetic inference from restriction endonuclease cleavage site 794
maps with particular reference to the evolution of humans and the apes. Evolution 37, 795
221–244. 796
Tinbergen, N. 1959. Comparative studies of the behaviour of gulls (Laridae): A progress 797
report. Behaviour 15, 1-70. 798
Trewick, S. A., Paterson, A. M., Campbell, H. J. 2007. Hello New Zealand. Journal of 799
Biogeography 34, 1–6. 800
Waas, J. R. 1991. Intraspecific variation in social repertoires: Evidence from cave- and 801
Wagner, G. P. 1989. The origin of morphological characters and the biological basis of 803
homology. Evolution 43, 1157–1171. 804
Warham, J. 1974. The Fiordland Crested Penguin, Eudyptes pachyrhynchus. Ibis 116, 1–27. 805
Watson, G. E. 1975. Birds of the Antarctic and Subantarctic. William Byrd Press, Richmond. 806
Weimerskirch, H., Stahl, J. C., Jouventin, P. 1992. The breeding biology and population 807
dynamics of King Penguins Aptenodytes patagonicus on the Crozet Islands. Ibis 134, 808
107–117. 809
Williams, A. J. 1981a. The clutch size of macaroni and rockhopper penguins. Emu 81, 87–90. 810
Williams, A. J. 1981b. The laying interval and incubation period of rockhopper and macaroni 811
penguins. Ostrich 52, 226–229. 812
Winkler, D. W. 2000. The phylogenetic approach to avian life histories: An important 813
complement to within-population studies. Condor 102, 52–59. 814
Winkler, D. W., Sheldon, F. W. 1993. Evolution of nest construction in swallows 815
(Hirundinidae): A molecular phylogenetic perspective. Proceedings of the National 816
Academy of Sciences, USA 90, 5705-5707. 817
Zink, R. M., Avise, J. C. 1990. Patterns of mitochondrial DNA and allozyme evolution in the 818
avian genus Ammodramus. Systematic Zoology 39, 148-161. 819
Zyskowski, K., Prum, R. O. 1999. Phylogenetic analysis of the nest architecture of neotropical 820
ovenbirds (Furnariidae). Auk 116, 891-911. 821
822
Table 1 824
Matrix showing behavioral and life history character data for all taxa 825
1 2 3 4 5 6
826
12345678901234567890123456789012345678901234567890123456789012345678
827
Larus dominicanus Southern black-backed gull 000000?00??0?000000000000001?000000?00000000000?000?00?000000000??0?
828
Aptenodytes forsteri Emperor penguin 021010101?0200130000101000110301104111001011122111101111211230101210
829
Aptenodytes patagonicus King penguin 021010111?0100130201101000110311003111001011020111001111111120101210
830
Pygoscelis antarctica Chinstrap penguin 13101?00000001?1?11111110?0121?1112000??000011??141?11112112010001?1
831
Pygoscelis adeliae Adelie penguin 031010000100011101111211000?210111010010110011?00201121120122?1001?1
832
Pygoscelis papua Gentoo penguin 03111000010000?20??1????001?240111100012000001?0020?11112?321?100110
833
Spheniscus demersus Black-footed penguin 121110000?20102112?11211100?221111?0001100211??1?40?1111204340?00?11
834
Spheniscus magellanicus Magellanic penguin 121010?0??2110?0?????0???01?141111?100??02202??1041???11202200100111
835
Eudyptula minor Little blue penguin 121210100101001111112100010?121111000000002021?00401111120321001?211
836
Megadyptes antipodes Yellow-eyed penguin 12111100?0000021111132000?103110110100110000211114111101201210110011
837
Eudyptes pachyrhynchus Fiordland penguin 11101000??11002101113111100131111100000112002111031?1211203210012120
838
Eudyptes robustus Snares penguin 131010?0?11100211?11311110113111112?0001120121?10311121120200?002120
839
Eudyptes sclateri Erect-crested penguin 131010?0?1?1002111113111??0?3111112?0001120100110310111120200?00?11?
Eudyptes chrysocome Rockhopper penguin 13101000?10?002?11113?111111341111200011120021?1031?111120200?002110
841
Eudyptes chrysolophus Macaroni penguin 13101001010?0?2?1?1131?110013511??2?001?1000111?0310111120200?102110
842
Eudyptes schlegeli Royal penguin 131?1001?10?0?211111311?10013111112?0011100111?1031?11?1202000002111
843
Missing data indicated by "?". Characters and character states are identified in Appendix 1. 844
Table 2 846
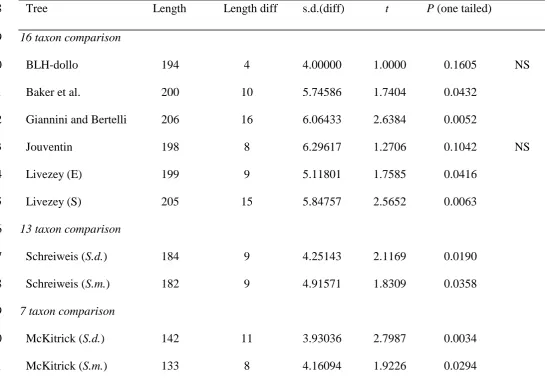
Results of Kishino-Hasegawa tests comparing other estimates of phylogeny of the penguins (e.g., see Fig. 1) to those derived from the BLH data 847
Tree Length Length diff s.d.(diff) t P (one tailed) 848
16 taxon comparison 849
BLH-dollo 194 4 4.00000 1.0000 0.1605 NS
850
Baker et al. 200 10 5.74586 1.7404 0.0432
851
Giannini and Bertelli 206 16 6.06433 2.6384 0.0052 852
Jouventin 198 8 6.29617 1.2706 0.1042 NS
853
Livezey (E) 199 9 5.11801 1.7585 0.0416
854
Livezey (S) 205 15 5.84757 2.5652 0.0063
855
13 taxon comparison 856
Schreiweis (S.d.) 184 9 4.25143 2.1169 0.0190 857
Schreiweis (S.m.) 182 9 4.91571 1.8309 0.0358 858
7 taxon comparison 859
McKitrick (S.d.) 142 11 3.93036 2.7987 0.0034 860