Lincoln University Digital Dissertation
Copyright Statement
The digital copy of this dissertation is protected by the Copyright Act 1994 (New
Zealand).
This dissertation may be consulted by you, provided you comply with the provisions of
the Act and the following conditions of use:
you will use the copy only for the purposes of research or private study
you will recognise the author's right to be identified as the author of the dissertation
and due acknowledgement will be made to the author where appropriate
The Efficacy of a Standoff Pad Wintering System to Capture Urine and
Mitigate Nitrate Leaching Whilst Maintaining Acceptable Levels of Animal
Performance
A dissertation
submitted in partial fulfillment
of the requirement for the Degree of
Bachelor of Agricultural Science
with Honours
at Lincoln University
by
J. E.L Scahill
Lincoln University
i ABSTRACT
Abstract of a Thesis submitted in partial fulfillment of the requirement for
the Degree of Agricultural Science with Honors.
The Efficacy of a Standoff Pad Wintering System to Capture Urine and
Mitigate Nitrate Leaching Whilst Maintaining Acceptable Levels of Animal
Performance
By
J.E.L Scahill
Wintering of dairy cows on high yielding forage crops is a key contributor towards total farm nitrate leaching loses. High stocking density’s, and subsequent excretion of nitrogen-loaded urine, onto bare, saturated soils results in high nitrate leaching rates. Incorporation of standoff facilities into traditional in situ wintering systems has been suggested as a viable approach to mitigating nitrate leaching., but limited quantitative data exists for percentage of urine captured, and the performance of non-lactating dairy cows wintered under such systems.
ii and supplement utilization, cow liveweight, and body condition score were also measured throughout the trial.
Results show there was no difference in dry matter utilization (94.2 + ±3.4%), and liveweight gain (580±6.7 gCow/day) between systems. Apparent energy consumption (123 MJME/cow/day) suggested that body condition score gain targets of 0.5 units would be achievable over a 60 day wintering period. Urination behavior was unaffected by wintering system, with average urination event volumes, urination event frequency’s, and total daily urine volumes of (1.8±1.03l/event), (8.37± 4.34 events/day) and (15.12±5.5l/cow/day) were recorded. The percentage of total urine captured under the standoff pad system (82±8.66%) suggest that the expected quantity captured is reflective of the duration of a stand off period. When compared to a 24 hour in situ system, the capture of 82% of urine reduced estimated urine coverage from 54.6% to 9.6% of total paddock area. Based on established leaching values under fodderbeet in stony, Canterbury soil types, this reduction in paddock urine coverage resulted in an estimated reduction in winter nitrate leaching of 31.4 Kg N/ha or 61.6%. It was therefore concluded that stand off pad systems can be effectively used to mitigate winter nitrate leaching whilst maintaining acceptable levels of cow performance.
iii
TABLE OF CONTENTS
ABSTRACT ... i
Table of Contents ... iii
List of Tables ... v
List of Figures ... vi
1 INTRODUCTION ... 1
1.1 Research Questions ... 2
2 REVIEW OF THE LITERATURE ... 3
2.1 Introduction ... 3
2.2 Nitrate Leaching and Environmental Impacts ... 3
2.3 Nitrate Leaching from Intensive Dairy Systems ... 5
2.3.1 Nitrate Leaching from Grazing- Urinary N Excretion ... 6
2.3.2 The Challenges of Wintering Dairy Cows in Relation to Nitrate Leaching . 7 2.4 Public Concern and Government Regulation ... 8
2.5 Next Generation Wintering Systems ... 8
2.6 Farmer Adoption ... 9
2.7 Efficacy to Meet Animal Performance Targets ... 10
2.8 Efficacy for Standoff Pads to Reduce Nitrate Leaching ... 12
2.8.1 Urination Behavior ... 12
2.9 Conclusions and Research Objectives ... 14
3 MATERIALS AND METHODS ... 15
3.1 Experimental Site and Design ... 15
3.1.1 Grazing Area ... 15
3.1.2 Stand Off Pad and Feed Pad Area ... 16
3.2 Management ... 16
3.2.1 Stand Off Pad Cleaning ... 17
3.3 Measurements ... 17
3.3.1 Crop Yield and Dry Matter Utilization ... 17
3.3.2 Liveweight and Body Condition Score ... 17
3.3.3 Urination Frequency and Volume ... 18
3.3.3.1 Characterisation and Calibration ... 18
3.4 Statistical Analysis ... 19
3.5 Leaching Loss Calculations ... 20
4 RESULTS ... 22
iv
4.2 Crop and Supplement Utilization ... 22
4.3 Body Condition Score and liveweight ... 23
4.4 Urine Sensor Performance ... 24
4.5 Urination Behavior ... 25
4.6 Calculated Urine Patch Coverage and Nitrogen Leaching ... 26
5 DISCUSSION ... 28
5.1 Crop Yield ... 28
5.2 Diet Utilization and Intake ... 28
5.3 Live weight and body Condition Score ... 30
5.4 Urination Behavior ... 32
5.4.1 Paddock Urine Coverage and Nitrogen leaching ... 33
5.5 Conclusions ... 34
Acknowledgements ... 36
v
LIST OF TABLES
vi
LIST OF FIGURES
1
1
INTRODUCTION
The dairy industry is a significant export earner, contributing in excess of $13.59 billion annually to the New Zealand economy (Statistics NZ, 2014). Rapid intensification both at an on farm, and industry wide level, has resulted in an increase in the national cow herd of 1.2 million cows, with an associated increase in stocking rate of 0.1 cows/ha (DairyNZ, n.d). Whilst beneficial to farm profitability, and the New Zealand economy as a whole, the scale and intensity of New Zealand’s dairy industry has significant environmental impacts (Baskaran, Cullen, & Colombo, 2009). Nitrate leaching from intensive production drives eutrophication and degradation of regional waterways; an issue that has come under considerable public scrutiny in recent times (Cameron, Di, & Moir, 2013; van Reenan, 2013). Subsequently, national policies have been released, mandating that regional councils manage land use to mitigate further environmental damage (Ministry for the Environment, 2017). In Canterbury, the country’s most intensive dairying province, the ‘Land & Water Regional Plan’ has been implemented, ultimately functioning to enforce N leaching limits (DairyNZ, n.d). Farmers must therefore adapt their farm systems to meet
regulatory standards. The traditional in situ approach to wintering has been identified as
a key driver of whole farm/enterprise N leaching due to typically high stocking density’s and excretion of N loaded urine onto bare, saturated soils (Monaghan, 2012). The “Pastoral 21” research programme has identified fodderbeet as the optimal wintering crop due to its inherently low N content (Shepherd, Shorten, Costall, & Macdonald, 2017). However, simply changing crop type does not address the impact of high stocking intensity’s, and large nutrient load on wintering areas, and as such it has been suggested that stand-off pad wintering systems can achieve further reductions in winter N leaching
(Shepherd et al., 2017; Volger, Beukes, & Burggraaf, 2013). The efficacy of such systems
2
project therefore aims to answer three key research questions to determine whether standoff pads represent a viable ‘Next Generation Wintering System’.
1.1 Research Questions
This research project aims to answer three key research questions:
- Can non-lactating dairy cows achieve fodderbeet/silage intake rates > 10
kgDM/cow/day under a restricted grazing period?
- Can non-lactating dairy cows achieve acceptable BCS and LW gains under a standoff
wintering system?
- What percentage of total urine volume will be captured under a standoff pad
3
2
REVIEW OF THE LITERATURE
2.1 Introduction
The New Zealand Dairy industry has rapidly intensified both at an on farm, and industry
wide level, driven by increased returns from milk production (Baskaran et al., 2009). An
increase in the national cow herd of 1.2 million cows, has been associated with a rise in average stocking rate of 0.1 cows/ha (DairyNZ, 2016). Whilst beneficial to farm profitability, and the New Zealand economy as a whole, intensification has environmental implications. High levels of nitrate leaching stimulate eutrophication and degradation of
aquifers and waterways (Cameron, Di, & Condron, 2002; Colins et al., 2007; Flemmer &
Flemmer, 2008). Government policies have been released, mandating that regional authorities manage land use to reach targeted reductions in nitrate leaching (DairyNZ, n.d; Ministry for the Environment, 2017). Farmers are therefore looking to adapt their
operational systems to the new reality of ‘farming within limits’ (van Reenan, 2013)
This literature review discusses the environmental impacts of intensive dairy production, identifies the traditional wintering approach as a key driver of total farm nitrate leaching, outlines recent research into ‘Next Generation Wintering Systems’, and discusses shortfalls in the research surrounding the use of restricted grazing and standoff pad systems to mitigate winter nitrate leaching.
2.2 Nitrate Leaching and Environmental Impacts
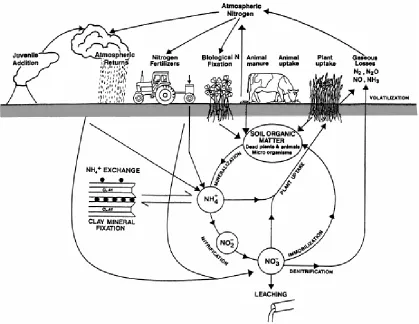
Nitrogen (N) is an essential element for plant growth as it is a primary constituent of amino acids, proteins, chlorophyll molecules (Hatch, Goulding, & Murphy, 2002), enzymes and co-enzymes (Mclaren & Cameron, 1996). To become available for plant uptake, N must be mineralised into (NH4+), or nitrified into nitrate (NO3-). Figure 2-1 displays this in the
nitrogen cycle (Cameron et al., 2013). The process of nitrification represents an
environmental issue; As nitrate is negatively charged, it is not retained within the soils cation exchange matrix (Mclaren & Cameron, 1996). As such, when large drainage events
occur, a portion of free moving NO3- will be leached from the soil solution, and distributed
into local waterways and/or aquifers. Increased nitrate concentration in waterways
4 et al., 2007; Flemmer & Flemmer, 2008). This is driven by eutrophication and the subsequent shading of rivers/lakebeds. As waters shift to trophic levels, populations of plankton, cyanobacteria and blue-green algae increase, resulting in oxygen deprivation and subsequent fish death. A waterway is deemed eutrophic when total N content reaches 0.4-0.6 mg N L (Di & Cameron, 2002). Whilst the quality of waterways in New Zealand is high by international standards, significant degradation has been observed over the past five
decades (Baskaran et al., 2009). Thirty percent of major NZ rivers have higher NO3
-concentrations than were measured in the 1970’s, and currently, 31.8% of New Zealand’s total river length does not meet acceptable guidelines for fresh and marine water quality (Ministry for the Environment, 2011). Furthermore, approximately 39% of monitored groundwater bodies contain elevated nitrate levels above natural background concentrations (Ministry for the Environment, 2011). It is therefore apparent that nitrate leaching is a significant environmental issue.
5 2.3 Nitrate Leaching from Intensive Dairy Systems
It is well established that New Zealand dairy farms leach significant quantities of nitrate (Clark, Givens, & Jeannie, 2007; Parliamentary Commissioner for the Environment, 2004). The quantity of nitrate lost from the soil solution is ultimately driven by two fundamental factors; the amount accumulated in the top soil in excess of plant requirements, and drainage volume through the soil profile (Di & Cameron, 2002). Reflecting this, the greatest period of nitrate leaching typically occurs in autumn and winter, when excess rainfall exceeds evapotranspiration, soil water levels rise above field capacity and plant growth
potential is low (Cameron et al., 2013). Drainage volume is typically outside of the farmer’s
control (except for poor irrigation management). However, the quantity of nitrate in the soil, is driven to a large extent by farm system intensity (Di & Cameron, 2002). Reflecting this, dairy farms have been shown to leach significant quantities of nitrate (25-110 Kg N/ha) when compared to alternative systems such as sheep, grazing and cropping (6-58 Kg N/ha)
(Cameron et al., 2013). The observed difference in system nitrate leaching is driven by
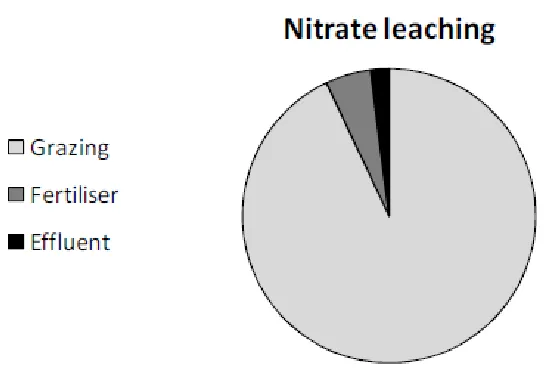
greater nitrogen fertiliser application (Food and Agriculture Organization of the United Nations, 2014), allowing for increased stocking rates and subsequently greater nitrate losses from grazing. The various sources of nitrate leaching are displayed in figure 2-2 (de Klein et al., 2010).
6
In Canterbury, nitrate leaching is driven by regional environmental factors; hot, dry
summers facilitate topsoil accumulation of NO3- and subsequently, greater leaching rates
in autumn and winter (Cameron et al., 2002). The region’s stony soil types (such as
Lismore stony loam and Waimakariri sandy loam) facilitate rapid drainage, and
subsequent removal of nitrate from the soil matrix (Cameron et al., 2013). Furthermore,
Canterbury’s average stocking rate (3.25 cows/ha) is 18% higher than the national average (DairyNZ, 2016), driven by the development of efficient irrigation systems (Sage, 2008). Subsequently, it is recognised as New Zealand’s most productive region on a milksolids per hectare basis, and accounts for 13.8% of the national cow herd (DairyNZ, 2016). High levels of nitrate leaching have therefore been reported in the Canterbury
region (Lilburne et al., 2013). It is apparent that dairy production in Canterbury and New
Zealand as a whole results in significant levels of nitrate leaching, primarily driven by losses from grazing (stocking rate).
2.3.1 Nitrate Leaching from Grazing- Urinary N Excretion
A primary inefficiency of pastoral based farming systems is the discrepancy between plant and animal N requirements for optimal production; dietary N requirements of mature dairy cattle range from 1.8-2.2% of DMI (Pacheco & Waghorn, 2008), considerably lower than
the potential forage N content of 3.4% (de Klein et al., 2010; Ledgard, de Klein, Crush, &
Thorrold, 2000). As such, it has been shown that N voided in urine is closely linked to
dietary N content, with 75-95% of dietary N intake being excreted (Dijkstra et al., 2013;
Eckard, Grainger, & de Klein, 2010). Subsequently, in dairy cows, were N intakes can exceed 400g N/cow/day (Castillo, Kebreab, Beever, & France, 2000), mean urine N
concentrations of 5.5g N L-1 - 8.6g N L-1 and total daily excretions of 80-320g N/cow/day
have been reported (Betteridge et al., 2013; Shepherd et al., 2017; Whitehead et al., 1995).
Subsequent urine patch N loading rates between 200-2000 Kg N/ha have been outlined by Selbie, Buckthought, & Shepherd, (2015), with it being generally accepted that the average
N loading rate is somewhere in the range of 800-1300 Kg N/ha (Cameron et al., 2002;
Eckard et al., 2010). It has been estimated that 8%-20% of N applied as urine is leached
(Cameron et al., 2002) and therefore it can be concluded that urinary N excretion is a key
7
2.3.2 The Challenges of Wintering Dairy Cows in Relation to Nitrate Leaching
Wintering can be broadly defined as “the activity of feeding cows for the 12 week period from late May to late August (Monaghan, 2012). Common practice is to graze winter
forages in situ (Chrystal, Monaghan, Dalley, & Styles, 2012) to address the typically low
pasture growth rates and rapidly increasing maternal energy demands during this period (Dalley, 2013). The high yields of quality forage produced by crops such as kale and
fodderbeet (Chakwizira et al., 2012) allow for stocking density’s in excess of 300-3000
cows/ha (Cichota & Snow, 2009). Assuming a single annual grazing, this equates to a stocking intensity of up to 3000 cow grazing days/ha/yr, considerably greater than the 700 cow days/ha/yr reported for rotationally grazed pastoral blocks (Moir, Cameron, Di, Fertsak, 2010; Whitehead, 2000). As such, comparatively high levels of total paddock urine coverage, and N leaching can be expected under winter forages. In rotational grazing systems, 0.5-9% of the allocated area will receive a urination event within a 24 hour period
(Vellinga et al., 2001), accumulating to 10%-29% annually (average=23%) (Moir et al., 2010;
Macklusky, 1960; Williams, 1998; Whitehead, 2000; White, Sheeld, Washburn, King, &
Green, 2001). In forage based wintering systems, Ravera et al., (2015) reported urine
coverage of 61% and 58% for fodderbeet and kale crops respectively, reflecting the
conclusion of Moir et al., (2010) that an increase in stocking intensity of 10000 cow grazing
hours/ha/yr will result in a 7% increase in paddock urine coverage. Subsequently, winter forage blocks have been shown to leach significant quantities of N, ranging from 51-173 Kg N/ha across a variety of climate, crop and soil types (Dalley, 2011; Shepherd, Stafford, &
Smeaton, 2012; McDowell & Houlbrooke, 2009; Monaghan, Smith, & de Klein, 2013;
Monaghan, 2012; Smith, Orchiston, & Monaghan, 2012).As such, it has been outlined that
winter forage blocks account for disproportionate quantity of whole farm N losses; 11%-
60% from 4% -15% of the total farm area (Chrystal et al., 2012; Monaghan, 2012). It is
therefore apparent that the traditional in situ approach to dairy farm wintering is a
8 2.4 Public Concern and Government Regulation
The apparent contribution of intensive dairy production towards waterway degradation has been recognised, and as such, public pressure for improved environmental practice has increased (Scarsbrook, 2013; van Reenan, 2013). In response, a series of governmental policies have been released, outlining quantifiable targets for regional and national water quality; In 2011 the ‘National Policy Statement for Freshwater Management’ was released (Ministry for the Environment, 2011), whilst more recently, the “Clean Water Package” was launched, with an aim of 100% ‘swimmable’ water ways by 2050 (Ministry for the Environment, 2017). These policy’s ultimately mandate that regional councils manage land use to maintain water quality. In Canterbury, farmers must operate under the councils ‘Land & Water Regional Plan’. This involves a consent to operate, establishment of a nitrogen baseline, and development of a farm environmental plan to ensure that annual
nitrateleaching remains below the established baseline level (DairyNZ, n.d). Furthermore,
farm systems with comparatively high N baselines will be required to meet lower determined ‘good management practice’ loss rates by 2020 (DairyNZ, n.d). Wintering practices will also be regulated; from 2020 onwards, consent will be required to establish winter forage crops over more than 10% of the total farm area (DairyNZ, n.d). It is therefore apparent that intensive dairy operations in Canterbury (and nationwide) must adapt their
systems to the reality of farming within limits (van Reenan, 2013).
2.5 Next Generation Wintering Systems
It is apparent that the wintering period is a key contributor to total farm nitrate leaching,
due to high stocking density’s and urine patch coverage (Cichota & Snow, 2009; Ravera et
al., 2015), negligible N plant uptake, and high drainage volume (Cameron et al., 2002). Therefore, a key regional focus of the DairyNZ Pastoral 21 programme in Canterbury has been on developing ‘Next Generation Wintering Systems’ that allow farmers to meet
baseline N leaching rates (Shepherd et al., 2017). To date, a series of trials have identified
fodderbeet as the ideal crop for dairy cow wintering, due to its inherently low CP
(<10.9%/DM) and low forage N content (<2% DM) (Edwards et al., 2014; Farrel et al., 2016;
Jenkinson, Edwards, & Bryant, 2014). As discussed, the quantity of N voided in urine is
ultimately reflective of dietary N intake (Dijkstra et al., 2013; Eckard et al., 2010), with
9
moderate to high DM allowances, cows offered fodder beet, will achieve a significantly lower nitrogen intake, than those offered kale, or pasture (231 g N/cow/day vs >400 g
N/cow/day)(Edwards et al., 2014; Jenkinson et al., 2014). As such, reduced urine N
concentrations (2.1-4.02 g N/L) and urine patch N loading rates (190-300 Kg N/ha)
(Edwards et al., 2014; Farrel et al. 2016; Hogg, 1981; Jenkinson et al., 2014) have been
reported. It has been established that the quantity of urine N leached increases
exponentially with urine patch N loading rate (de Klein et al., 2010). Reflecting this,
lysimiter based trials reported leaching loses of 21-32% and 43-54% of urine N deposited under fodderbeet and kale wintering systems respectively. The lower leaching rate observed under fodderbeet was attributed to reduced urine N loading, supporting the presumption that that allocation of low CP/N forages can reduce urinary N leaching on a
per cow basis (Li, Betteridge, Cichota, Hoogendorn, & Jolly, 2012; Malcolm, Cameron,
Edwards, & Di, 2014). Estimated paddock scale leaching rates of 64-79 Kg N/ha (Malcolm
et al., 2016), suggest that N losses under fodderbeet systems will be at the lower end of
the 51-173 Kg N/ha range reported across a variety of winter forages (Shepherd et al.,
2012; McDowell & Houlbrooke, 2009; Monaghan et al., 2013; Monaghan, 2012; Smith et
al., 2012). However, simply reducing dietary N intake does not address the effect of high stocking densities on paddock urine patch coverage. It has therefore been suggested, that
incorporation of a stand-off pad into an in situ fodderbeet wintering system may further
reduce nitrate leaching (Shepherd et al., 2017). Standoff pad systems ultimately function
as a hybrid between wintering barns and in situ systems, whereby cows spend only the
time required to consume their forage allocation in the paddock, typically 4-8 hours. Under such systems, a portion of total urine, excreted will be captured on the stand-off, rather
than being deposited on the soil (Volger et al., 2013).
2.6 Farmer Adoption
The increasing public and regulatory pressures for agricultural production systems to meet environmental benchmarks requires farmers to invest in mitigation strategies. In a farmer a survey, Dalley, (2011) reported that 45% of respondents had adapted their wintering
approach away from in situ systems in the 5 years preceding 2013. 14% did so because of
10
incorporating housing/structures into their wintering systems. Simple standoff pads represent an economic alternative to traditional wintering barns. The reported capital outlay of $125-$400/cow (Beukes, Gregorini, Romera, & Dalley, 2011; de Klein, Monaghan, Ledgard, & Shepherd, 2010), is considerably lower than $1500-$3220/cow required for construction of a fully enclosed wintering barn (de Wolde, 2006; Journeaux, 2013; New Zealand Institute of Primary Industry Management, 2014). From an operational perspective, standoff pad systems are cheaper than housed systems, as cow’s still harvest
forage in situ, eliminating the requirement to cut and carry feed, and reducing the portion
of supplement in the diet (de Klein et al., 2010). It is therefore apparent that stand off pads
represent an economical alternative system to traditional on farm structures, that does not require a significant shift away from the typically favored ‘grass based’ approach. However, for farmer adoption to occur, it must be proven that that standoff pad systems can effectively mitigate nitrate leaching, to meet regulatory benchmarks, whilst maintaining acceptable levels of animal performance.
2.7 Efficacy to Meet Animal Performance Targets
The effectiveness of any wintering system is measured by the capacity for cows to meet BCS/LW targets. A BCS of 5 and 5.5 is optimal at parturition for cows and heifers
respectively, with a typical gain of 0.5 units required over winter (Holmes et al., 2007). The
maintenance/pregnancy/activity energy requirements of a non-lactating dairy cow is
expressed as 10.5 MJME/Kg LW0.75, equating to 103 MJME/day for a 510 kg animal (Nicol
& Brookes, 2007). Edwards et al., (2014) suggested that an additional 14-16 MJME/day is
require to gain weight in the cooler Canterbury climate, accumulating to 117-119 MJME/Day to achieve a total winter BCS gain of 0.5 units over a 60 day wintering period. BCS gains ranging from 0.05-0.8 have been outlined across a range of forages at
moderate-high allowances (Keogh, French, McGrath, Story, & Mulligan, 2009; Edwards et al., 2014).
The disparity often observed between estimated ME intake and actual BCS/LW gain is attributed to overestimation of crop yields, underestimation of energy requirements, and incorrect allocations (Judson & Edwards, 2008). However, at actual ME intakes in excess of 119 MJME/cow/day, targeted BCS gains (>0.5 units per 60 days) can be achieved (Edwards
11
MJME/cow/day from a 13.1 Kg DM/cow/day intake of fodderbeet and silage. For a typical
fodderbeet wintering diet (65% fodderbeet, 35% ryegrass silage (Al Marshadesh et al.,
2017; Edwards et al., 2014), a DMI of 6.3 Kg DM/cow/day of fodderbeet (12.2 MJME/Kg
DM. Edwards et al., 2014), and 3.7 KgDM/cow/day of silage (11.1 MJME/Kg DM. de Ruiter
et al., 2007) would be required. It is therefore apparent that to meet typical winter BCS targets, intakes of 10Kg DM/cow/day must be achievable. Under natural ad-libitum
conditions, cattle display two distinctive grazing bouts (morning and evening) (Gregorini et
al., 2009; Linnane, Brereton, & Giller, 2001; Rook, Huckle, & Penning, 1994). However, it has been suggested that restricted grazing drives impulsion to maximize intake rate because of behavioral adaptations (Greenwood & Demmet, 1988). As such, significant (P<0.05) increases in bite rate, bite mass (0.69 g/bite vs 0.49 g/bite) and reduced handling time (690 min vs 950 min) have been reported when grazing is restricted to 6 hours/day (Kennedy et al. 2009). Reflecting this, it has been observed that >70% & >80% of perennial ryegrass intake can be achieved within two and four hours of allocation respectively
(Dobos, Fulkerson, Sinclair, & Hinch, 2009), whilst Gregorini et al., (2009) showed that cows
offered pasture once a day consumed 10 kg DM/cow within three hours. It is therefore apparent that when offered pasture, the rate of DM consumption can be increased by upto 27% (Greenwood & Demmet, 1988), and the grazing period can be restricted to as low as four hours with negligible impacts on DMI and animal performance (Perez-Ramirez, Delgarde, & Delaby, 2008). However, little works exists on the restricted intake of winter forage crops. It must therefore be considered that utilization and total intake of bulb dominant crops such as fodderbeet may be reduced with restricted grazing, due to bulbs having to be removed from the soil prior to consumption. Thompson & Stevens (2012) observed a 4.8 KgDM/cow intake of swedes within 5 hours of allocation. Whilst cows offered fodderbeet have been shown to achieve a six hour DMI of 7.2 KgDM/cow (90%
utilization) (Jenkinson et al., 2014). Whilst indicative of high restricted intakes of winter
12
Matthews, (2003) reported lying times (6-7 hours/day) significantly lower than established optimum of >12 hours/days when cows were held in concrete yards and/or on gravel laneways. Decreased lying time results in increased energy expenditure and depression of anabolic metabolism induced by release of stress hormones. (Fisher, Verkerk, Morrow, & Matthews, 2002). As such, reduced winter BCS/LW gains have been reported under various standoff pad wintering systems (Fisher et al., 2003; Webster et al., 2007). It is therefore apparent that further research is required to quantify the effects of a restricted grazing, standoff pad system on forage crop DMI and BCS gain over winter.
2.8 Efficacy for Standoff Pads to Reduce Nitrate Leaching
The efficacy of a standoff pad system to mitigate N leaching will be reflective of the quantity of urine captured, and the associated reduction in paddock urine coverage. Restricting grazing from 24 to six hours daily, at a stocking density of 3000 cows/ha (over the daily crop area allocated), would reduce stocking intensity from >70,000 cow
hours/ha/yr, to <18,000 cow hours/ha/yr. The findings of Moir et al., (2010) suggest that
this would reduce paddock urine coverage by 35% (7% reduction per 10,000 cow h/ha/yr).
Based on established N leaching rates under fodderbeet in Canterbury (Malcolm et al.,
2016), a 35% reduction in urine patch coverage would result in an approximate decrease in N leaching of 11.9-18.9 Kg N/ha. As such, it has been suggested that reductions in N leaching of 30-65% have been can be achieved with standoff durations of 16-20 hours/day
(Christensen et al., 2011; Environment Waikato, 2008; Lindsay et al., 2011). It is therefore
apparent that standoff pad systems have potential to mitigate N losses to water. However, the extent of mitigation will be reflective of the quantity of urine captured. A strong understanding of dairy cow urination behaviour, and the temporal distribution of excretion is therefore required.
2.8.1 Urination Behavior
Previous research has outlined significant inter-cow variability in total daily urination volume (13-54.7 l/cow/day), average event volume (0.3-2.2 l/event), and event frequency (5-18 events/day) (Aland, Lidfors, & Ekesbo, 2002; Betteridge et al., 1986; Castle, Foot, &
Halley,1950; Fuller, 1928; Haynes & Williams, 1993; Misselbrook et al., 2016; Selbie et al.,
13
accumulating to daily per cow urine patch coverage of 0.68-3.3m2/cow/day (Aland et al.,
2002; Betteridge et al., 1986; Castle et al., 1950; Haynes & Williams, 1993; Misselbrook et
al., 2016; Selbie et al., 2015). Total urination volume, and thus daily urine patch coverage is ultimately reflective of the need to expel minerals and electrolytes from the body (Bannink, Valk, & Van Vuuren, 1999; 2012 Khelil-Arfa, Boudon, Maxin, & Faverdin, 2012). Subsequently, increases in DM, CP and N intake result in greater urine production. As such, it has been shown that non-lactating, fodderbeet fed cows produce comparatively lower volumes of urine (17.97 l/cow/day), when compared to kale (29.91 L/cow/day) or pasture
fed cows (upto 54.7 l/cow/day) (Betteridge, Costall, Luo, & Ganesh, 2013; Ravera et al.,
2015). This, along with the effect of soil micro-topography (pooling of urine in depressions left by removed bulbs) (Williams & Haynes, 1994) results in typically lower daily urine patch
coverage of fodderbeet wintered cows (2.04 m2/cow/day vs >3 m2/cow/day for pasture
fed cows) (Ravera et al., 2015). It is therefore apparent that fodderbeet fed cows will
produce typically low quantities of urine, resulting in low per cow urine patch coverage. The significant inter-cow variability observed requires further quantification. However, potential diurnal variation in urination behavior is an area of greater concern; The temporal distribution of urine excretion may influence the volume, and percentage of urine captured
during a standoff period. Shepherd et al., (2017) observed consistent peaks and minimums
in event volume at 4.30 AM and 9AM respectively, whilst time to next event was greatest at 2AM, and lowest and 10 AM. Several other authors have outlined similar temporal variation, typically concluding that event volumes peak at dawn, with a lower event
frequency overnight (Betteridge et al., 1986; Betteridge et al., 2013). The apparent
synchronization between periods of high event volume, and low event frequency suggest that the portion of total daily urine excreted within a given time, will be reflective of the
duration of said time period. Supporting this, Shepherd et al., (2017) suggested that an
18-hour standoff period would capture 75% of urine excreted. However, the temporal distribution of urine excretion has been linked to the well-established diurnal fluctuations
in grazing activity and DMI (Gregorini et al., 2009), and therefore, restricting grazing period
14 2.9 Conclusions and Research Objectives
The environmental impact of intensive dairy farming in Canterbury and New Zealand cannot be disputed. Nitrate leaching drives eutrophication and degradation of regional waterways; an issue that has come under considerable scrutiny in recent times. Subsequently, national policies have been released, mandating that regional councils manage land use to mitigate further environmental damage. In Canterbury, the country’s most intensive dairying province, the ‘Land & Water Regional Plan’ has been implemented, ultimately functioning to enforce N leaching limits. Farmers must therefore adapt their
systems to meet regulatory standards. The traditional in situ approach to wintering has
been identified as a key driver of whole farm/enterprise N leaching due to typically high stocking density’s. The “Pastoral 21” research programme has identified fodderbeet as the optimal wintering crop due to its inherently low N content. However, simply changing crop type does not address the impact of high stocking intensity’s, and as such it has been suggested that stand-off pad wintering systems can achieve further reductions in winter N leaching. The efficacy of such systems is dependent on several factors; 1. the ability of cows to maintain DMI and achieve acceptable BCS/LW gains under a restricted grazing period and 2. the quantity of urine captured on the standoff pad and the subsequent reduction in paddock urine coverage achieved. Limited research exists specifically quantifying these factors. This research project therefore aims to answer three key research questions to determine whether standoff pads represent a viable ‘Next Generation Wintering System’:
- Can non-lactating dairy cows achieve fodderbeet/silage intake rates > 10
kgDM/cow/day under a restricted grazing period?
- Can non-lactating dairy cows achieve acceptable BCS and LW gains under a stand
off wintering system?
- What percentage of total urine volume will be captured under a stand off pad
15
3
MATERIALS AND METHODS
3.1 Experimental Site and Design
The trial was conducted at the Lincoln University Ashley Dene Research and Development Station (43°39’ S, 172°21’ E.), Canterbury, New Zealand, between 26 June and 14 August 2017. All procedures were approved by Lincoln University Animal Ethics Committee (AEC 2017-10). The experimental site soil type was Lismore stony silt loam. Lismore stony silt loam has excessive drainage with water holding capacity (WHC) of 70- 100 mm/m of soil. It is a very light soil as stones are found at a depth of 450-750mm (McLenaghan & Webb, 2012). The site was divided into three areas: 1. Crop area, sown with fodder beet which was fed in situ 2. a stand-off area (0.56 ha) and 3. a feed pad area. All areas were connected by packed limestone laneways, with a maximum distance of 600 m between crop area and stand-off. The experimental design was a factorial design comparing two farm systems: 1. No stand-off facility (Control) 2. Stand-off pad (SOP) facility. Within the SOP treatment there were four stand-off pad surface treatments (stones, sand, carpet and woodchip-as described in section 3.1.2 giving a total of five groups. The control group grazed fodderbeet in situ for 23 hours per day, with one hour spent on a concrete feed pad for supplement feeding (0900h-1000h). The remaining 4 groups, in addition to spending one hour on the feed pad at the same time as the control group, spent 6 hours on fodder beet (1000h-1600h). One hundred and sixty crossbred in-calf dairy cows, were blocked into five groups (n= 32) based on calving date, body condition score (BCS) (4.15), liveweight (LW) (462 kg), breeding worth (95) and age (4.56 yrs), and randomly assigned to each group.
3.1.1 Grazing Area
16
3.1.2 Stand Off Pad and Feed Pad Area
The stand-off area was subdivided into five 0.112ha sections separated by dual wire electric fences. At construction, the stand-off pad area was lined with high density polyethylene (HDPE) liner. A BIDIM® nonwoven needle-punched continuous filament polyester geotextile A24 filter fabric was installed over and under the HDPE liner. Above this, sub bedding base material was laid down. This layer consisted 5cm of compacted, angular graded gravel, approximately 40mm in diameter. Each bedding material was then applied to a depth of 40cm. Below the subsurface layer, two 110mm NEXUSFLOTM subsoil polyethylene punched pipes were installed for drainage into the effluent holding pond. The four standoff pad surfaces used were 40mm woodchip, <0.2mm sand, 40-60mm, rounded Greywacke stones sourced from the ADRDS conversion, and CowMax geotextile carpet (designed for laneways), above a 100mm sand layer. Due to issues with drainage under one of the sections, only four standoff ‘sections’ were used in this trial.
3.2 Management
Each cow had access to a 10m2 lying area in line with industry recommendations
(DairyNZ, n.d). Electric fence reels were used to adjust each standoff area to the desired
320 m2. Each group was offered 4 kg DM/cow/day on a concrete feed pad (0900h-1000h),
of a silage mix containing grass and lucerne followed by 7 kg DM/cow/day of fodderbeet. Cows in the SOP groups were allowed access to fodderbeet for a restricted six hour period (1000h-1600h), and were held on the standoff area for 17 hour/day
(1600h-0900h). Control group cows grazed fodderbeet in situ for 23 hours/day (1000h-0900h).
Initially, groups were allocated to fodderbeet paddocks based on distance, with the furthest standoff pad cows grazing the closest paddock. At the initiation of the trial, cows were already transitioned to a daily fodderbeet intake of 6 kg DM/cow/day. From the
26th June- 2nd July, cows were transitioned onto the Standoff pads to reduce the risk of
17
collection of fodderbeet yield data and any variation in stock number. There was no back-fencing thus the paddock area offered increased throughout the trial. Any cows with health issues, such as lameness, were removed from the trial and treated. Treated cows may then be re-introduced into their treatment group when deemed appropriate.
3.2.1 Stand Off Pad Cleaning
At the beginning of the trial the maintenance requirements of each standoff pad material was unknown, thus and ‘as required’ approach was taken. The wood chip was rotary hoed every second week. The carpet was cleaned fortnightly by scraping the surface to remove dung. The stone and sand based stand-off areas were not cleaned, or subjected to any maintenance activities.
3.3 Measurements
3.3.1 Crop Yield and Dry Matter Utilization
Crop yield was measured fortnightly in all fodderbeet blocks. All plants were removed from three 2 meter x 2 row plots within the following two weeks’ allocation and DM yield was calculated accordingly. Utilisation was measured fortnightly using the dry matter disappearance technique. Yield cuts were used to determine the amount of fodderbeet offered. Two, 2-meter-long rows were randomly selected in the break area, and the same process as for yield testing occurred. Utilisation rate was expressed as pre-mass- post mass/pre-mass x 100. Supplement was weighed prior to allocation and residual supplement after the 1 hour allocation period were collected (by sweeping the feed pad) and weighed. The rate of utilisation was then calculated (100-(residual supplement/supplement offered)).
3.3.2 Liveweight and Body Condition Score
Liveweight and BCSwas recorded at the end of the standoff transition period (4/7/2017)
18
3.3.3 Urination Frequency and Volume
Urination activity was measured using modified urine sensors (PEETER sensors) to compare urine behaviour of cows on Control treatments with those on SOP. Cows from the Woodchip surface treatment were used in this part of the study as woodchip is the most commonly used surface material in commercial farming. Each urination event was measured as volume (L), with an associated time stamp to determine where urination occurred. Sensors were fitted onto a 30 cm long plastic sheath joint to a 3d printed, plastic mould. This was initially achieved using silicone glue and cable ties. A leather flap was installed around the mould to be glued over the cow’s vulva. Prior to application the rear/vulva area of the cow was scrubbed clean and wiped with ethanol. The urine harness was then attached to cows using non-toxic Loctite glue applied to the leather, and the underside of the vulva mould. A measurement period of 24 hours for each attachment was targeted. If sensors fell of cows they were collected and the reason for failure was noted. This allowed for continual development of the attachment process/design throughout the trial; Cable ties were replaced with steel hose clamps, and the 3D printing of the vulva moulds was adapted (change in gluing direction) to increase strength.
3.3.3.1 Characterisation and Calibration
The urine sensors operate on the principle of pressure differentiation. The bulk of differential pressure comes from the height of fluid acting on the pressure sensor inlet orifice. Primarily this pressure is equal to gravity, however fluids entering the collection chamber display varying velocity’s, reflective of volume, and subsequently force is applied to the pressure sensor. The sensors calculate outlet velocity as a proxy for event volume. Out let velocity when liquid is draining from a vessel is described by Bernoulli’s equation:
Equation 3-1PEETER Urine Sensor Calibration: Bernoulli’s Equation
V=Cv (2gH)1/2
19
V=outlet velocity (m/s)
Cv= velocity coefficient
G= acceleration of gravity
Volume flow is expressed as
V=CdA (2gH)1/2
Where:
V=Volume flow (m3/s)
Cd= discharge coefficient (where Cd=CcCv)
A= area aperture (m2)
G=acceleration of gravity (9.81 m/s2)
H=height (m)
A calibration apparatus that could stimulate variable flows was developed, to allow the above equations to be calibrated. This was done by passing five litres of fluid at four different velocities and recording the time for each volume to pass, which when plotted against volume, generated a flowtime relationship (Pascals). Post calibration, sensors displayed an accuracy of +/- 15% at volumes below 0.75 L, with improved accuracy of +/- 0.25% at volumes above 0.75 L. Precession was +/- 0.050 L.
3.4 Statistical Analysis
20
events, or that did not stay attached for 24 hours were not included in the statistical analysis. Only complete, correct data sets were used for calculating average volumes, and the distributions of urine volume.
3.5 Leaching Loss Calculations
Paddock scale nitrogen (N) leaching losses were calculated using average urination values,
comparing the standoff pad system outlined, and a traditional 24 hour in situ system:
Equation 3-2 Paddock Scale Leaching Losses.
NL= (NL1 x P1) + (NL2 x P2)
NL = annual average nitrate leaching losses from a grazed field.
NL1 = N leaching losses at the urine patch.
NL2 = N leaching losses at non-urine patch areas.
P1= Proportion of are covered by urine patches.
P2 = Proportion of area covered by non-urine patch areas.
Estimates of leaching losses were calculated using the average leaching losses (26.5% of urine N leached, 10.5Kg N/ha leached for non-urine patch areas) from lysimetric studies at
the ADRDS in Canterbury, New Zealand (Malcolm et al., 2016). N leaching losses for urine
patches were calculated by first determining the N load per urination, then multiplying this by the percentage of N load leached. The equation used to determine N load is as follows:
Equation 3-3 Urine Patch Nitrogen Loading.
21
The average urine patch area was calculated from the urine volumes recorded in this trial
using the regression equation (Area= 0.1092 x volume, R2= 0.89) developed by Ravera et
al., (2015). The urine N concentration used was 2.76 g/L, the average of the concentration
values reported by a range of authors for cows offered a comparative diet (Edwards et al.,
2014; Ravera et al., 2015; Farrel et al., 2016).
The proportion of area covered by urine patches was calculated as followed, assuming that no urine patch overlap occurred:
Equation 3-4 Paddock urine patch coverage
Urine Patch Coverage (%) = (Average number of urinations/24hrs x average area per urination x number of cows x number of days in paddock)/ total area grazed
Total Area Grazed = (Number of Cows x daily allocation (kg DM/cow)) / Crop yield)
22
4
RESULTS
4.1 Crop Yield
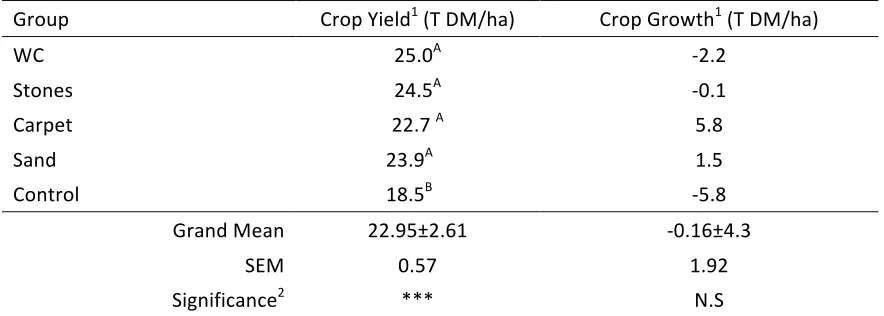
Average fodderbeet yield during the trial period was 22.95±2.61 t DM/ha. There was no difference in yield between SOP groups fodder beet blocks, but yield for the control groups
block was lower (P=0.00) (Table 4-1). Average herbage accumulation from the 7th July- 10th
August was -0.16±4.3 t DM/ha, ranging from -5.8- 5.8 T DM/ha.
Table 4-1 Average yield and growth over the trial period of each treatment groups allocated fodderbeet paddock.
Group Crop Yield1 (T DM/ha) Crop Growth1 (T DM/ha)
WC 25.0A -2.2
Stones 24.5A -0.1
Carpet 22.7 A 5.8
Sand 23.9A 1.5
Control 18.5B -5.8
Grand Mean 22.95±2.61 -0.16±4.3
SEM 0.57 1.92
Significance2 *** N.S
1. values with different supper scripts are significantly different 2. N.S= P>0.05, **= P<0.05, ***=P<0.01.
4.2 Crop and Supplement Utilization
23 Table 4-2Average utilization of fodderbeet and supplement of control and SOP cows.
Group Fodderbeet Utilization (%
of DM) Supplement Utilization (% of DM)
WC 96.3 93.4
Stones 94.1 91.8
Carpet 92.0 96.6
Sand 90.0 96.7
Control 98.6 96.2
Grand Mean 94.2±3.4 95±2.21
SEM 0.010 0.008
Significance1 N.S N.S
1. N.S= P>0.05, **= P<0.05, ***=P<0.01.
4.3 Body Condition Score and liveweight
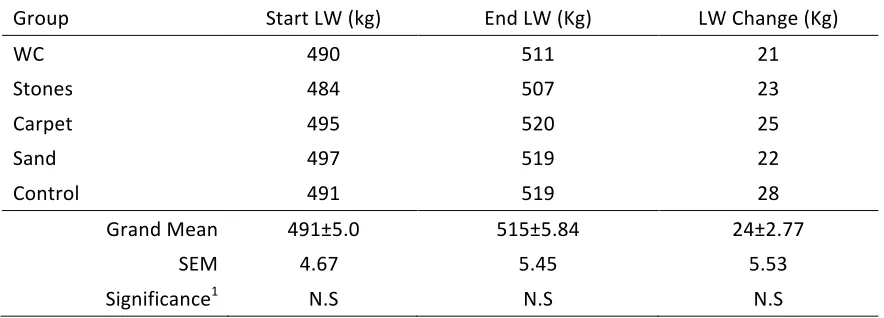
Over the course of the wintering period, all treatment groups increased average LW (P<0.05), with no difference in final LW observed (P>0.1) (Table 4-4). Average LW gain equated to 580 g/day, accumulating to 24 Kg LW/cow over the 41-day recording period. BCS was different between treatment groups at the start and end of the wintering period (P<0.05)
Table 4-3 Average start liveweight (4/7/2017), end liveweight (14/8/2017) and liveweight gain of control and SOP cows.
Group Start LW (kg) End LW (Kg) LW Change (Kg)
WC 490 511 21
Stones 484 507 23
Carpet 495 520 25
Sand 497 519 22
Control 491 519 28
Grand Mean 491±5.0 515±5.84 24±2.77 SEM 4.67 5.45 5.53
Significance1 N.S N.S N.S
24
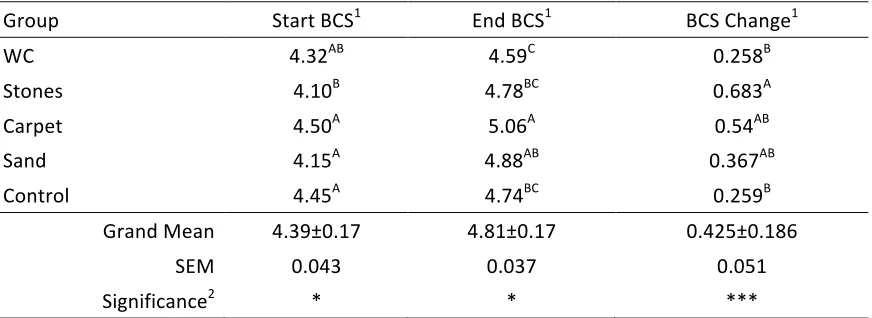
Average BCS gain was 0.425 units, however again, variability between groups was observed (P<0.01). The highest gain observed was within the stones group, whilst the WC and control cows displayed the lowest gains of just over 0.25 units. The carpet group was the only one to exceed an average end BCS of five, however all groups exceeded an end BCS of 4.5 (Table 4-4). There was no relationship between initial BCS and BCS gain (P>0.1). In line with the average LW gain recorded, each 0.1-unit increase in BCS was associated with a 5.64 Kg increase in LW.
Table 4-4 Average start BCS (4/7/2017), end BCS (14/8/2017) and BCS gain of control and SOP cows.
Group Start BCS1 End BCS1 BCS Change1
WC 4.32AB 4.59C 0.258B
Stones 4.10B 4.78BC 0.683A
Carpet 4.50A 5.06A 0.54AB
Sand 4.15A 4.88AB 0.367AB
Control 4.45A 4.74BC 0.259B
Grand Mean 4.39±0.17 4.81±0.17 0.425±0.186
SEM 0.043 0.037 0.051
Significance2 * * ***
1. values with different supper scripts are significantly different 2. N.S= P>0.05, **= P<0.05, ***=P<0.01.
4.4 Urine Sensor Performance
25 4.5 Urination Behavior
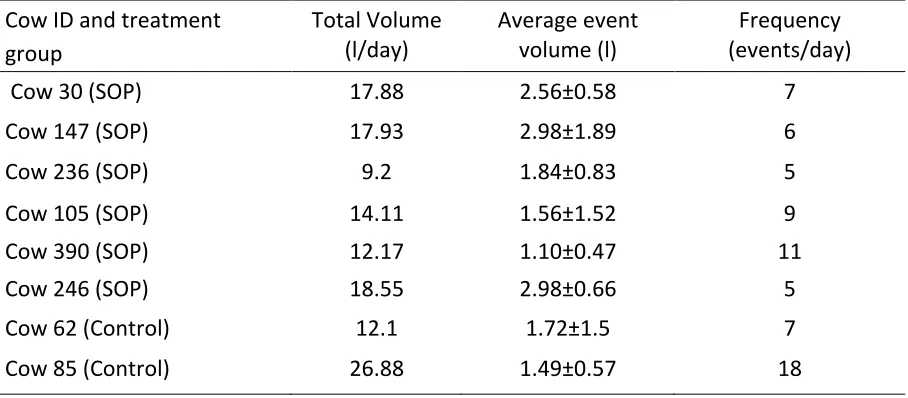
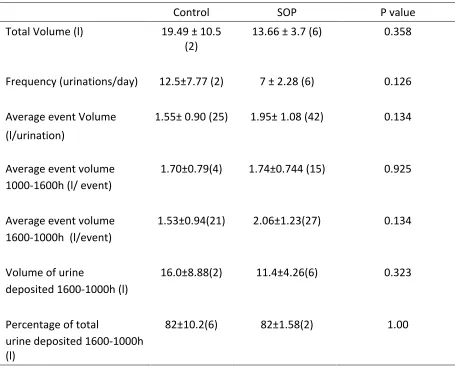
There was large inter-cow variability regarding total daily urine volume (9.2-26.8 l/cow/day) and frequency of events (7-18 urination events/day) (Table 4-5). However, due to large variance, no differences in average daily urination volume (15.12±5.5 L/cow/day) or frequency (8.37± 4.34 events/cow/day) was detected between control and SOP cows (P>0.1) (Table 4-6). Urine volume per event was also highly variable. The maximum value recorded was 5.29 litres, with 20.9% of events accounting for less than one litre. Average daily event volume was 1.81±1.03 L, and was not different between treatments (P>0.1). Event volume did not differ from 1000h-1600h, and 1600h-1000h between, or within treatment groups (P>0.1). The volume of urine excreted from 1600h-1000h was not different between treatment groups (P>0.05), and accounted for 82 % of total daily urine volume. With 95% confidence, it can be predicted that 65%-99% of total daily urine will be deposited during this period.
Table 4-5 Urination Behavior of eight non-lactating dairy cows wintered on fodderbeet.
Cow ID and treatment group
Total Volume
(l/day) Average event volume (l) (events/day) Frequency
Cow 30 (SOP) 17.88 2.56±0.58 7
Cow 147 (SOP) 17.93 2.98±1.89 6
Cow 236 (SOP) 9.2 1.84±0.83 5
Cow 105 (SOP) 14.11 1.56±1.52 9
Cow 390 (SOP) 12.17 1.10±0.47 11
Cow 246 (SOP) 18.55 2.98±0.66 5
Cow 62 (Control) 12.1 1.72±1.5 7
26 Table 4-6 Effect of wintering system on urination behavior. Numbers in parenthesis are
the number of observations.
Control SOP P value
Total Volume (l) 19.49 ± 10.5
(2) 13.66 ± 3.7 (6) 0.358
Frequency (urinations/day)
12.5±7.77 (2)
7 ± 2.28 (6) 0.126
Average event Volume 1.55± 0.90 (25) 1.95± 1.08 (42) 0.134
(l/urination)
Average event volume 1000-1600h (l/ event)
1.70±0.79(4)
1.74±0.744 (15) 0.925
Average event volume 1600-1000h (l/event)
1.53±0.94(21) 2.06±1.23(27) 0.134
Volume of urine
deposited 1600-1000h (l)
16.0±8.88(2) 11.4±4.26(6) 0.323
Percentage of total
urine deposited 1600-1000h (l)
82±10.2(6) 82±1.58(2) 1.00
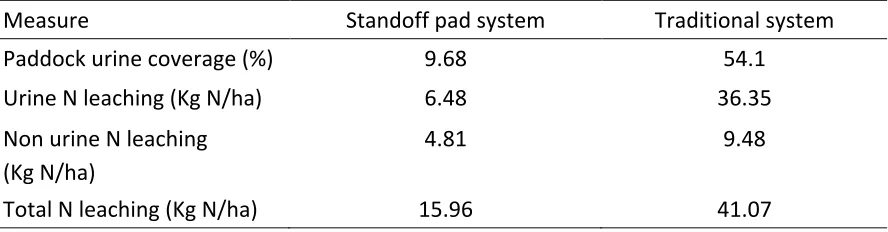
4.6 Calculated Urine Patch Coverage and Nitrogen Leaching
Paddock urine patch coverage and nitrogen leaching rate were calculated (using average urination behavior values across all cows) for a standoff pad (6 h/day in the paddock) and
‘traditional’ 24 hour in situ wintering system as per the method outlined in section 3.5.
Actual stocking density on the daily allocated area of fodderbeet was 3278 cows/ha, equating to an annual stocking intensity of 78, 688 cow hours/ha/yr. Under an 18-hour standoff system, stocking intensity was reduced to 19,672 cow hours/ha/yr. Average urine
patch area was 0.197 m2 covering a total area of 1.65 m2/cow/day. Calculated paddock
27 Table 4-7 Calculated paddock urine coverage and nitrogen leaching of two wintering
systems.
Measure Standoff pad system Traditional system
Paddock urine coverage (%) 9.68 54.1
Urine N leaching (Kg N/ha) 6.48 36.35
Non urine N leaching (Kg N/ha)
4.81 9.48
28
5
DISCUSSION
The aim of this discussion is to interpret the above results and determine whether the incorporation of a standoff pad structure can reduce paddock urine coverage and
subsequently N leaching of the traditional in situ wintering system, whilst maintaining
acceptable levels of key production parameters, namely cow DMI, and BCS/LW gain.
5.1 Crop Yield
The average fodderbeet yield of 22.95 t DM/ha was within the range of 11 to 27 t DM/ha outlined by Goh & Maget (1989). Previous crop yields reported at the same site (ADRDS)
range from 18.5-21.8 t DM/ha (Edwards et al. 2014; Jenkinson et al. 2014; Farrel et al.
2016). Chakwizira et al., (2012) reported a comparatively higher yield of 32.8 t DM/ha,
suggesting that greater production can be achieved. Total crop nitrogen application was
similar to that of Chakwizira et al., (2012) (116.2 Kg N/ha vs 100 Kg N/ha), and thus the
production shortfall observed could be attributed, at least in part, to soil type (Lismore stony loam vs Waimakariri sandy loam), and cultivar ‘(Rivage/Cersie’ vs ‘Collessie’) differences. Four fodderbeet blocks displayed comparative yields, ranging from 22.7-25 T DM/ha, however one was lower (P<0.05) at 18.5 t DM/ha. Several factors may have
contributed to this area of low performance; Edwards et al., (2014) suggested that low
yields could be attributed to poor seedling establishment (<8-10 plants/m2). This
presumption was supported by visual observation, as the low yielding block appeared to support a greater weed population. However, the effect of this was not quantified. It is therefore apparent that the observed crop yield is reflective of typical industry expectations.
5.2 Diet Utilization and Intake
29
hours/day (Kennedy, McEvoy, Murphy, & O’Donovan, 2009). Reflecting this, it has been observed that >70% of perennial ryegrass intake can be achieved within four hours of
allocation (Dobos et al., 2009), whilst Gregorini et al., (2009) showed that cows offered
pasture once a day consumed 10 kg DM/cow within three hours. Limited comparative data exist for fodderbeet, whereby bulbs must be removed from the soil prior to consumption. However, Thompson & Stevens (2012), reported a five-hour intake of 4.8 kg DM of swede, a similar bulb forming plant. Average FB utilization across the SOP treatments was 93.1%, or 6.52 KgDM. This is comparative to the 6-hour intake rate of 7.2 kgDM (90% utilization)
observed by Jenkinson et al. (2014) in parallel work. As expected, the control group
achieved the greatest utilization rate (98.6%), consistent with the unrestricted range of
96.25-99.6% previously reported (Edwards et al., 2014; Farrell et al., 2016). No significant
difference was detected between treatment groups. This, along with the relatively high utilization rates observed suggests that 6 hours was an adequate grazing period. Whilst there is some debate around the intake potential of cows grazing winter forage crops
(Greenwood et al. 2011), these results suggest that high DM utilization of low NDF in late
pregnancy is achievable. It must however, be considered that the daily crop allocation of 7 kg FB/cow/day is relatively low by industry standards (Judson & Edwards, 2008). An increase in allocation may therefore decrease overall utilization of restricted (SOP groups).
Jenkinson et al., (2014) illustrated this with differing kale allocations. At an allocation of 11
kg DM/cow/day, 6-hour utilization was 82%, whilst at an allocation of 14 kg DM/cow/day, utilization declined to 72%. In fodderbeet this effect may be greater, as bulb dominate forages typically display comparatively lower intake rates (Thompson & Stevens, 2012). Supplement utilization/intake, which was fed on a concrete feed pad prior to crop allocation, was unaffected by treatment, averaging 95% or 3.8 KgDM/cow/day. This is
comparatively higher than typical industry averages (Edwards et al., 2014; Jenkinson et al.,
2014) and can be attributed to use of a concrete feedpad. Lower utilization rates of
83%-86% and 65% have been reported for grass silage and oat silage when offered in situ
(Edwards et al., 2014, Jenkinson et al., 2014) which is associated with trampling of
supplement. The high FB utilization rates observed, and relatively high consumption of supplement resulted in an apparent average DM intake rate of 10.4 Kg DM/cow/day. Based
on the typical nutritive values (FB=12.2 MJME/KgDM; Edwards et al., 2014 Silage=11.1
30
estimated average daily ME intake of 122.57 MJME/cow/day. It is therefore apparent that high FB utilization rates can be achieved at an allocation of 7 KgDM/cow/day when grazing is restricted to 6 hours, whilst supplement intakes of 3.8 KgDM/cow/day can be achieved with an hour-long allocation on a feedpad. The above results suggest that unless high BCS gains, and subsequently high DMI’s (>10kg DM/cow/day) are targeted, restricting of grazing is unlikely to present issues in regard to crop utilization and DMI.
5.3 Live weight and body Condition Score
Body condition score gain on winter forage crops has been shown to range from 0.05-0.8
units (Keogh et al., 2009; Edwards et al., 2014). Dry matter allocation, and ME intake have
been outlined as primary drivers of BCS gain (Judson & Edwards, 2008). Reflecting this,
Rugoho et al., (2014) reported a significant reduction in BCS gain (0.2 vs 0.3 units), when
kale allocation was decreased by 3 Kg DM/day. Edwards et al., (2014) reported BCS gains
of 0.74-0.78 units when cows achieved a total daily ME intake of 155 MJME/cow/day from fodderbeet/silage. Dry matter allocation was comparatively higher (13.1 vs 10.39 KgDM/cow/day) than in this study, however the approximate ME intake of 122.57 KgDM/cow/day observed is above the suggested 119 MJME required to meet growing foetal energy demands and achieve a 0.5 unit gain in BCS over the wintering period. It is therefore apparent that at the observed level of intake, a BCS gain of 0.5 units is achievable (over a 60-day period).
The lower average BCS gain observed (0.425 units) can be attributed to the reduced wintering period (41 days vs 60 days). Apparent BCS gain displayed significant (P<0.05) variability between treatment groups, with only cows on the stones and carpet SOP achieving a BCS gain of 0.5 units. Cows on the woodchip SOP, and in the control group displayed the lowest gains of 0.258 and 0.259 respectively. Contrastingly, LW gain displayed negligible variation between groups, averaging 24 Kg, equating to a daily gain of 0.58 Kg. Assuming a net energy content of 19 MJNE/kg LW gain, and a conversion efficiency of 0.53 for non-lactating cows, the calculated daily ME requirement, including that of the growing foetus, was only 2.3 MJME/cow/day, higher than the average observed intake across treatment groups. This disparity is negligible, when compared to the 14-16
31
therefore be suggested that the LW gain observed is directly reflective of the diet offered,
across all treatment groups. Holmes et al., (2007) suggested the LW gain required to
achieve a one unit increase in BCS ranges from 17-45Kg with typical values of 15Kg and 30Kg suggested for jersey and Friesian cows respectively.
The disparity observed between actual LW gain, and apparent BCS gain can be attributed to several factors; It has been shown in cows of comparative liveweights, maternal adipose reserves, and subsequently BCS can vary by in excess of 40% (Andrews, Waldo, & Erdman, 1994), with only weak-moderate correlations (0.46-0.64) between LW and BCS reported (Berry, Macdonal, Penno, & Roche, 2006). Furthermore, it has been suggested that parity influences the LW/BCS interaction, with greater LW gains associated with comparative BCS
gain in multiparous cows (Berry et al., 2006). The differences in BCS observed may
therefore be due to inherent variability in cow frame, physiology and parity between and
within treatment groups (Andrew et al., 1994). Lack of consistency in the body condition
scoring process may also have contributed. Despite reported moderate-high classifier repeatability estimates, it has been suggested that the inherently subjective nature of BCS allows for substantial error (Bowden, 1982; Verkamp, Koenen, & De Jong, 2001). The lack of difference in LW gain between treatment groups suggests that there was no impact of the SOP treatment on production. It was postulated that decreased comfort of a given SOP surface may reduce lying time on the SOP, and as such cows might favor lying, rather than foraging in the paddock (Bryant, pers comm, 2017). This can be disregarded, as apparent DMI was unaffected by treatment (P>0.1). The effect of lying time, can however be two-fold; Reduced lying time increases energy expenditure and negates anabolic metabolism
via excess release of stress hormones (Fisher et al., 2002). Fisher et al., (2003) reported
lying times below 7 hours/day in cows held on various standoff surfaces, accompanied by
significant reductions in LW/BCS gain. Similar observations were made by Webster et al.,
32
5.4 Urination Behavior
The results from the present study confirm the large inter-cow variability in urination
behavior previously noted (Betteridge et al., 2013; Ravera et al., 2015; Shepherd et al.,
2017). Aland et al., (2002) reported an inter-cow range in urination frequency of 5-18
events/day, whilst typical averages in pastoral studies vary from 6.8-14 events/day (Castle et al., 1950; Fuller, 1928; Selbie et al., 2015). Farrel et al., (2014) observed a comparative average urination frequency (9.4 events/day) of cows wintered on
fodderbeet. It is therefore apparent that significant variability in individual cow urination frequency exists, however the urination frequency’s observed (8.73+/- range) supports
the conclusion of Ravera et al., (2015), that the typical dairy cow urinates 7-13 times per
day. Average event volume (1.8 l) and total daily volume (15.12 l/cow) were comparative
to the 2.31 l/event (17.97 l/cow/day) reported by Ravera et al., (2015) in fodderbeet fed
cows in Canterbury. Event volumes were typically within the extreme range of 0.3-7.8 l
previously outlined (Betteridge et al., 2013; Haynes & Williams, 1993). Total daily
urination volume (l/cow/day) was comparatively lower than the 27.2-54.7 l/cow/day
reported in pasture fed cows (Betteridge et al., 1986; Shepherd et al., 2017). Urinary
volume is ultimately reflective of the need to expel minerals and water from the body. Subsequently, total water intake and N ingested have been shown to be key drivers of
urination volume (Bannink et al., 1999; Khelil-Arfa et al., 2012). It was therefore expected
that the average urination volume observed in this trial would be lower than that
reported by Betteridge et al., (2013) and Shepherd et al., (2017), as fodderbeet is
inherently low in CP when compared to pasture (<2% vs 2-4%. de Klein et al., 2010;
Edwards et al., 2014). The cows in this trial were also non-lactating, and as such had a
lower daily water requirement (Bannink et al., 199). Farrell et al., (2016) observed higher
average daily urination volumes (27.5 l/cow/day, 3.48 l/event) of fodderbeet fed cows. Again, this can be attributed to increased dietary N, associated with a greater DMI (13.3 vs 10.39 KgDM/cow/day). Furthermore, the osmotic influence of high K and Na relative to
N in fodderbeet on urination will be increased at greater intakes (Bannink et al., 1999;
Farrel et al., 2016). Whilst it is apparent that significant inter-cow variability exists, no
difference (P>0.1) in any parameters of urination behavior was observed between SOP
33
SOP treatment on 7-hour event frequency (P=0.19), whilst Shepherd et al., (2017)
detected no difference in urination behavior, beyond an 8% increase in event frequency when cows were subjected to an 18 hour standoff period. It is therefore apparent that holding cows on a standoff pad for 18 hours/day does not influence urination behavior. As such, the SOP and control cows displayed the same temporal distribution of urine excretion, with 82% and 18% of total urine excreted from 1600-1000h, and 1000-1600h respectively. We can therefore predict with 95% confidence that 65%-99% of total urine will be captured under the proposed standoff pad system. This indicates, regardless of
diurnal variations in event volume and frequency (Betteridge et al. 2013; MisselBrook et
al. 2016), that on a total volume basis, the portion of urine excreted is reflective of time.
Shepherd et al., (2017) supported this conclusion, stating that 75% of urine would be
captured with an 18 hour standoff period. It is therefore apparent that significant reductions in the volume of urine deposited on soil can be achieved with a standoff pad system. Whilst conclusive, these results come from a small data set of 8 cows, with 67 total urination events recorded. Improvement of the urine harness system to improve durability, and an extended trial period would allow for collection of a larger, more robust data set to further validate the conclusions drawn from this trial
5.4.1 Paddock Urine Coverage and Nitrogen leaching
Paddock urine coverage, has been identified as a primary determinant of in situ nitrate
leaching (Moir et al., 2010). In rotational grazing systems, annual urine coverage ranges
from 10-29%, averaging 23% (Moir et al., 2010; Macklusky, 1960; Williams, 1998; White et
al., 2001; Whitehead, 2000; Vellinga et al., 2001). Paddock urine patch coverage was 54.1%
assuming a 24 hour in situ system. Under intensively stocked wintering systems, slightly
higher urine patch coverage rates of 58% and 61% of grazed area have been estimated
(Ravera et al. 2015). In this trial, calculated average urine patch area (0.197 m2) and total
per cow urine patch areas (1.65 m2/cow/day) were reflective of previous findings (Aland et
al., 2002; Betteridge et al., 1986; Castle et al., 1950; Haynes & Williams, 1993; Misselbrook