https://doi.org/10.5194/amt-12-5363-2019 © Author(s) 2019. This work is distributed under the Creative Commons Attribution 4.0 License.
Free-fall experiments of volcanic ash particles using a 2-D
video disdrometer
Sung-Ho Suh1, Masayuki Maki2, Masato Iguchi3, Dong-In Lee1, Akihiko Yamaji4, and Tatsuya Momotani4 1Department of Environmental Atmospheric Sciences, Pukyong National University, Nam-gu, Busan, Republic of Korea 2Research and Education Center for Natural Hazards, Kagoshima University, Korimoto, Kagoshima, Japan
3Sakurajima Volcano Research Center, Disaster Prevention Research Institute, Kyoto University, Sakurajima, Kagoshima, Japan
4Japan Weather Association, Higashi-Ikebukuro, Toshima, Tokyo, Japan Correspondence:Masayuki Maki ([email protected]) Received: 4 March 2019 – Discussion started: 15 April 2019
Revised: 11 August 2019 – Accepted: 19 August 2019 – Published: 9 October 2019
Abstract. Information of aerodynamic parameters of vol-canic ash particles, such as terminal velocity, axis ratio, and canting angle, are necessary for quantitative ash-fall estima-tions with weather radar. In this study, free-fall experiments of volcanic ash particles were accomplished using a two-dimensional video disdrometer under controlled conditions.
Samples containing a rotating symmetric axis were se-lected and divided into five types according to shape and ori-entation: oblate spheroid with horizontal rotating axis (OH), oblate spheroid with vertical axis (OV), prolate spheroid with horizontal rotating axis (PH), prolate spheroid with vertical rotating axis (PV), and sphere (Sp). The horizontally (OH and PH) and vertically (OV and PV) oriented particles were present in proportions of 76 % and 22 %, and oblate and pro-late spheroids were in proportions of 76 % and 24 %, respec-tively. The most common shape type was OH (57 %).
The terminal velocities of OH, OV, PH, PV, and Sp were obtained analyzing 2-D video disdrometer data. The terminal velocities of PV were highest compared to those of other par-ticle types. The lowest terminal velocities were found in OH particles. It is interesting that the terminal velocities for OH decreased rapidly in the range 0.5< D <1 mm, correspond-ing to the decrease in axis ratio (i.e., smaller the particle, the flatter the shape). The axis ratios of all particle types except Sp were found to be converged to 0.94 atD >2 mm.
The histogram of canting angles followed unimodal and bimodal distributions with respect to horizontally and verti-cally oriented particles, respectively. The mean values and the standard deviation of entire particle shape types were
close to 0 and 10◦, respectively, under calm atmospheric con-ditions.
1 Introduction
Terminal fall velocity (VT) of a particle is affected by its shape, density, size, and atmospheric properties. Wilson and Huang (1979), Dellino (2005), and Coltelli et al. (2008) in-troduced the influence of ash particle shapes on itsVT. Haider and Levenspile (1989) and Ganser (1993) analyzed VT of volcanic ash particles on the drag coefficient (CD), which is dependent on particle shape and atmospheric condition. Transport and sedimentation of volcanic ash are complex processes, and the residence time and fall velocity of ash is critically dependent on particle size (Bonadonna et al., 1998), where, with respect to the latter, smaller particles could be flowing in the atmosphere further from the vent.
Aerodynamic properties are important for safe aviation and for studying the effects of volcanic ash on climate change, since these parameters determine the residence time of ash particles in the atmosphere (e.g., Folch et al., 2009). The VT of particles varies widely due to their irregular shapes and material components (e.g., Wilson, 1972; Har-ris and Rose, 1983; Bonadonna et al., 2011; Maki et al., 2016). Bonadonna et al. (2011) analyzed VT of volcanic ash particles with various particle densities (ρs) from 990 to 2738 kg m−3, and Maki et al. (2016) summarized the list of variousVTrelationships suggested by previous studies. Vol-canic ash particles have a range of shapes, and this presents a major challenge when analyzing their characteristics. Re-cently, the irregularity of volcanic ash particles was analyzed in detail based on the features of various regular particles, such as cubes, cylinders, and disks (Bagheri and Bonadonna, 2016), using a computed tomography (CT) scanner (Dio-guardi et al., 2017; Garboczi and Bullard, 2017).
There are two approaches to studying these aerodynamic properties. The first approach is theoretical, where a numer-ical simulation model is used to calculate terminal veloci-ties, drag force, and Reynolds number (Re); examples of this approach can be found in Happel and Brenner (2012). The second approach is related to experimental research, in which the aforementioned relationships are determined ex-perimentally. For instance, Bagheri et al. (2013) and Bagheri and Bonadonna (2016) analyzed the aerodynamic features of irregularly shaped ash particles from the free-fall experi-ments. Dioguardi et al. (2018) suggested a new model of fluid drag for irregularly shaped particles using previous research. Since the aerodynamic feature depends on atmospheric con-dition and it can affect the retrieval of VT, it could be sug-gested that it can be analyzed through the free-fall laboratory experiments for the following main reasons: (1) there is little chance to measure natural falling ash particles, (2) it could be possible to control the size of ash particle in the free-fall experiments, (3) and it could reduce the wind effect in the experiments.
The present study applies the second approach (experi-mental research) to clarify the physical characteristics of vol-canic ash particles analyzing the experimental data. The rest of this paper is organized as follows. Section 2 describes the free-fall experiments of ash particles and methods of
analy-sis, Sect. 3 presents the results of the free-fall experiments, Sect. 4 is discussion, and Sect. 5 summarizes the results.
2 Data and methods
2.1 Two-dimensional (2-D) video disdrometer
The 2-D video disdrometer (2DVD) was developed by Joan-neum Research (Graz, Austria) to detect single raindrop par-ticles, and the instrument has been modified to cover the er-rors caused by turbulence effects (Nešpor et al., 2000). The device is able to observe the shape, VT, and β of a single particle using optical light. The ability to analyze a single particle is a significant advantage compared to other dis-drometers, such as the Joss–Waldvogel disdrometer (Joss and Waldvogel, 1967), the Precipitation Occurrence Sensor Sys-tem (Sheppard, 1990), and Parsivel (Löffler-Mang and Joss, 2000). For instance, Parsivel considers a fixed measurement area without any consideration of particle shape (e.g., Tokay et al., 2014), while 2DVD observes particles by passing them through a 100 cm2 observation area consisting of two light sources, i.e., reflecting mirrors and two cameras, with one camera set 6.2 mm above the other and collecting data with a resolution of 630 pixels; this results in a pixel size of 0.2 mm at 55 kHz (Kruger and Krajewski, 2002). Particles passing through the observation area yield shape information accord-ing to the radiation intensity of the light sources, which is helpful for calculation ofγandβ. TheVTof particles is cal-culated using the height difference between the two cameras. Based on these advantages, the oscillation and particle shape of raindrops can be analyzed by 2DVD (Thurai and Bringi, 2005). Böhm (1989) analyzed the aerodynamic properties of an irregular hydrometeor and Huang et al. (2010, 2015) used 2DVD to analyze the features of irregularly shaped snow. There have been few previous aerodynamic analyses of vol-canic ash particles performed using 2DVD, which is able to detect and analyze volcanic ash particles with a range of ir-regular shapes. Thus, 2DVD offers a unique approach as a new observation strategy.
2.2 Definition of particle shape type
Figure 1.Accumulated contoured images of volcanic ash particles, withDmeasured by a two-dimensional video disdrometer (2DVD).
various values ofVT andβ would likely be observed. The
γx of a particle is defined as the ratio of height to width for
the observation direction x, and its representative value is calculated using the geometric means of the twoγ (γ1,γ2) detected by cameras 1 and 2, respectively (Eq. 1):
γ1(2)=
Height1(2) Width1(2)
, γ=√γ1γ2. (1)
The difference in angle between the rotating symmetric axis and vertical axis is defined asβ. The counter-clockwise (clockwise) movement of the rotating symmetric axis has a positive (negative) value and the entire range is 180◦(from
−90 to 90◦) with 0◦as the center.
It is necessary to consider the true axis ratio (γT) to cor-rectly define the particle shape (Fig. 2). The apparent axis ratio (γA) considers the effect ofβ but theγTdoes not. The 2-D coordinates (x, z) of the particle shape withβare defined as follows:
xA=r cos(θ+β), zA=r sin(θ+β),
xT=rcosθ, zT=rsinθ,
where subscript A is the coordinate of the original data coor-dinate considering theβand subscript T is the modified data
Figure 2. Conceptual model of an (a) oblate and (b) prolate spheroid with the same canting angle (β).WA(T)andHA(T)are the
apparent (true) width and height of the particle, respectively.γA(T)
is the apparent (true) axis ratio.
An objective criterion for particle shape type was consid-ered since particle shapes can be highly diverse and irreg-ular (e.g., Bagheri and Bonadonna, 2016; Dioguardi et al., 2017, 2018; Garboczi and Bullard, 2017). In the case of ir-regular particles, theγ can change according to the observa-tion direcobserva-tion; however, any criterion should be able to define the particle shape types strictly and reliably. To solve this problem, particles with a rotating symmetric axis were the main target of the present study. Therefore, we considered oblate spheroid (O), prolate spheroid (P), and sphere (Sp), which all have a rotating symmetric axes. Among these par-ticle types, the major axes of the oblate and prolate spheroids could be horizontally (H) and vertically (V) oriented with respect to the ground, respectively. Thus, the various par-ticle shapes were divided into five types as follows; oblate spheroid with horizontal rotating axis (OH), oblate spheroid with vertical axis (OV), prolate spheroid with horizontal ro-tating axis (PH), prolate spheroid with vertical roro-tating axis (PV), and Sp.
To define these particle shape types, a strict definition of the γT is required, which can be calculated from theβ. As with theγ, the twoβ values are automatically calculated by 2DVD. In the case where theβ is assumed to be 0◦, the ro-tating symmetric axis for OH and PV can be defined, since it is observed for any observation direction parallel to the ground. However, in the case of OV and PH particles, the rotating symmetric axis cannot be defined when the observa-tion direcobserva-tion is parallel. In the case where theβ is not 0◦,
γT for all particle shape types would not change when os-cillation occurs in a direction orthogonal to the observation direction, but it is difficult to estimate both γT andβ when particle oscillation appears in a direction parallel to the ob-servation direction. The ability to restore theγT andβ rela-tive to this observation direction is limited, which is one of the main disadvantages of the 2-D observation strategy.
Based on these facts, a major β was selected based on the following reasoning: (i) a β for the observation direc-tion with lower (higher) γT for OH (PV) is selected. (ii) In the case of OV (PH), for which the rotating symmetric axis was observed for only one observation direction,β was con-sidered where the value of β had a higher (lower) γT than that of the other observation direction. Therefore, β with a lower (higher)γTin two observation directions for the case of an oblate (prolate) particle was considered a meaningful value. The perfect sphere could not have their value ofβ de-termined theoretically because there is the possibility of a rotating symmetric axis in any direction.
Based on the definition ofβ(Fig. 2), the perfect condition with respect to ellipsoids is satisfied when|β| =0◦(90◦) for OH and PV (OV and PH); these values are defined as the cen-ter values. However, 2DVD calculated that theβfor each par-ticle shape type was concentrated around|β| =0◦(90◦) with respect to horizontally (vertically) oriented particles, which correspond to OH and PH (OV and PV). Furthermore, analy-sis of particles with an orthogonal center angle from 0◦is
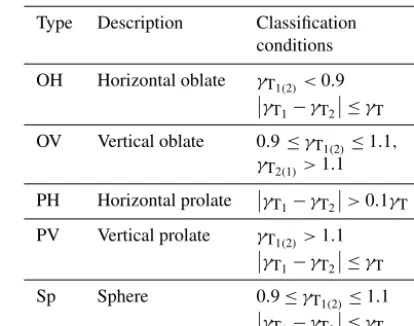
dif-Table 1.Ash particle classification criteria.
Type Description Classification conditions
OH Horizontal oblate γT1(2)<0.9
γT1−γT2 ≤γT
OV Vertical oblate 0.9≤γT1(2)≤1.1, γT2(1)>1.1
PH Horizontal prolate γT1−γT2
>0.1γT PV Vertical prolate γT1(2)>1.1
γT1−γT2 ≤γT
Sp Sphere 0.9≤γT1(2)≤1.1
γT1−γT2
≤γT
ficult, since they have two center angles (±90◦). To address observation errors and enhance the convenience of analysis, all center angles were set to|β| =0◦and modified to give the representative canting angle,βR, using the following equa-tion:
βR=β−β0,
whereβ0is the orienting angle, defined by the central angle of oscillation. In the case of vertically oriented particles (OV and PV),β0could be defined as±90◦. The sign ofβ0follows that ofβ.
After removingβ, each particle shape was defined using
γT (Table 1). Note that a 10 % bias range was allowed, to take observational error into account. For example, a particle was considered a sphere when 0.9< γT<1.1, which is an applied 10 % bias range fromγT=1. In addition, the parti-cle types OH and PV (OV and PH) were classified when the value of|γ1–γ2|was smaller (larger) than 0.1γT, to consider particles with only a rotating symmetric axis.
2.3 Calculate the terminal velocity for the various particle shape types
The VT of volcanic ash is required to estimate the RA (kg m−2s−1) on the ground where this depends on atmo-spheric density (ρg in g cm−3), T, Re,CD,D,ρs, and its shape. Kunii and Levenspiel (1969) developed a theoretical
VTequation:
VT=
4 ρs−ρggD
3ρgCD
!0.5
considering nonspherical particles were subsequently devel-oped. Tran-Cong et al. (2004) developed a new equation for
CD using the function of circularity, and Hölzer and Som-merfeld (2008) introduced a progressedCDequation consid-ering two types of sphericity: lengthwise (8||) and crosswise (8⊥). This equation is as follows:
CD= 8
Re
1
√
8||
+ 16
Re
1
√
8
+√3
Re
1
83/4
+0.42×100.41(−log(8))0.2 1
8⊥
. (3)
TheReis defined as follows:
Re=ρgVTD
µ , (4)
where µ is the dynamic viscosity (kg m−1s−1), which we assumed to be 1.983×10⁻⁵based on atmospheric conditions at a T of 25◦C. Three types of sphericity were defined as follows:
8=π D
2
SA , (5)
where SA is the surface area of the particle (mm2). The lengthwise sphericity is defined as the ratio between the cross-sectional area of the volume-equivalent sphere and the difference between half the surface area and the mean of the projected vertical cross-sectional area (AV) of the particle (Eq. 6):
8||=
π D2
4(0.5×SA−AV)
. (6)
The crosswise sphericity is the same as the lengthwise sphericity, except for the denominator, which includes the projected horizontal cross-sectional area of the particle (AH), defined as follows:
8⊥= π D2
4AH
. (7)
It is noteworthy that theVTis required to calculate theRe andVT, which refers to the final product. To solve this prob-lem, the theoreticalVT(Eq. 2) was used as the input value of Eq. (4) until Eq. (2) converged.
2.4 Sakurajima
Japan has around 10 % (110) of all of the active volcanos in the world. Sakurajima (1117 m.a.s.l, 31.58◦N, 130.65◦E, Kyushu, Japan) is an active volcanic island formed around 13 000 yr ago, and its tephra is approximately 60 %–66 %
SiO2 Peléan type (Oguchi et al., 2009; Takahashi et al., 2013). The major eruptive events in the historic age of Saku-rajima were 1471–1476 (Bunmei era), 1779–1782 (An’ei
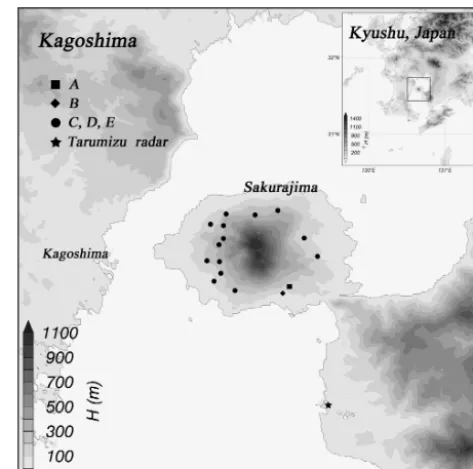
Figure 3.The locations of tephrometers and Showa crater on Saku-rajima, Japan. Black symbols indicate the locations of tephrometers, and the star, square, and circle symbols correspond to data sets A, B and C–E, respectively. The white circle symbol represents the lo-cation of Showa crater.
era), and 1914 (Taish¯o era). Sakurajima is an andesitic vol-cano with two peaks (Kita-dake and Minami-dake). Vol-canic activity at Kita-dake ended around 4900 yr ago when it changed to Minami-dake. Activity has centered on Showa crater from 2006 (Iguchi, 2013). Showa crater is located on the eastern flank, approximately 500 m east of Minami-dake (southern peak) on Sakurajima. It was appeared in 1939 af-ter 1 month of eruptions (Yokoo and Ishihara, 2007). The Minami-dake summit crater was the only active center of Sakurajima until the recommencement of Showa crater from 1948 to 2006. The eruptive activity of Showa crater resumed in June 2006, and vulcanian eruptions gradually increased in the autumn of 2009 (Hotta et al., 2016). The Japan Meteoro-logical Agency (JMA) reported that the eruption frequency of Sakurajima would increase significantly from 2009, and the accumulated ash fall exceeded 3.5 kg m−2in Kagoshima in 2012. The Ministry of Land, Infrastructure, Transport, and Tourism (MLITT) installed an operational X-band radar 10.7 km from the vent, as well as 16 automatic volcanic ash weight measurements, to observe volcanic eruptions in 2011 (Fig. 3).
2.5 Free-fall experiments
Table 2.Information on the collected volcanic ash particles.
Data Collection date Period of free fall Condition of free fall experiment (18 June 2014)
A 1–31 December 2008 10:00–12:34 (154 min) Size by size (phi scale) B 1–31 March 2010 13:43–14:53 (70 min) Size by size (phi scale) C 28 February 2014 15:11–16:17 (66 min) Mixed
D 31 March 2014 16:19–17:05 (46 min) Mixed E 30 April 2014 17:07–18:00 (53 min) Mixed
Figure 4.Real images of volcanic ash particles used in the present study. The particles were classified as(a)0.125 mmD≤0.25 mm, (b) 0.25 mm D≤1 mm, (c) 1 mm D <2 mm, and (d) 2< D≤
4 mm.
(8= −log2D) from8=3 to−4 (0.125< D <16 mm) and the other was not considered on a particle-size scale. The for-mer data, expressed by A and B (Type 1), were collected at two sites and screened by size (Fig. 4); the latter data, expressed as C–E (Type 2), were collected at 18 sites (Ta-ble 2). Free-fall experiments on collected volcanic ash parti-cles were carried out in the large-scale rainfall simulator of the National Research Institute for Earth Science and Disas-ter Prevention (NIED) in Tsukuba, Japan. The collected par-ticles were dropped manually around 17 m from the ground and re-collected by a third-generation 2DVD (Maki et al., 2016). Each sample was dropped for 30 s to stimulate disper-sion, and the measurement period was 1 min. To avoid wind effects including turbulence, the 2DVD was surrounded by a 3 m3wind-breaking wall (Fig. 5).
The free-fall experiments were conducted at intervals of 1 min over 6.5 h, as shown in Fig. 6. The number of particles detected by 2DVD was less than 10 000 for 1 min, and the particle size range of the Type 1 data set was proportional to its phi scale, since small particles may be contained by screening.
Figure 5.Free-fall experiment conditions of volcanic ash particles on the(a)outside and(b)inside of the wind-breaking wall cover-ing the disdrometers in the large-scale rainfall simulator of the Na-tional Research Institute for Earth Science and Disaster Prevention (NIED).
Figure 7 shows the distribution of raw data (the number of data: 274 215) forVTandγ withD. There were various
Figure 6.The 1 min interval time series ofDand the number of particles in the free-fall experiment conducted at the NIED.
ρs alone. Therefore, the minimumρs was considered to be 2.43 g cm−3, and this was used as an input parameter. The atmospheric conditions of T and P were considered from an automatic weather station (AWS), supported by the JMA. The falling height of a particle, which followed the afore-mentioned conditions (γ=0.935, ρs=2.43 g cm−3) when
D=4 was lower than that under the condition of the free-fall experiment (17 m) and it reached 90 % ofVT(13.9 m); there-fore, the available data range is considered to beD≤4 mm, and this would satisfy the terminal fall velocity. The detailed equations used in the present study are shown in Appendix A. 2.6 Quality control procedures
The 2DVD was originally developed to detect raindrop hy-drometeors. For this reason, additional quality control (QC) checks were deemed necessary to ensure applicability to non-hydrometeors, such as volcanic ash particles. Specifically, we performed the following three QC procedures for accurate analysis of the data.
i. ParticleD >0.25 mm was selected in consideration of the minimum spatial resolution of 2DVD.
ii. If the major axis observed by 2DVD was 10 % longer than that of the value calculated directly based on data coordinates, the data were considered erroneous and thus removed. A 10 % bias range was considered due to mathematical error, the irregular particle shape, and the limitation of the spatiotemporal resolution of 2DVD. iii. To consider volcanic ash particles, the sample that
sat-isfied the criteria in the chosen range of the terminal ve-locity relationship was selected. If we consider a single
VTQC measurements for the entire particle shape type, a number of available data will be removed, since VT critically depends on particle shape. Therefore, we ap-plied a 60 %VTQC threshold (Jaffrain et al., 2011) for
Figure 7.Contour image of volcanic ash particles for(a)the axis ratio (γ) and(b)terminal velocity (VT). The solid red line is the averagedγ satisfying the condition that the correlation coefficient exceeds 0.95. The solid grey line is the relationship of volcanic ash particles suggested by Bonadonna et al. (2011).
each particle shape type. It could be applied once theVT relationship of volcanic ash particles is obtained. After selecting the particle shape types and applying these two QC procedures (i and ii), 19.31 % of the data (62 953) remained (Table 1).
3 Results
3.1 Ash particle shape
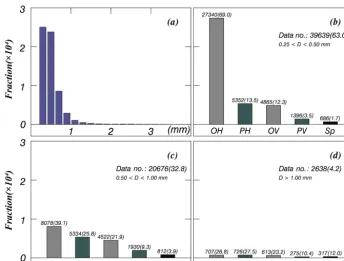
The ash particle size over the entire volcanic ash sample was skewed leftward, and the dominant particle shape type changed with particle size (Fig. 8). The particles were pre-dominantly horizontally oriented (75.51 %) and vertically oriented (21.60 %). Oblate and prolate spheroids made up 76.26 % and 23.85 % of the particles, respectively. Hence, the particles were mainly OH (57.38 %) or PH (15.88 %) (Table 2). The particles were predominantly 0.25< D <
0.5 mm (63.00 %) or 0.5< D <1 mm (32.80 %). Relatively few particles hadD >1 mm (4.20 %).
Figure 8.Histograms of volcanic ash particles for(a)all particle types and(b–d)each particle shape type of the phi scale. The grey-shaded and dark-grey-shaded (patterned) bars indicate horizontal oblate (OH) (vertical oblate, OV) and horizontal prolate (PH) (vertical prolate, PV), respectively. The black bar corresponds to spherical (Sp) particles. The number on the top of each bar plot is the number of data points, and the number in parentheses is the percentage for each phi scale.
at 0.5< D <1.0 mm, except for OH. In total, 95.80 % of OH particles hadD <1 mm, atD <0.5 mm the value was 75.68 %, and atD=0.5–1 mm it was 22.36 %. In the cases of PH and OV, 93.63 % and 93.87 % of these particles, re-spectively, had D <1 mm. Beyond D >1 mm, the differ-ences in the number of particles for each particle shape type were considerably decreased.
3.2 Terminal velocity
TheVTfor the entire particle shape types follows a polyno-mial regression analysis that was applied to define the nonlin-ear relationship betweenVTandD(Fig. 9a). It corresponds to that obtained by Miwa et al. (2015), who analyzed Par-sivel data using the same laboratory experiments. The inflec-tion point ofVTwas atD <1.3 mm and it came from an in-crease in the number of OH and a dein-crease in theirVTwhen
D <1 mm. As a result, theVTrelationship for each particle shape type can be seen clearly.
The observed values of VTwere well classified by parti-cle shapes (Fig. 9b). The highest values ofVTwere recorded in the following order: prolate, sphere, and oblate. Verti-cally oriented particles had higher VT values than horizon-tal ones. The VT for every particle type can be expressed in a power law form, except for OH. OH particles followed the regression line relatively closely and showed the highest CC and root-mean-square error (RMSE) values of 0.94 and
0.46 m s−1, respectively. Horizontally oriented particles had relatively high correlations (OH: 0.94; PH: 0.87) compared to those with a vertical orientation (OV: 0.75; PV: 0.71). The
VTrelationships and those of statistical parameters are sum-marized in Table 3.
To verify the reliability of the particle data obtained by 2DVD, which was originally developed to detect liquid rain-drops,ρs,CD, andRe, as well as theoreticalVT values ac-cording to these parameters, were analyzed. To calculate the parameters of interest, including the surface area and cross-sectional area of irregular particles, we applied the irregular particle volume estimation equations of Huang et al. (2010).
3.3 Aerodynamic properties
Particle densities were estimated using theVT,Ref, converged
Table 3.Relationships of terminal velocity, with the number of data points, the value of the correlation coefficient (CC), and the root-mean-square error (RMSE), after applying the 60 %VTQC threshold for each particle shape type.
Type Data number (%) Relationship (0.25< D(mm)≤4) CC RMSE
All 32 685 (100) VT(D)=0.15D3−1.51D2+6.69D 0.56 1.22
OH 10 757 (33) VT(D)=0.14 exp(2.40D)(0.25≤D < 1.6)
VT(D)=4.77D0.67(1.6≤D <4)
0.94 0.46
VT(D)=5.96D0.53 0.75 0.85
PH 8619 (26) VT(D)=5.09D0.65 0.87 0.74
PV 3170 (10) VT(D)=6.47D0.49 0.71 0.96
Sp 1444 (4) VT(D)=5.61D0.56 0.91 0.78
Figure 9.Distribution of(a)quartile and(b)median terminal ve-locity (VT) values after applying the 60 %VTQC threshold for all shape types and each individual particle shape type, respectively. The solid grey line shows the relationships of the volcanic ash par-ticles suggested by Bonadonna et al. (2011).
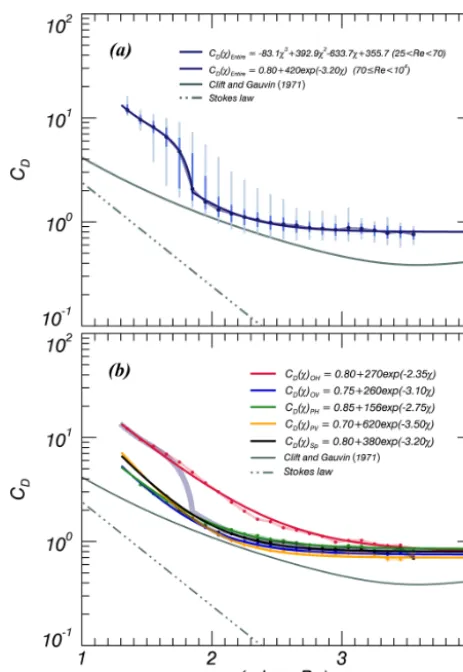
Figure 11.Same as Fig. 9 but for Reynolds number (Re) and drag coefficient (CD). The solid grey and broken grey lines in(a)are the relationships of spheres suggested by Clift and Gauvin (1971) and Stokes (1851), respectively.
shapes converged whenD <2 mm, and the convergedρs val-ues ranged from 2.35 to 2.50 g cm−3.
TheReandCDfor the all particle shapes ranged from 10 to 4000 and 0.6 to 20, respectively (Fig. 11a). Higher val-ues ofCDwere observed when log(Re) <1.845 (Re <70); above this threshold,CD dramatically decreased. These re-sults were derived according to the number of OH particles, which mainly hadD <0.5 mm and had higherCDand lower
Re. Particle shape was divided into two types: OH and others (Fig. 11b). OH particles had higherCDcompared to the other particle shapes, which in turn showed few differences among themselves. The OH particles experience strong drag forces under the same flow conditions, leading to lower VT. The differences between OH and other particles diminished with
Re <1000. The other particle shapes had relatively higher
CD in the range 10< Re <3000. Rong et al. (2015) ana-lyzed the relationship betweenReandCDfor oblate and pro-late particles and showed that OH particles had higher CD compared to the reference line (Clift and Gauven, 1971) in
Figure 12.Same as Fig. 9 but forγ.
the range 0< Re <400. Each relationship is summarized in Fig. 11.
3.4 Axis ratio
Theγ of a particle affects the backscattering power of elec-tromagnetic waves and is necessary to calculate the horizon-tal reflectivity (Z in dBZ), differential reflectivity (ZDR in dB), and specific differential phase shift (KDPin◦ km−1). Note that previous studies have analyzed theγ distribution for raindrops and snow, including hail; however, few studies have been reported onγ of ash particles compared to those for hydrometeors.
Figure 12 shows the quartiles and median values ofγ for all particle shapes and for each individual particle shape type. Theγ had a higher standard deviation (σγ) of>0.25 when D <0.75 mm, which decreased and converged toσγ =0.15
whenD >1 mm (Fig. 12a). Theγin the lowerσγrange
con-verged toγ=0.94 and could be expressed as follows:
γ (D)=0.94−0.25 exp(−1.90D). (8) The particles are more easily classified by shape than by
Figure 13.Histograms of representative canting angle (βR) for each particle shape type, including the data for all particles.
D, except for OH. Theγ of each particle type is expressed via the following relationships (Eqs. 9–12).
γ (D)OH=0.37tanh(1.84D−1.88)+0.38 (9)
γOV=1.15 (10)
γPH=0.88 (11)
γPV=1.24 (12)
The parameter γ (D)OH was calculated using the hyper-bolic tangent (tanh) for the following reasons: (i) its range of values was wider than those of other particle types, (ii) its data distribution changed continuously with D, and (iii) it was present in a higher proportion (30.44 %) compared to the other parameters. We found that variations in γ decreased with D and the proportion of Sp shapes increased when
D >2 mm. The particle types OV and PH showed a wide dis-tribution over 1< γ <1.5 and 0.4< γ <1.0, respectively, when D <2 mm, but the variability in median values was relatively low. The relationships ofγ for each particle shape type could be expressed by constant values atγ=0.75 (OH), 0.88 (PH), 1.15 (OV), and 1.24 (PV), respectively, and these differences are aroundγ =0.12.
3.5 Canting angle
Statistical analysis of β is required to understand the aero-dynamic properties of volcanic ash particles and the input
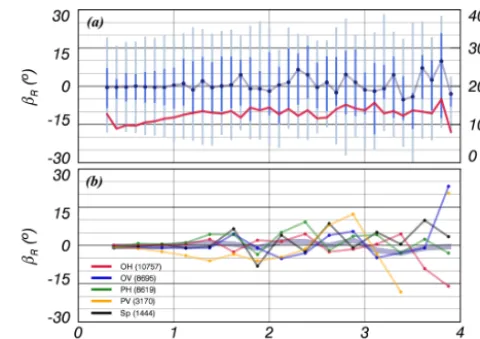
Figure 14.Distribution ofβRwithDfor each particle shape type including the data for all particles. The solid red line indicates the standard deviation.
parameters of T-matrix scattering simulations to verify the observed radar variables. The histogram ofβRis shown in Fig. 13.
More than 95 % ofβ values for each particle shape type were concentrated in the range |βR| ≤30◦, with 0◦ as the center (Fig. 13). The particles were symmetrically distributed around 0◦and more than 50 % were concentrated in the range
|βR|<4◦. The horizontally orientedβ distribution was rel-atively narrow(|βR|<20◦)and exhibited a unimodal distri-bution. It is noteworthy that 90 % of OH particles were con-centrated in the range|βR|<4◦. The vertically oriented β distribution was relatively broad(|βR|<30◦)and followed a bimodal distribution. PV exhibited a bimodal form, but this was not symmetrical around 0◦. For spheres, theβ distribu-tion was narrower, similar to horizontally oriented particles, and it had a bimodal distribution, similar to vertically ori-ented particles, indicating that the independent features of both orientations were combined.
The values of|βR|and|σβ|for OH and PV (OV, PH) were
0 and 3.5◦ (0.4, 13.1◦) and 1.3 and 12.7◦ (0.2, 10.9◦), re-spectively. OV (OH) had the highest (lowest) value of|σβ|.
This validates the assumption of Marzano et al. (2012) un-der stable conditions(|σβ| =10◦). Therefore, we believe that the tumbling phenomenon(|σβ|>30◦)of the particles under calm atmospheric conditions was likely to be minor.
To analyze the correlation between particleDandβ, quar-tiles for each particleD interval were calculated (Fig. 14). The particles were concentrated at|βR|<30◦ regardless of
D, and median values were stable whenD <1 mm for the entire particle shape types; however, fluctuation increased withD(Fig. 14a). The|σβ|values gradually increased from
10 to 13◦when 0.3< D <1.3 mm, and variability was great-est around the center (13◦). This increase in|σβ|would not be
(Fig. 8a), since their standard deviation is largely maintained at about 13◦regardless of data set size.
Variability in the median values for individual particles was more apparent. The values converged around 0◦but fluc-tuation increased with greaterDfrom the zero line. The me-dian|βR|values exceeded 3, 5, 10, and 15◦whenD >1 mm, 1< D <2 mm, 2< D <3 mm, andD >3 mm, respectively (Fig. 14b).
4 Discussions
The results of present study can be extended in viewpoint of the radar meteorology: (i) the radar observation and (ii) ash-fall rate (RA) estimations. Weather radar operates for a simi-lar purpose to that of meteorological satellites, and provides information for determining the volume, mass, and echo top height of weather systems. Short-duration eruptions, i.e., less than 1 h, can be detected at high spatiotemporal resolution, especially in the early period of an eruption. The tempo-ral resolution of weather radar is a few minutes for a sin-gle volume scan and depends on the observation strategy and radar band. The spatial resolution of weather radar is a few hundred meters and is proportional to the radar frequency. A number of ash cloud detections were reported in several observational cases in the US and Japan (Maki and Doviak, 2001; Maki et al., 2012). Marzano et al. (2013) summarized 28 major explosive volcanic eruptions detected by weather radars from 1970 to 2011. Harris and Rose (1983) attempted to analyze volcanic ash particle size and total mass using a C-band weather radar. Maki and Doviak (2001) proposed the method to retrieve particle size distribution (PSD) from radar measurements of volcanic ash, and Donnadieu et al. (2012) detected volcanic eruptions using an L-band fixed radar. Marzano et al. (2006, 2012) and Maki et al. (2012, 2014) de-tected and analyzed volcanic eruptions using weather radars from theoretical (physical) and experimental (engineering) perspectives, respectively. Thus, observability of volcanic ash clouds using weather radar can be confirmed from pre-vious researches. To verify radar-based volcanic ash cloud observations, a scattering simulation can be considered. The basic parameters, axis ratio and canting angle, are the results presented in this study and the input information of scattering simulations used to simulate the theoretical radar variables. In particular, the T-matrix scattering simulation developed by Waterman (1971) is useful for calculation of the theoretical backscattering power of nonspherical particles.
Second, VT is one of the main parameters for RA (kg m−2h−1) and is defined in terms of PSD andVTas fol-lows:
RA=Vr
3.6 103
D2
Z
D1
VT(D) N (D) D3dD, (13)
whereVr is the particle volume ratio. In case of sphere, it is consideredπ/6.
Marzano et al. (2012b) proposedZ–CA relationships us-ing the ash-fall concentration (CAin g m−3) andz. Maki et al. (2016) introducedRA–zrelationship for Sakurajima erup-tion case (18 August 2013) using the time integraerup-tion ofRA (SA in kg m−2) obtained by automatic volcanic ash weight measurements. However, once we use a disdrometer, such as 2DVD, it will be possible to estimateRA directly since 2DVD can measure PSD, VT, and γ. Therefore, basic pa-rameters could help to simulate radar variables and estimate
RA, which are necessary to develop the quantitative ash-fall estimation (QAE) method.
5 Summary and conclusions
The basic parameters (VT,γ, andβ) of volcanic ash particles were analyzed from the free-fall experiments with 2DVD. Data were collected with 18 automatic volcanic ash weight measurements performed on Sakurajima, Japan (31.58◦N, 130.65◦E). To identify the aerodynamic properties of the volcanic ash particles in the samples, a free-fall experiment was conducted in the large-scale rainfall simulator of the NIED, and 274 215 samples were analyzed.
Radar variables are highly dependent on the |K|2, size, and shape of particles. Particle types with rotating symmetric axes were assumed to represent volcanic ash particles that have a wide variety of irregular shapes. Their orientation was also considered with respect to horizontally (OH, PH) and vertically (OV, PV) oriented oblate and prolate spheroids.
The dominant particle shapes were comprised of horizon-tally and vertical oriented particles and present in propor-tions of 75.51 % and 21.60 %, respectively. Regarding par-ticle shape, oblate (prolate) spheroids comprised 76.26 % (23.85 %) of all particles in the samples. The most common particle shape type was OH, accounting for 59 % of all parti-cles whenD <1 mm and 69 % whenD <0.5 mm. Overall, 95.80 %, 93.87 %, and 93.63 % of the OH, OV, and PH parti-cles hadD <1 mm, respectively.
TheVTof the particles were classified in the following or-der: PV, OV, Sp, PH, and OH. These results are consistent with the VT ,Ref, which suggests that 2DVD is reliable for observing volcanic ash particles under stable weather con-ditions. A noticeable increase in VT for OH in the range 0.5< D <1 mm occurred through an increase inγ; this was not observed for other particle types.
which was highest whenD <0.5 mm; at this threshold,CD was higher andRewas lower. The range ofVT over 0.7<
D <1.3 mm was informed by bothγ andρs.
The σγ decreased in the range of D >0.75 mm to 0.15
and converged toγ=0.94. Maki et al. (2014) introduced the radar variables and found thatZDRgradually increased with time; the dominant values at 10 and 18 min after the eruption were close to 1 and 2 dB, respectively. The results presented in this study corresponded to volcanic eruption clouds with positiveZDRsince it is a function of|K|2andγ (Herzegh and Jameson, 1992). In addition, it can be explained by us-ing the results of present study, that the size sortus-ing of ash particle (e.g., Beckett et al., 2015; Stevenson et al., 2015) will affect the increase inZDR.
The |σβ| of OV particles with |β0| =90◦ was largest (13.1◦) among all particle types and OH particles had the lowest|σβ| at 3.5◦. Based on the |σβ|results, the tumbling phenomenon would not be dominant under calm atmospheric conditions. The quartiles were stable whenD <1 mm for the entire particle shape types but increased with D. The value ofσβ was higher whenD <1.3 mm and started to converge
around 13◦due to a decrease in the number of OH particles. These results could be the essential information to de-velop the new approaches for detecting non-hydrometeors and numerical model. The axis ratio and canting angle of ash particles obtained from the present study are necessary for scattering simulations.VT obtained by the present study suggests that smaller particles can be transported over longer distances. Therefore, it will be useful for scattering simula-tion of ash particles to develop QAE and help to improve the numerical model usingVTobtained by the present study.
Appendix A: Appendix A
The theoretical fall velocity and falling distance with time are calculated as follows:
F =ma=Fg−FD, (A1)
Fg=mg, (A2)
FD= 1 2ρgV
2C
DA, (A3)
where Fg is universal gravitation, FD is drag force, m is mass, and a is the free-fall acceleration. In Eq. (A2), g is the acceleration due to gravity, considered to be 9.81 m s−2, and V and CD in Eq. (A3) correspond to the values in Eqs. (2)–(7). The symbols µ and ρg are the dynamic
vis-cosity and density of the atmosphere and were assumed to be 1.837×10⁻⁵kg m−1s−1 and 1.194×10⁻⁵g cm−3, re-spectively. The results were based on conditions at an atmo-sphericT as 25◦C.
To ensure accuracy, we considered the surface roughness effect of a volcanic ash particle (1.07−1) on the fall veloc-ity, as suggested by Bagheri and Bonadonna (2016), and the results forD=4 mm are shown in Fig. A1.
Author contributions. MI and MM designed the study. AY and TM collected the samples and performed the free-fall experiment. SHS modified the original study topic and performed the study. MM and SHS performed research, obtained the results, and prepared the manuscript, along with contributions from all of the co-authors. DIL examined the results and checked the manuscript.
Competing interests. The authors declare that they have no conflict of interest.
Acknowledgements. The 2DVD data were provided by MEXT, Japan. We also thank the NIED for use of their large-rainfall simu-lator.
Financial support. This work was supported by a grant-in aid for JSPS KAKENHI (grant number JP16H03145) and partially sup-ported by a DPRI collaborative research grant (Kyoto University grant no. 25G-11).
Review statement. This paper was edited by Alexander Kokhanovsky and reviewed by Masayuki Oishi and one anonymous referee.
References
Bagheri, G., Bonadonna, C., Manzella, I., Pontelandolfo, P., and Haas, P.: Dedicated vertical wind tunnel for the study of sedimen-tation of non-spherical particles, Rev. Sci. Instrum., 84, 054501, https://doi.org/10.1063/1.4805019, 2013.
Bagheri, G. and Bonadonna, C.: On the drag of freely falling non-spherical particles, Powder Technol., 301, 526–544, 2016. Beckett, F., Witham, C., Hort, M., Stevenson, J., Bonadonna,
C., and Millington, S.: Sensitivity of dispersion model fore-casts of volcanic ash clouds to the physical characteristics of the particles, J. Geophys. Res.-Atmos., 120, 11636–11652, https://doi.org/10.1002/2015JD023609, 2015.
Bonadonna, C., Ernst, G., and Sparks, R.: Thickness variations and volume estimates of tephra fall deposits: the importance of par-ticle Reynolds number, J. Volcanol. Geoth. Res., 81, 173–187, 1998.
Bonadonna, C., Genco, R., Gouhier, M., Pistolesi, M., Cioni, R., Al-fano, F., Hoskuldsson, A., and Ripepe, M.: Tephra sedimentation during the 2010 Eyjafjallajökull eruption (Iceland) from deposit, radar, and satellite observations, J. Geophys. Res.-Sol. Ea., 116, B12202, https://doi.org/10.1029/2011JB008462, 2011.
Bonadonna, C., Folch, A., Loughlin, S., and Puempel, H.: Fu-ture developments in modelling and monitoring of volcanic ash clouds: outcomes from the first IAVCEI-WMO workshop on Ash Dispersal Forecast and Civil Aviation, B. Volcanol., 74, 1–10, 2012.
Böhm, H. P.: A general equation for the terminal fall speed of solid hydrometeors, J. Atmos. Sci., 46, 2419–2427, 1989.
Clift, R. and Gauvin, W.: Motion of particles in turbulent gas streams, Brit. Chem. Eng. Pr. Tec., 16, 439–448, 1971.
Coltelli, M., Miraglia, L., and Scollo, S.: Characterization of shape and terminal velocity of tephra particles erupted during the 2002 eruption of Etna volcano, Italy, B. Volcanol., 70, 1103–1112, 2008.
Del Bello, E., Taddeucci, J., Vitturi, M. d. M., Scarlato, P., Andron-ico, D., Scollo, S., Kueppers, U., and Ricci, T.: Effect of particle volume fraction on the settling velocity of volcanic ash particles: insights from joint experimental and numerical simulations, Sci. Rep., 7, 39620, https://doi.org/10.1038/srep39620, 2017. Dellino, P., Mele, D., Bonasia, R., Braia, G., La Volpe, L., and
Sulpizio, R.: The analysis of the influence of pumice shape on its terminal velocity, Geophys. Res. Lett., 32, L21306, https://doi.org/10.1029/2005GL023954, 2005.
Dioguardi, F., Mele, D., Dellino, P., and Dürig, T.: The terminal ve-locity of volcanic particles with shape obtained from 3-D X-ray microtomography, J. Volcanol. Geoth. Res., 329, 41–53, 2017. Dioguardi, F., Mele, D., and Dellino, P.: A New One-Equation
Model of Fluid Drag for Irregularly Shaped Particles Valid Over a Wide Range of Reynolds Number, J. Geophys. Res.-Sol. Ea., 123, 144–156, 2018.
Donnadieu, F.: Volcanological applications of Doppler radars: A re-view and examples from a transportable pulse radar in L-band, INTECH Open Access Publisher, 409–446, 2012.
Folch, A., Costa, A., and Macedonio, G.: FALL3D: A computa-tional model for transport and deposition of volcanic ash, Com-put. Geosci., 35, 1334–1342, 2009.
Ganser, G. H.: A rational approach to drag prediction of spherical and nonspherical particles, Powder Technol., 77, 143–152, 1993. Garboczi, E. and Bullard, J.: 3D analytical mathematical models of random star-shape particles via a combination of X-ray com-puted microtomography and spherical harmonic analysis, Adv. Powder Technol., 28, 325–339, 2017.
Haider, A. and Levenspiel, O.: Drag coefficient and terminal veloc-ity of spherical and nonspherical particles, Powder Technol., 58, 63–70, 1989.
Happel, J. and Brenner, H.: Low Reynolds number hydrodynamics: with special applications to particulate media, Springer Science & Business Media, 1–543, 2012.
Harris, D. M. and Rose, W. I.: Estimating particle sizes, concen-trations, and total mass of ash in volcanic clouds using weather radar, J. Geophys. Res.-Oceans, 88, 10969–10983, 1983. Herzegh, P. H. and Jameson, A. R.: Observing precipitation through
dual-polarization radar measurements, B. Am. Meteorol. Soc., 73, 1365–1376, 1992.
Hotta, K., Iguchi, M., and Tameguri, T.: Rapid dike intrusion into Sakurajima volcano on August 15, 2015, as detected by multi-parameter ground deformation observations, Earth Planet. Sc. Lett., 68, 1–9, https://doi.org/10.1186/s40623-016-0450-0, 2016. Hölzer, A. and Sommerfeld, M.: New simple correlation formula for the drag coefficient of non-spherical particles, Powder Technol., 184, 361–365, 2008.
Huang, G.-J., Bringi, V., Moisseev, D., Petersen, W. A., Bliven, L., and Hudak, D.: Use of 2-D-video disdrometer to derive mean density-size and Ze–SR relations: Four snow cases from the light precipitation validation experiment, Atmos. Res., 153, 34–48, 2015.
Iguchi, M.: Magma Movement from the Deep to Shallow Saku-rajima Volcano as Revealed by Geophysical Observations (<Special Section>Sakurajima Special Issue), Bulletin of the Volcanological Society of Japan, 58, 1–18, 2013.
Jaffrain, J., Studzinski, A., and Berne, A.: A network of disdrometers to quantify the small-scale variability of the raindrop size distribution, Water Resour. Res., 47, 1–8, https://doi.org/10.1029/2010WR009872, 2011.
Joss, J. and Waldvogel A.: A spectrograph for the automatic analy-sis of raindrops, Pure Appl. Geophys., 69, 240–246, 1967. Kruger, A. and Krajewski, W. F.: Two-dimensional video
disdrom-eter: A description, J. Atmos. Ocean. Tech., 19, 602–617, 2002. Kunii, D. and Levenspiel, O.: Fluidization Engineering, John Wiley,
8, 44–45, 1969.
Langmann, B., Folch, A., Hensch, M., and Matthias, V.: Volcanic ash over Europe during the eruption of Eyjafjallajökull on Ice-land, April–May 2010, Atmos. Environ., 48, 1–8, 2012. Löffler-Mang, M. and Joss. J: An optical disdrometer for measuring
size and velocity of hydrometeors, J. Atmos. Ocean. Tech., 17, 130–139, 2000.
Maki, M. and Doviak, R.: Volcanic ash size distribution determined by weather radar, 1810–1811, 2001.
Maki, M., Maesaka, T., Kozono, T., Nagai, M., Furukawa, R., Nakada, S., Koshida, T., and Takenaka, H.: Quantitative volcanic ash estimation by operational polarimetric weather radar, The 9th International Symposium on Tropospheric Profiling, L’Aquila, Italy, September 2012, ISBN 978-90-815839-4-7, 2012. Maki, M., Maesaka, T., Muraji, Y., and Suzuki, I.: Statistical
anal-ysis of volcanic ash measured by X-band polarimetric radar, 8th European Conference on Radar in Meteorology and Hydrology, 15 September, 2014.
Maki, M., Iguchi, M., Maesaka, T., Miwa, T., Tanada, T., Ko-zono, T., Momotani, T., Yamaji, A., and Kakimoto, I.: Prelimi-nary results of weather radar observations of sakurajima volcanic smoke, J. Disaster Res., 11, 15–30, 2016.
Marzano, F. S., Barbieri, S., Vulpiani, G., and Rose, W. I.: Volcanic ash cloud retrieval by ground-based microwave weather radar, IEEE T. Geosci. Remote, 44, 3235–3246, 2006.
Marzano, F. S., Picciotti, E., Vulpiani, G., and Montopoli, M.: Syn-thetic signatures of volcanic ash cloud particles from X-band dual-polarization radar, IEEE T. Geosci. Remote, 50, 193–211, 2012.
Marzano, F. S., Picciotti, E., Montopoli, M., and Vulpiani, G.: Inside volcanic clouds: Remote sensing of ash plumes using microwave weather radars, B. Am. Meteorol. Soc., 94, 1567–1586, 2013. Nešpor, V., Krajewski, W. F., and Kruger, A.: Wind-induced error of
raindrop size distribution measurement using a two-dimensional video disdrometer, J. Atmos. Ocean. Tech., 17, 1483–1492, 2000.
Oguchi, T., Udagawa, M., Nanba, N., Maki, M., and Ishimine, Y.: Measurements of dielectric constant of volcanic ash erupted from five volcanoes in Japan, IEEE T. Geosci. Remote, 47, 1089– 1096, 2009.
Poulidis, A. P., Takemi, T., Iguchi, M., and Renfrew, I. A.: Oro-graphic effects on the transport and deposition of volcanic ash: A case study of Mount Sakurajima, Japan, J. Geophys. Res.-Atmos., 122, 9332–9350, 2017.
Rong, L., Zhou, Z., and Yu, A.: Lattice–Boltzmann simulation of fluid flow through packed beds of uniform ellipsoids, Powder Technol., 285, 146–156, 2015.
Rosenfeld, D. and Ulbrich, C. W.: Cloud microphysical properties, processes, and rainfall estimation opportunities, in: Radar and Atmospheric Science: A Collection of Essays in Honor of David Atlas, Springer, 30, 237–258, 2003.
Seligman, A. N., Bindeman, I. N., Watkins, J. M., and Ross, A. M.: Water in volcanic glass: From volcanic degassing to secondary hydration, Geochim. Cosmochim. Ac., 191, 216–238, 2016. Sheppard, B. E.: Measurement of raindrop size distributions using a
small Doppler radar, J. Atmos. Ocean. Tech., 7, 255–268, 1990. Sigurdsson, H., Houghton, B., McNutt, S., Rymer, H., and Stix, J.:
The encyclopedia of volcanoes, Elsevier, 30, 1–1456, 2015. Stevenson, J. A., Millington, S. C., Beckett, F. M., Swindles, G.
T., and Thordarson, T.: Big grains go far: understanding the dis-crepancy between tephrochronology and satellite infrared mea-surements of volcanic ash, Atmos. Meas. Tech., 8, 2069–2091, https://doi.org/10.5194/amt-8-2069-2015, 2015.
Stokes, G. G.: On the effect of the internal friction of fluids on the motion of pendulums, Pitt Press Cambridge, 1–86, 1851. Suzuki, T.: A theoretical model for dispersion of tephra, Arc
vol-canism: physics and tectonics, 95–113, 1983.
Takahashi, M., Otsuka, T., Sako, H., Kawamata, H., Yasui, M., Kanamaru, T., Otsuki, M., Kobayashi, T., Ishihara, K., and Miki, D.: Temporal Variation for Magmatic Chemistry of the Sakura-jima Volcano and Aira Caldera Region, Southern Kyushu, South-west Japan since 61 ka and Its Implications for the Evolution of Magma Chamber System, Bulletin of the Volcanological Society of Japan, 58, 19–42, 2013.
Tajima, Y., Ohara, D., Fukuda, K., and Shimomura, S.: Develop-ment of Automatic Tephrometer for Monitoring of Volcano, 23, 39–46, 2015.
Thurai, M. and Bringi, V.: Drop axis ratios from a 2-D video dis-drometer, J. Atmos. Ocean. Tech., 22, 966–978, 2005.
Tokay, A., Wolff, D. B., and Petersen, W. A.: Evaluation of the new version of the laser-optical disdrometer, OTT Parsivel2, J. At-mos. Ocean. Tech., 31, 1276–1288, 2014.
Tran-Cong, S., Gay, M., and Michaelides, E. E.: Drag coefficients of irregularly shaped particles, Powder Technol., 139, 21–32, 2004. Van Eaton, A. R., Muirhead, J. D., Wilson, C. J., and Cimarelli, C.: Growth of volcanic ash aggregates in the presence of liquid water and ice: an experimental approach, B. Volcanol., 74, 1963–1984, 2012.
Waterman, P. C.: Symmetry, unitarity, and geometry in electromagnetic scattering, Phys. Rev. D, 3, 825, https://doi.org/10.1103/PhysRevD.3.825, 1971.
Wilson, L. and Huang, T.: The influence of shape on the atmo-spheric settling velocity of volcanic ash particles, Earth Planet. Sc. Lett., 44, 311–324, 1979.
Wilson, T. M., Jenkins, S., and Stewart, C.: Impacts from volcanic ash fall, in: Volcanic Hazards, Risks and Disasters, Elsevier, 2015.