RESEARCH ARTICLE
Expression regulation and functional
analysis of RGS2 and RGS4 in adipogenic
and osteogenic differentiation of human
mesenchymal stem cells
Alma Madrigal
1,2, Lun Tan
1and Yuanxiang Zhao
1*Abstract
Background: Understanding the molecular basis underlying the formation of bone-forming osteocytes and lipid-storing adipocytes will help provide insights into the cause of disorders originating in stem/progenitor cells and develop therapeutic treatments for bone- or adipose-related diseases. In this study, the role of RGS2 and RGS4, two members of the regulators of G protein signaling (RGS) family, was investigated during adipogenenic and osteo-genenic differentiation of human mesenchymal stem cells (hMSCs).
Results: Expression of RGS2 and RGS4 were found to be inversely regulated during adipogenesis induced by dexa-methasone (DEX) and 3-isobutyl-methylxanthine, regardless if insulin was present, with RGS2 up-regulated and RGS4 down-regulated in response to adipogenic induction. RGS2 expression was also up-regulated during osteogenesis at a level similar to that induced by treatment of DEX alone, a shared component of adipogenic and osteogenic differen-tiation inducing media, but significantly lower than the level induced by adipogenic inducing media. RGS4 expression was down-regulated during the first 48 h of osteogenesis but up-regulated afterwards, in both cases at levels similar to that induced by DEX alone. Expression knock-down using small interfering RNA against RGS2 resulted in decreased differentiation efficiency during both adipogenesis and osteogenesis. On the other hand, expression knock-down of RGS4 also resulted in decreased adipogenic differentiation but increased osteogenic differentiation.
Conclusions: RGS2 and RGS4 are differentially regulated during adipogenic and osteogenic differentiation of hMSCs. In addition, both RGS2 and RGS4 play positive roles during adipogenesis but opposing roles during osteogenesis, with RGS2 as a positive regulator and RGS4 as a negative regulator. These results imply that members of RGS proteins may play multifaceted roles during human adipogenesis and osteogenesis to balance or counterbalance each other’s function during those processes.
Keywords: RGS2, RGS4, Human mesenchymal stem cells (hMSCs), Adipogenesis, Osteogenesis
© The Author(s) 2017. This article is distributed under the terms of the Creative Commons Attribution 4.0 International License (http://creativecommons.org/licenses/by/4.0/), which permits unrestricted use, distribution, and reproduction in any medium, provided you give appropriate credit to the original author(s) and the source, provide a link to the Creative Commons license, and indicate if changes were made. The Creative Commons Public Domain Dedication waiver (http://creativecommons.org/ publicdomain/zero/1.0/) applies to the data made available in this article, unless otherwise stated.
Background
Advancement in understanding adipose and bone tissue biology will help develop new strategies for the preven-tion and intervenpreven-tion of adipose- and bone-related dis-eases, including obesity and osteoporosis. Adipogenesis
and osteogenesis are processes in which uncommitted stem cells differentiate into mature adipocytes or osteo-cytes, respectively. Over the past two decades or so, many individual adipogenic regulators have been inde-pendently uncovered, which include specific signaling pathways (TGFβ/BMP, Wnt, Hedgehogs, MAPK and JAK-STAT3 signaling etc.), growth factors or cytokines (FGF1/2, RB, ZFP423 and SOX9 etc.), transcription fac-tors (C/EBPs, PPARγ, KLF4, FOXC2 and GATA2/3 etc.), GTPase proteins and its regulators (RHO and ROCK
Open Access
*Correspondence: zhao@cpp.edu
1 Biological Sciences Department, California State Polytechnic University
etc.), epigenetic regulators and microRNAs etc. [1–3]. Most significantly, C/EBPα (CCAAT/enhancer bind-ing protein alpha) and PPARγ (peroxisome proliferator-activated receptor gamma) were identified as two key transcriptional factors, which when over-expressed could dictate adipogenic cell fate in both murine preadipocyte cell line 3T3L1 and hMSCs [4–8]. Similarly, many sign-aling pathways including TGFβ/BMP signsign-aling, Wnt signaling, HH signaling, Notch signaling, PI3K signal-ing, and ERK1/2 and p38 MAPK mediated signalsignal-ing, as well as growth factors (FGFs), hormones (Estrogen and Parathyroid hormone), transcription factors (Runx2 and Osterix), bone matrix proteins (ALP, BSP, OCN, OPN, COL 1) and microRNAs etc. have been implicated in osteogenic regulation [9–12]. Among those, Runx 2 and Osterix were identified as master regulators of osteoblast commitment, proliferation and maturation, as knockout mice deficient in either Runx2 or Osterix failed to form bone due to lack of osteoblasts [13, 14]. In addition, over-expression of Runx2 helps stimulate transdifferentiation of 3T3L1 preadipocytes into bone-forming osteoblasts in vitro [15]. Runx2 regulates the expression of osteo-genic markers ALP, BSP, OCN, OPN and COL 1, as well as Osterix, though Osterix can be induced by signaling pathways independent of Runx2 [16].
While the adipogenic and osteogenic lineage commit-ment clearly involve distinct master transcriptional regu-lators and downstream genetic cascades, in many cases, they are also regulated by the same signaling pathways (Ex. Wnt, IGF and HH signaling) and genes [17, 18]. For examples, many of the siRNA hits identified through a high throughput screen were found to promote osteo-genic differentiation but inhibited adipogenesis, and cAMP was identified to play opposing roles in osteoge-neis vs. adipogenesis [17]. In addition, there appears to be an inverse relationship between adipogenesis and osteo-genesis, with one process inhibiting the other [19]. Some medical drugs such as Rosiglitazone have been found to increase adiposity at the expense of bone formation [20–
23]. Aging has also been shown to increase bone marrow adiposity but decrease bone mass and strength, which appear to be mediated through regulators of both adipo-genesis and osteoadipo-genesis [24–28]. These findings indicate that studying the role of potential regulators involved in both adipogeneis and osteogenesis is important in order to better understand the relationship between adipose and bone biology and the etiology of their disease states.
Human mesenchymal stem cells (hMSCs) are a type of adult stem cell that exist in multiple tissues in the body, including adipose tissue, bone marrow and peripheral blood, and play important roles in maintaining normal tissue homeostasis. They can be isolated, expanded and differentiated in vitro into a number of specialized cell
types including adipocytes and osteocytes, which makes them an excellent in vitro cell model for studying human adipogenesis and osteogenesis [29]. Using a simple cock-tail of adipogenic inducing media (AIM) containing dex-amethasone (DEX), 3-isobutyl-1-methylxanthine (IBMX) and insulin, hMSCs can be induced to differentiate into mature adipocytes [29, 30]. Similarly, using a cocktail of osteogenic inducing media (OIM) containing DEX, ascorbic acid-2-phosphate and beta-glycerophosphate, hMSCs can undergo osteogenesis and become mature osteocytes [17, 29]. Due to their ability to differentiate into a variety of mature cell types, low allogeneic immune response and low tumorigenicity in graft recipients, hMSCs have been of great interests to researchers explor-ing cell-based therapies as well and is the most prevalent cell type used in ongoing stem-cell based clinical trials [31]. In addition to advancing our basic understanding of adipose and bone tissue biology, the potential therapeutic application of hMSCs in adipose and bone tissue engi-neering makes it even more relevant to use these cells for studying human adipogenesis and osteogenesis [32–35].
Using adipose tissue derived hMSCs as an in vitro model for adipogenic differentiation, we identified through microarray analysis two members of the regu-lator of G protein signaling (RGS) family, RGS2 and RGS4, which were differentially regulated upon adi-pogenic induction (unpublished data). Both RGS2 and RGS4 belong to the B/R4 subfamily of RGS proteins fam-ily characterized by a conserved 120 aas RGS domain flanked by short amino and carboxyl termini [36]. They are intracellular proteins primarily recognized for their GTPase activating protein (GAPs) activity, which inhibits G-protein coupled receptor (GPCR) signaling by deac-tivating the Gα subunits of heterotrimeric G proteins through stimulating Gα-bound GTP hydrolysis [37]. RGS2 possesses intrinsic GAP activity that is selective for Gq-class Gα subunits, whereas RGS4 has intrinsic GAP activity for both Gq and Gi/o-class Gα subunits [38, 39]. As GPCRs comprise the largest cell surface receptors in mammalian cells, GPCR mediated signaling regulates a wide array of cellular processes including proliferation, differentiation, cell death and numerous physiological functions. Unsurprisingly, RGS proteins are expressed in essentially all cell types, tissues and organ systems and have been implicated in various physiology and dis-ease as well, including hemapopoiesis, synaptic signaling plasticity in the brain/anxiety disorder, smooth muscle contraction and relaxation/hypertension, kidney func-tion, cancer migration and invasion [40–45]. Aside from G-protein dependent activity, RGS proteins are also involved in G-protein independent signaling [46].
the role of RGS proteins during human adipogenesis and osteogenesis is very limited. No study thus far has directly examined the role of RGS in osteogenesis, though past studies have revealed an important role of RGS proteins during bone remodeling by modulating osteoclastogen-esis [47, 48]. RGS2 was also found to be expressed in rat metaphyseal and diaphyseal bone and cultured mouse osteoblasts, implicating potential function in bone devel-opment [47]. In addition, several GPCRs involved in osteogenesis including parathyroid hormone 1 receptor (PTH1R), frizzled (Fz) and calcium sensing receptor (CsR) are expressed in osteoblasts and regulated by RGS pro-teins [49]. On the other hand, a more direct relationship between RGS proteins and adipose physiology have been established through knock-out mice models and in vitro studies in murine cell lines. Loss of RGS5 in mice resulted in exacerbated obesity, hepatic steatosis, inflammation, and insulin resistance while loss of RGS2 in mice leads to lower weights, reduced fat deposits, decreased serum lipids, and lower leptin levels [50, 51]. Preadipocytes iso-lated from RGS2−/− mice showed lower expression lev-els of adipogenic markers including PPARYγ, CEBPα, and leptin. In another study using NIH-3T3 mouse preadipo-cyte cells, RGS2 overexpression promoted adipogensis in the presence of a ligand for PPAR γ [52]. RGS4 knockout mice also showed a significantly lower body weight com-pared to wild type mice [53], though in a separate study, these mice showed no significant effect on body weight but had increased circulating free fatty acid, indicating a role in lipolysis [54]. The role of RGS2 or RGS4 in human adipogenesis however remains unknown.
In this study, we characterized the temporal expres-sion patterns of both RGS2 and RGS4 genes during adi-pogenic and osteogenic differentiation of hMSCs, as well as their function during both processes. Our results dem-onstrated that RGS2 and RGS4 are differentially regu-lated during adipogenic and osteogenic differentiation of hMSCs, with both playing positive roles during adipo-genesis but opposite roles during osteoadipo-genesis.
Results
Characterization of adipose‑derived hMSCs by clonogenicity and molecular marker expression
The adipose-derived hMSCs used in this study were obtained from a commercial source (see “Methods”). Pre-viously we have shown that these cells were able to dif-ferentiate into adipocytes and osteocytes in response to appropriate external stimuli [55]. To gain a better under-standing of these cells, both clonogenicity of these cells as well as the expression of three known hMSCs mark-ers, CD73, CD90 and CD105, were examined at passage 4 (P4), the same passage cells used in all subsequent experiments.
Of 3 independent repeats, the average clonogenicity (number of cells per clone is > 50) was determined to be 8% (± 0.67%) (Additional file 1: Figure S1).
To determine the expression of the three marker genes, immunostaining was carried out first. Both CD73 and CD105 were shown to be expressed almost ubiquitously, especially with CD105 whose expression in each individ-ual cell can be easily discerned (Additional file 2: Figure S2, top 2 rows). Immunostaining with antibodies against CD90 from two different sources appeared to be chal-lenging despite several attempts with various conditions, which had also been predicted due to indicated formalin sensitivity of epitope recognized by the antibody. Flow cytometry was subsequently used to analyze the expres-sion of CD90. As control, cells were also co-stained with antibody against CD73. About 96 and 95.72% of cells independently express CD73 and CD90 respectively, and about 95% of cells co-express both (Additional file 2: Fig-ure S2, bottom 2 rows).
In conclusion, the above results indicate that the adi-pose-derived hMSCs used in this study demonstrated 8% clonogenicity, with about 95% of them expressing all three markers, CD73, CD90 and CD105.
Temporal expression of RGS2 and RGS4 during adipogenesis and osteogenesis
Our initial interest in members of the regulator of G protein signaling (RGS) family began with a microarray analysis aimed at identifying novel regulators of human adipogenesis (unpublished data). Briefly, the expression profiles of hMSCs exposed to adipogenic differentiation condition (IBMX + DEX + insulin in growth media) was compared to undifferentiated hMSCs at 36 and 72 h post induction. Through this analysis, RGS2 and RGS4 were found to be significantly up- and down-regulated respec-tively during early adipogenesis, with RGS2 up regulated by 15-folds, and RGS4 down regulated by 100-folds at 72 h post induction. Because adipose and bone cells share common progenitor cells and there are shared regula-tors between adipogenesis and osteogenesis [17, 18], we expanded our interest in understanding the role of RGS2 and RGS4 in both adipogenesis and osteogenesis.
used in hMSC differentiation into adipocyte, osteocyte, and chondrocytes, and is thought to be necessary to potentiate differentiation and prevent apoptosis [56, 57]. Therefore, to also dissect the role of individual compo-nent of differentiation inducing cocktails on the expres-sion of RGS2 and RGS4, RT-PCR was performed on both genes in hMSCs cultured in 8 different media treatments that include CM (control group), DEX (0.2 µM), DEX (1 µM), DEX (0.2 µM) + IBMX, AIM with 0.2 µM DEX, AIM with 1 µM DEX, OIM with 0.2 µM DEX, and OIM with 1 µM DEX, at eight different time points including D0.5, D1, D1.5, D2, D4, D5, D6 and D7 post initial treat-ment, with media change at 48-h intervals. All treatment
group media was made in CM. Transcript level of RGS2 and RGS4 in each treatment group were normalized to that of a housekeeping gene HSP90 (internal control) and compared to its normalized level in CM control at cor-responding time point.
As expected, expression of C/EBPα and PPARγ, two well-known master regulators for adipogenic lineage commitment, were both highly up regulated in AIM treated cells (Fig. 1a, b). Similarly, expression of LPL, a relatively later stage adipogenic marker encoding a lipoprotein lipase that breaks down lipids [58]. was also highly enriched in AIM treated cells (Fig. 1c) (Expres-sion of LPL was undetectable in CM groups, so its
expression in AIM and OIM treated cells was compared to its expression in DEX treated cells). On the other hand, expression of Runx2, a master regulator for osteogenic differentiation [14], was expressed at a higher level in OIM treated cells relative to AIM treated cells, especially after D4 (Fig. 1d). However, expression of osteocalcin (OC), which encodes a bone specific protein synthesized by osteoblast and serves as a marker of osteogenic matu-ration [59], appeared to be only slightly upregulated in DEX and OIM treated cells compared to its expression in AIM before D4, but reached to a similar level across all treatment groups thereafter (Fig. 1e).
Expression of RGS4 remained high in hMSCs cul-tured in CM throughout D0.5 to D7, but was differ-entially regulated in response to adipogenic induction (DEX + IBMX or AIM) vs. osteogenic induction (OIM) (Fig. 2a). Starting as early as D0.5, adipogenic induction by DEX + IBMX or AIM, regardless of DEX concentra-tions, resulted in down regulation of RGS4 by 2.5- to 5-folds. By D1, RGS4 was barely detectable and remained significantly down-regulated throughout the remaining treatment duration (Fig. 2). In OIM treatments, again regardless of DEX concentrations, RGS4 expression fol-lowed a similar pattern as in DEX treatment alone, first slightly downregulated by 1.5- to 3.3-folds between D0.5 and D2 and then upregulated by up to 3.75-fold between D4 and D7 (Fig. 2a). Overall, RGS4 expression is down regulated by all adipogenic treatment conditions starting as early as 12 h post treatment initiation, and upregulated by osteogenic treatments starting D4 in a pattern similar to DEX only treatment.
Expression of RGS2 is upregulated by all treatment types relative to its expression in control CM, though the
degree of changes differs between adipogenic conditions and the other treatment conditions at certain time points (Fig. 2b). In contrast to RGS4, RGS2 expression was very low in hMSCs cultured in CM (Fig. 2b). Similar to RGS4 however, RGS2 expression in OIM followed the same pat-tern as its expression in DEX treatment alone, regardless of DEX concentrations. At D0.5, RGS2 was upregulated by 3.5- to 5-folds across all treatment groups compared to CM. At D1, RGS2 expression was induced to 12- to 14-folds higher in all adipogenic treatment conditions as compared to CM, which is about twice its level in DEX alone or OIM conditions. Between D1.5 and D4, its over-all expression level was reduced across over-all treatment groups as compared to D1, but remained about twofold higher in all adipogenic conditions as compared to OIM or DEX alone. By D5, there was no significant differ-ence across different treatment groups and by D6, RGS2 expression across all treatment groups dropped to simi-lar levels as in CM control. Overall, expression of RGS2 is upregulated by all treatment types throughout D0.5 to D5, with significantly greater gain in adipogenic condi-tions (around twofolds) compared to the other treatment conditions between D1 and D4.
In conclusion, expression of both RGS2 and RGS4 in OIM treatment was regulated in parallel to that by dexa-methasone treatment alone, regardless of DEX concen-trations, indicating that the other two components in OIM media, AA-2-P and β-glycerophosphate, had no significant effect on RGS2 and RGS4 expression. RGS2 was upregulated by both DEX and OIM starting as early as D0.5 and subsiding by D6, whereas RGS4 was slightly downregulated by DEX and OIM during D0.5 to D2 but up-regulated afterwards. On the contrary, expression of
Fig. 2 Temporal expression of RGS4 and RGS2 in AIM and OIM treatments. Expression of RGS4 (a) and RGS2 (b) was examined by RT-PCR in hMSCs cultured in 8 different media treatments, including CM (control), DEX (0.2 µM), DEX (1 µM), DEX (0.2 µM) + IBMX, AIM with 0.2 µM DEX, AIM with 1 µM DEX, OIM with 0.2 µM DEX, and OIM with 1 µM DEX. Expression in each treatment condition was examined at eight different time points, including D0.5, D1, D1.5, D2, D4, D5, D6 and D7 post initial treatment. Graphs represent average gene expression level normalized to that of HSP90
both RGS2 and RGS4 differs significantly in adipogenic conditions as compared to in DEX alone, regardless of DEX concentration, indicating that IBMX and/or insulin exerted additional effect on their expression. Since their expression in IBMX + DEX inducing media is highly similar as in AIM, it suggests that IBMX, and not insu-lin, exerts such effect. Similar to DEX treatment, adipo-genic treatment enhanced RGS2 expression until D6, but at significantly higher level (around twofolds) than DEX alone during D1 to D4. For RGS4 expression however, adipogenic treatment not only significantly inhibited the expression of RGS4 at a much greater level than DEX alone during D0.5 to D2 (near undetectable level), but also continued to downregulate its expression through-out the remaining course when it was being upregulated by DEX alone. Hence regulation of RGS2 and RGS4 expression were completely opposite to each other in adi-pogenic conditions.
Regulation of RGS2 and RGS4 during adipogenic and osteogenic differentiation is independent of media type
Since the Hyclone growth media (CM) used in compos-ing the AIM media for adipogenic induction is a pro-prietary product that might contain unknown growth factor supplement, we wondered whether expression of RGS2 and RGS4 would remain similar in AIM based on a different growth media. Temporal expression pattern of RGS2 and RGS4 was then re-examined in parallel in cul-ture conditions based on Hyclone CM, heat-inactivated fetal bovine serum (FBS) in DMEM complete media (HI-FBS CM), or (HI-FBS in DMEM complete media ((HI-FBS CM). The conditions included Hyclone CM or HI-FBS CM, Hyclone CM DEX (1 µM) or HI-FBS CM DEX (1 µM), Hyclone CM based AIM or HI-FBS CM based AIM or FBS CM based AIM (all with 1 µM DEX), and Hyclone CM based OIM (with 1 µM DEX) at D0.5, D1, D1.5, D2, D3 and D4 post adipogenic initiation (Additional file 3: Figure S3).
Similar to previous results, expression of RGS4 was downregulated by both DEX alone and AIM from D0.5 to D3, regardless whether they were Hyclone CM or HI-FBS CM based, however, its level was significantly higher in Hyclone CM based AIM than in HI-FBS CM based AIM at day 1 and day 2 (Additional file 3: Figure S3A). Similarly, RGS2 expression was upregulated by both DEX alone and AIM, regardless whether they were Hyclone CM or HI-FBS CM based. However, its surge in Hyclone CM based AIM was significantly greater (by up to two-folds) than that in HI-FBS CM based AIM (Additional file 3: Figure S3B). As a parallel control, expression of RGS2 and RGS4 in Hyclone OIM remain similar to previ-ously described results.
In conclusion, the above results indicate that regula-tion of RGS2 and RGS4 during adipogenic differentia-tion is independent of media type, though the degree of change could vary. Next, we sought to determine the role of RGS4 and RGS2 during adipogenic and osteogenic dif-ferentiation through siRNA mediated gene silencing.
Expression knockdown of RGS2 and RGS4 in differentiating ad‑hMSCs by reverse siRNA transfection
Previously, we identified XtremeGENE siRNA transfec-tion reagent as a highly efficient siRNA delivery system in bone marrow derived hMSCs [17]. To confirm the effec-tiveness of this transfection reagent in adipose derived hMSCs (Ad-hMSCs), Ad-hMSCs were reverse trans-fected with siTOX or control siRNA SiCON at 16.5 nM. The former activates cellular death response while the latter does not target any known genes in the human genome. Total cell numbers at days 1, 2, 6, and 12 post transfection were compared between siTOX and siCON. SiTOX reduced cell number by 23% (day 1), 84% (day 2), 83% (day 6), and 72% (day 12) compared to siCON, with-out any noticeable cytotoxic effect in siCON treated cells (Additional file 4: Figure S4). Based on the above results, future experiments were conducted using 16.5 nM of siRNA to achieve 80–90% of transfection efficiency.
To examine the role of RGS2 and RGS4 in ad-hMSCs differentiation into adipocytes and osteocytes, siRNAs commercially validated against two different regions of the RGS4 mRNA (siRGS4-8 and siRGS4-10) and RGS2 mRNA (siRGS2-2 and siRGS2-3) were tested. SiRNA was transfected into cells at 2 days (D-2) prior to adipogenic differentiation initiation (D0 AIM). Expression of RGS2 and RGS4 in transfected ad-hMSCs were examined at day 1, 3, 5, 7, and 12 post adipogenic initiation with AIM containing 1.0 µM DEX or osteogenic initiation with OIM containing 0.2 µM DEX (Fig. 3). Expression level of RGS2 and RGS4 in each treatment group was normalized against the expression level of HSP90 and then graphed relative to its normalized expression in siCON control group at the same time point.
Fig. 3 Expression knockdown of RGS4 and RGS2 mRNA induced by siRNA during adipogenic and osteogenic differentiation of hMSCs. Expression of RGS2 and RGS4 were examined at day 1, 3, 5, 7, and 12 after differentiation initiation at 48 h post siRGS2 and siRGS4 transfection, respectively. a–c Expression knockdown of RGS4 by siRGS4-8 and siRGS4-10 during adipogenic differentiation of hMSCs. d–f Expression knockdown of RGS4 by
siRGS4-8 and siRGS4-10 during osteogenic differentiation of hMSCs. g–i Expression knockdown of RGS2 by siRGS2-2 and siRGS2-3 during adipogenic differentiation of hMSCs. j–l Expression knockdown of RGS2 by siRGS2-2 and siRGS2-3 during osteogenic differentiation of hMSCs. In a, d, g and j, expression level of RGS2 or RGS4 in each treatment group was determined relative to their expression in siCON control group, after normalization against the expression level of internal control HSP90 at each given time point. In b, e, h and k, expression level of RGS2 or RGS4 in each treatment group was normalized against the expression level of internal control HSP90 at each given time point. In c, f, i and l, agarose gel images of RGS4 or
Overall, siRGS4 resulted in around 50–75% expression knockdown in RGS4 expression at the RNA level and there was no significant difference between siRGS4-8 and siRGS4-10 in RGS4 expression knockdown at any time point tested during adipogenesis or osteogenesis.
To examine the expression knockdown of RGS4 at the protein level, western blots were carried out using two types of antibodies that recognize two different motifs of RGS4 protein separately (see “Methods”). One binds to the C-terminal sequence (amino acids 182–205) outside of the RGS domain (amino acids 62–178) and detects the RGS4 isoform 3 product at 34 kDa. The other binds to the N-terminal sequences (amino acids 40–82) and detects the RGS4 isoforms 1 and 2 both at about 23 kDa. Expression level of RGS4 was compared between siRGS4 -8 and siRGS4-10 transfected cells and siCON trans-fected cells at day 1, 2, 3, 4, 5 and 7 post AIM or OIM treatment initiation. Expression level remained similar among all groups at all time points examined (data not shown), except for day 7, when expression of RGS4 iso-form 3 was consistently, thought slightly, down regulated in siRGS4-8 and siRGS4-10 transfected cells as compared to in siCON transfected cells by about 30 and 20% in AIM and OIM treatment condition, respectively (expression in OIM is shown in Additional file 5: Figure S5A). This delayed and subtle change at the protein level may imply much greater RGS4 protein stability as compared to its RNA transcript, in addition to other plausible causes (see “Discussion”).
In samples treated with AIM, RGS2 mRNA was sig-nificantly (p < 0.05) lower in siRGS2-2 samples at day 1 (84%), 3 (73%), 5 (83%), and 7 (80%) compared to siCON (100%) (Fig. 3e, f). The effect of siRGS2-2 was gone by day 12. Similarly, in siRGS2-3 treatments, RGS2 mRNA was significantly (p < 0.01) lower at day 1 (71%), and 3 (56%), 5 (63%), 7 (68%) and 12 (79%) (Fig. 3e, f). In sam-ples treated with OIM, RGS2 mRNA was significantly (p < 0.05) lower in siRGS2-2 samples at day 1 (73%), and non-significantly lower by day 3 (86%), 7 (80%), and 12 (83%) (Fig. 3g, h). In siRGS2-3 samples, RGS2 mRNA was significantly (p < 0.05) down regulated at day 1 (51%), day 3 (63%), day 7 (75%), but resumed to control level by day 12 (103%) (Fig. 3g, h). Overall, siRGS2-2 and siRGS2-3 resulted in expression knockdown of RGS2 by 20–30 and 30–50%, respectively.
Since upregulation of RGS2 expression upon adipo-genic initiation was significantly greater in Hyclone CM based AIM as compared to HI-FBS CM based AIM, and considering that the expression knockdown by siRGS2 was modest in Hyclone CM based AIM (by 20–50%), we wondered whether siRGS2 would have greater knock-down in HI-FBS CM based AIM due to lower basal level of RGS2 expression, and hence greater phenotypic effect.
Similar to previous studies, expression knockdown of RGS2 by siRGS2-2 and siRGS2-3 was evaluated at days 1, 3, 5, 7, and 14 post treatment initiation with HI-FBS CM based AIM at 48 h after siRNA transfection. In siRGS2-2 samples, expression of RGS2 was significantly lower (p < 0.05) at day 3 (69%), 5 (60%) and 7 (51%), but resumed to control levels (97%) at day 12 as compared to siCON samples (100%) (Additional file 6: Figure S6). Sim-ilarly, in siRGS2-3 samples, expression of RGS2 was sig-nificantly lower (p < 0.05) at day 1 (43%), 3 (34%), 5 (32%), and 7 (49%) and resumed to control level by day 12 (94%) compared to siCON (100%) (Additional file 6: Figure S6).
Expression knockdown of RGS2 at the protein level was also examined by western blots in siRGS2-2, siRGS2 -3 or siCON treated cells under AIM and OIM treatment conditions using Hyclone CM based media. Consistently, expression of RGS2 was down regulated by 30–40% in siRGS2-2 cells and 60–70% in siRGS2-3 cells as com-pared to in siCON cells on day 2 post AIM or OIM treatment initiation (expression in OIM is shown in Additional file 5: Figure S5B), which correlates well to the level of expression knockdown detected at the RNA level as shown above.
In conclusion, during early adipogenic and osteogenic treatments in Hyclone CM based media, both siRGS4-8 and siRGS4-10 downregulated RGS4 expression by about 50–75% at the RNA level, but only about 20–30% expres-sion knockdown was detected in isoform 3 of RGS4 at the protein level, whereas siRGS2-2 and siRGS2-3 downregu-lated RGS2 expression by 20–30 and 30–50% respectively at the RNA level and similarly by 30–40 and 60–70% respectively at the protein level. Additionally, in HI FBS CM based AIM condition, siRGS2-3 exerted a greater level of gene silencing (by 50–70%) compared to siRGS2 -2 (by 30–50%) at the RNA level, both of which are greater than their respective silencing effect in Hyclone CM based AIM. Next, we examined the effect of expression knockdown induced by siRGS2 and siRGS4 on adipo-genic and osteoadipo-genic differentiation of hMSCs.
Expression knockdown of RGS2 and RGS4 exerts different levels of inhibitory effect on adipogenic differentiation of ad‑hMSCs
of DAPI and OilRedO stained cells were taken from mul-tiple wells of each treatment group for total cell counting, adipocytes counting and area measurements of stained lipid droplets in OilRedO images, and OilRedO dye was subsequently extracted with isopropanol and quantified by absorbance reading at 515 nm (see “Methods”).
For RGS4 expression knockdown, whole-well images showed noticeably lower intensity of OilRedO stains in siRGS4-10 but not siRGS4-8 groups compared to siCON
control (Fig. 4a). Correspondingly, OilRedO quantifica-tion was significantly lower in siRGS4-10 treatment group (82%, p < 0.05) compared to siCON controls (100%), and the difference between siRGS4-8 treatment group (98%) and siCON control (100%) was insignificant (Fig. 4b). Consistently, area measurements of stained oil droplets were significantly lower in siRGS4-10 treatment groups (42%, p < 0.01) compared to siCON (100%), but insignifi-cantly lower in RGS4-8 (85%) compared to siCON (100%)
(Fig. 4c, d). Differences in total fat accumulation could be a result of variation in adipocyte numbers and/or varia-tion in lipid accumulavaria-tion within individual adipocytes. To determine the cause, total cell counts and adipocyte cell counts were determined based on DAPI nuclear stain and manual identification of mature adipocytes in OiRedO images respectively. Total cell numbers were significantly lower in both siRGS4-8 (88%, p ≤ 0.05) and siRGS4-10 (87%, p ≤ 0.05) treatment groups compared to siCON controls (100%) (Fig. 4e). Adipocyte cell numbers were even more drastically lower in both siRGS4-8 (50%, p < 0.05) and RGS4-10 (17%, p < 0.01) treatment groups compared to siCON controls (100%) (Fig. 4f). Percentage of adipocytes calculated by adipocytes number/total cell number was also significantly lower in siRGS4-8 (57%, p < 0.01) and siRGS4-10 (21%, p < 0.01) treatment groups compared to siCON controls (100%) (Fig. 4f). Overall, expression knockdown of RGS4 by siRGS4 resulted in significantly decreased total fat accumulation, total cell numbers, total adipocyte numbers and differentiation efficiency as reflected by percentage of adipocytes, with siRGS4-10 exerting greater effect than siRGS4-8.
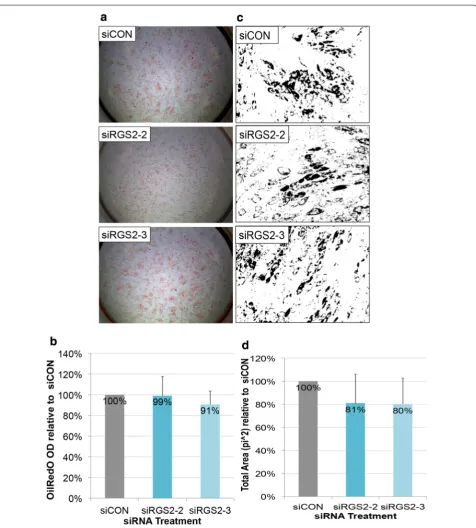
For RGS2 expression knockdown, there was no notice-able difference in OilRedO staining intensity (Fig. 5a). Oil-RedO quantification was not significantly different between siRGS2-2 (99%) or siRGS2-3 (91%) treatment groups and siCON controls (100%) neither (Fig. 5b). Consistently, total area (pi2) measurements of OilRedO stained oil droplets trended lower in both siRG2-2 (81%) and siRGS2-3 (80%) treatment groups compared to siCON controls (100%), but the difference was not statistically significant (Fig. 5c, d). Nuclear counts in siRGS2-2 (96%) and siRGS2-3 (97%) slightly but consistently trended lower than siCON controls (100%), though statistically insignificant neither (data not shown). Overall, siRGS2 did not significantly affect total fat areas or total cell numbers as compared to siCON treat-ment in Hyclone CM based AIM condition.
The effect of siRGS2 on adipogenesis induced by HI FBS CM based AIM was also analyzed. In contrary to Hyclone CM based AIM condition, OilRedO stain intensity in both siRGS2-2 and siRGS2-3 treatments appeared visually reduced compared to siCON (Fig. 6a). Total fat accumu-lation quantification by OilRedO dye extraction however was only significantly lower in siRGS2-2 (86%, p < 0.05) but not in siRGS2-3 (96%) treatment groups as compared to siCON controls (100%) (Fig. 6b). Consistently, total area measurements (pi2) of stained oil droplets was signifi-cantly lower in siRGS2-2 (55%, p < 0.05) and only trended lower in siRGS2-3 (80%, p < 0.1) treatments as compared to in siCON controls (100%) (Fig. 6c, d). Subsequently we determined whether decreased total fat accumulation was the result of reduction in adipocyte numbers and/or differentiation efficiency. Total nuclear counts were only
significantly lower in siRGS2-2 (87%, p < 0.05) but not in siRGS2-3 (92%) treatment groups compared to siCON controls (100%) (Fig. 6e). Total adipocyte number trended lower in both siRGS2-2 (82%, p < 0.1) and siRGS2-3 (86%) treatments compared to siCON controls (100%) (Fig. 6f). Percent of adipocytes in siRGS2-2 (96%) and siRGS2-3 (90%) groups were not significantly different from siCON controls (100%) (Fig. 6f). Overall, in the HI FBS CM based AIM induced adipogenic differentiation, siRGS2-3 had mild inhibitory effect that was statistically deemed insig-nificant, but siRGS2-2 treatment significantly inhibited total fat accumulation as compared to siCON, which was likely the consequence of significantly reduced total num-ber of cells, as differentiation efficiency determined by percentage of adipocytes was not significantly different between siRGS2-2 and siCON.
In conclusion, expression knockdown of RGS4 by 50–75% significantly inhibited adipogenic differentiation of hMSCs by reducing total adipocytes and adipogenic differentiation efficiency, with siRGS4-10 exerting greater effect than siRGS4-8. Expression knockdown of RGS2 also exhibited similar inhibitory effect in HI-FBS CM based AIM but not Hyclone CM based AIM conditions, likely due to greater expression knockdown in the former vs. the latter, with siRGS2-2 exerting greater effect than siRGS2-3. Such effect was at least partly due to reduced total adipocytes as the result of reduced total cell num-bers, without affecting differentiation efficiency.
Effects of siRGS2 and siRGS4 on the expression of adipogenic markers
in siCON treated samples at the same time point, after normalization to the expression level of internal control HSP90.
PPARγ upregulation at day 1 (130%, p < 0.05) and C/ EBPα downregulation at day 12 (20%, p < 0.05) compared to siCON (100%) (Fig. 7a, b). However, in siRGS4-10 sam-ples PPARγ expression level overall trended lower while C/EBPα was significantly down regulated at all time points (15–25%, p < 0.05) compared to siCON controls (100%) (Fig. 7a, b). Expression of LPL on the other hand
was significantly down regulated in both siRGS4-8 and siRGS4-10, with 45% at day 5, 77% at day 7 and 23% at day 12 in the former and 18% at day 3, 33% at day 5, 22% at day 7 and 6% at day 12 in the latter samples as com-pared to siCON (100%) (Fig. 7c). Overall, expression of both C/EBPα and LPL were significantly down regulated by siRGS4-10 at multiple time points during adipogenic Fig. 6 Effect of siRGS2 on adipogenic differentiation of hMSCs induced by HI-FBS CM based AIM. Ad-hMSCs were transfected 2 days prior to dif-ferentiation induction with HI-FBS CM based AIM media. a Phase contrast images of OilRedO stained wells at day 12 post adipogenic initiation. Lipid droplets were stained red. b OilRedO staining quantification by absorbance reading at 515 nm. c Representative ImagePro area measurement images showing positively stained oil droplets in black and unstained cells in white. d Area measurement quantification of stained oil droplets. e Total cell count based on DAPI nuclear stain. f Adipocytes cell count and percentage of adipocytes. Images and graphs represent the mean quanti-fication of siRGS4 treatment wells set relative to that of siCON wells from a representative experimental set (n = 3). Comparison was made between
Fig. 7 Effect of siRGS4 and siRGS2 on the expression of adipogenic markers during adipogenic differentiation of hMSCs induced by Hyclone CM based adipogenic media. Expression of PPARγ, C/EBPα and LPL were examined at day 1, 3, 5, 7 and 12 post adipogenic treatment initiation in siCON
and siRGS4 (a–c) or siRGS2 (d–f) transfected AD-hMSCs. Graphs represent average expression level of each gene normalized to that of HSP90 and set relative to its normalized expression in siCON transfected cells. Agarose gels show RT-PCR products of examined genes and HSP90 at indicated time points. a Expression of PPARγ in siRGS4 and siCON transfected cells. b Expression of C/EBPα in siRGS4 and siCON transfected cells. c Expression of LPL
differentiation, whereas only LPL was down regulated by siRGS4-8 at multiple time points, which is consistent with the more disruptive effect of siRGS4-10 on adipo-genic differentiation of hMSCs as compared to siRGS4-8.
In siRGS2 samples, expression level of PPARγ was slightly but significantly lower in siRGS2-2 treatments (84–90%) as compared to siCON (100%) on day 5, 7 and 12, and similar difference between siRGS2-3 and siCON was observed on day 1 and day 12 (Fig. 7e). Expression of C/EBPα was also slightly but significantly downregulated by siRGS2-2 (89%) and siRGS2-3 (77%) on day 3 com-pared to siCON (100%), but remained unchanged at the other time points (Fig. 7f). Expression of LPL was upreg-ulated in siRGS2-2 samples at day 12 (129%, p < 0.05) compared to siCON controls (100%), but was not sig-nificantly changed at the other time points. In siRGS2-3 samples, levels of LPL were slightly but significantly lower at day 3 (83%) and 5 (72%) compared to siCON samples (100%), but remained insignificantly different at the other time points (Fig. 7g). Overall, both siRGS2-2 and siRGS2 -3 had a subtle suppressive effect on the expression of both PPARγ and C/EBPα, and only siRGS2-3 appeared to have a subtle suppressive effect on the expression of LPL, consistent with the overall mild and insignificant effect of siRGS2 on total fat accumulation in Hyclone CM based AIM condition.
Since siRGS2 exerted significant inhibitory effect on adipogenic differentiation of hMSCs induced by HI-FBS CM based AIM, expression of all four adipogenic marker genes was also examined in such condition. Expression of PPARγ was slightly but significantly down regulated by siRGS2-2 at day 3 (76%, p < 0.05) and day 5 (88%, p < 0.05) but not by siRGS2-3 as compared to siCON (100%) (Fig. 8a). C/EBPα expression on the other hand was upregulated in siRGS2-2 treatment groups at day 7 (120%, p < 0.05) and 12 (160%, p < 0.05), but slightly downregulated in siRGS2-3 at day 3 (73%, p < 0.05) compared to siCON (100%) (Fig. 8b). LPL expression was only downregulated by siRGS2-2 (50%, p < 0.05) at day 5 but not by siRGS2-3 compared to siCON (100%) (Fig. 8c). Overall, siRGS2-2 slightly down regulated expression of PPARγ and LPL, but upregulated C/EBPα, whereas siRGS2-3 had minimum effect on the expres-sion of these genes except for transient downregulation of C/EBPα. This is consistent with previous observation that compared to siRGS2-3, siRGS2-2 exerted greater inhibitory effect on adipogenesis induced by HI FBS CM based AIM. In addition, effect of siRGS2-2 on adipogenic gene expression was only slight, consistent with previous observation that siRGS2-2 did not significantly affect dif-ferentiation efficiency determined by percentage of adi-pocytes, and its inhibitory effect on adipogenesis was mainly likely due to reduced adipocytes as the result of
Fig. 8 Effect of siRGS2 on the expression of adipogenic markers during adipogenic differentiation of hMSCs induced by HI FBS CM based adipogenic media. Expression of PPARγ, C/EBPα and LPL were examined at day 1, 3, 5, 7 and 12 post adipogenic treatment initia-tion in siCON and siRGS2 transfected AD-hMSCs. Graphs represent average expression level of each gene normalized to that of HSP90
and set relative to its normalized expression in siCON transfected cells. Agarose gels show RT-PCR products of examined genes and
HSP90 at indicated time points. a Expression of PPARγ in siRGS2 and
siCON transfected cells. b Expression of C/EBPα in siRG2 and siCON
transfected cells. c Expression of LPL in siRGS2 and siCON transfected cells. Error bars represent variation between independent repeats (n = 2). Expression comparison was made between siCON and siRGS2
reduced total cell numbers and possibly reduced fat accu-mulation per adipocyte as well.
In conclusion, consistent with their different levels of inhibitory effect on the adipogenic outcome of hMSCs, siRGS4 exerted significantly greater level of inhibition on the expression of adipogenic marker genes (PPARγ, C/EBPα, and LPL) than siRGS2. In addition, siRGS4-10 downregulated all three genes whereas siRGS4-8 only inhibited LPL, which is also consistent with the more dis-ruptive effect of siRGS4-10 on adipogenic differentiation of hMSCs as compared to siRGS4-8.
Effect of siRGS2 and siRGS4 in osteogenic differentiation of hMSCs
To investigate the potential role of RGS2 and RGS4 dur-ing osteogenic differentiation of hMSCs, we applied the same D-2/D0 siRNA transfection approach. Briefly, even number of ad-hMSCs were reverse transfected with xtremeGENE/siRNA complex at 16.5 nM in Hyclone control (CM) media. After 48 h, osteogenesis was induced by 0.2 μM DEX OIM media, which was subse-quently changed every 48 h. After 18–26 days of OIM media treatment, cells were fixed and stained with aliz-arin red S, which specifically stains for calcific deposit (hydroxylapatite) by osteocytes. Alizarin Red S dye was subsequently extracted with acetic acid and quantified calorimetrically at 405 nm as a measurement of osteo-genic differentiation efficiency (see “Methods”).
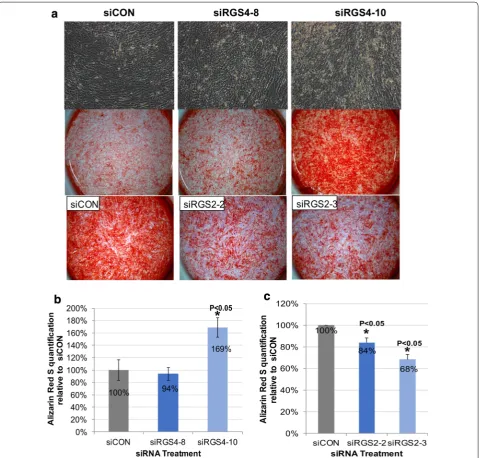
In comparison to siCON treatments, there was increased as well as earlier onset of calcific deposit (day 11) present in siRGS4-10 treatment groups but not so much in siRGS4-8 groups (Fig. 9a, top row), which could also be visually confirmed by increased amount of Aliza-rin Red S stain in siRGS4-10 treatment groups at the end of differentiation (day 18–24) (Fig. 9a, middle row). On the other hand, mineral deposit was decreased in both siRGS2-2 and siRGS2-3 samples compared to siCON groups (Fig. 9a, bottom row). Consistently, Alizarin Red S quantification was significantly higher in siRGS4 -10 treated samples (169%, p < 0.05) (Fig. 9b), but sig-nificantly lower in both siRGS2-2 (84%, p < 0.05) and siRGS2-3 (68%, p < 0.05) treated samples compared to siCON controls (100%) (Fig. 9c). Nuclear count revealed no significant difference between siCON and any siRGS4 or siRGS2 treatment groups (data not shown).
In conclusion, siRGS4 and siRGS2 had opposing effect on osteogenic differentiation of hMSCs, with the former promoting while the latter inhibiting the process, without affecting total cell numbers. In addition, similar to a more disruptive effect of siRGS4-10 on adipogenic differentia-tion of hMSCs as compared to siRGS4-8, the former also demonstrated a greater enhancing effect on osteogenic differentiation of hMSCs compared to the latter.
Effects of siRGS2 and siRGS4 on the expression of osteogenic markers
Since siRGS4 promoted osteogenic differentiation of hMSCs while siRGS2 inhibited it without affecting total cell numbers, it implied a direct effect on osteogenic dif-ferentiation. Effect of siRGS4 and siRGS2 on the tem-poral expression of known osteogenic markers, Runx2, Osteocalcin (OC) and alkaline phosphatase (ALP) was further evaluated. Runx2 is an osteogenic master regula-tor [14]. OC encodes a bone specific protein synthesized by osteoblast and serves as a marker of osteogenic matu-ration [59], while ALP encodes an enzyme that function to promote mineralization by increasing phosphate con-centrations [60, 61]. Since type II/p57 isoform of Runx2 has been shown to be bone specific [62], primers ampli-fying specifically the N-terminal region of the gene that encodes the bone-specific MASNS polypeptide domain was used in analyzing the expression of Runx2.
In siRGS4 OIM treatments, Runx2 expression was upregulated in both siRGS4-8 and siRGS4-10 treated cells as compared to siCON controls starting on D3 post OIM treatment initiation, but the enhancement is clearly much stronger in siRGS4-10 samples, at about 2- to 4-fold higher level than in siRGS4-8 (Fig. 10a), which is consistent with the greater effect of siRGS4-10 on promoting osteogenic differentiation. For expression of OC, no significant dif-ference between siCON and siRGS4-8 or siRGS4-10 sam-ples was observed at any time point analyzed (Fig. 10b). Expression of ALP was also very similar between siRGS4 -8/siRGS4-10 and siCON at all time points, except for day 7, when it was slightly down regulated in siRGS4-8 (84%, p < 0.05) (Fig. 10c). Overall, Runx2 was upregulated by both siRGS4-8 and siRGS4-10, but at much greater level by the latter. ALP appeared to be transiently downregulated by siRGS4-8 but remained unaffected by siRGS4-10.
slight upregulation on later days. Expression of OC was also slightly upregulated by siRGS2-2 or siRGS2-3 at day 3 and 7 or day 14, respectively, following the same trend as ALP expression on those days.
In conclusion, Runx2 was upregulated by both siRGS4 -8 and siRGS4-10 throughout osteogenic differentiation but downregulated by siRGS2-2 and siRGS2-3. RGS4 silencing had no significant effect on the expression of
OC or ALP, while RGS2 silencing transiently downregu-lated ALP expression early on before upregulating it along with OC at later time points.
Discussion
To the best of our knowledge, this is the first study ana-lyzing the expression regulation and function of RGS proteins during human adipogenesis and osteogenesis by Fig. 9 Effect of siRGS4 and siRGS2 on osteogenic differentiation of hMSCs. a Top row: Bright field images showing calcified deposits (yellowish color) in siCON and siRGS4 treatment groups. Middle row: Bright field images showing alizarin red stained cells with calcified deposits in red color in
siCON and siRGS4 treatment groups. Bottom row: Bright field images showing alizarin red stained cells with calcified deposits in red color in siCON
and siRGS2 treatment groups. b Alizarin red S stain quantification in siCON and siRGS4 treatment groups. c Alizarin red S stain quantification in siCON
using hMSCs as an in vitro cellular model. RGS protein family contains over twenty members categorized into four subfamilies (R4/B, RZ/A, R7/C, and R12/D). Both RGS2 and RGS4 belong to the R4/B subfamily, along with RGS1, 3, 5, 8, 13, 16, 18 and 21 [63]. RGS proteins are intracellular proteins possessing GTPase activating protein (GAP) activity, which stimulates GTP hydrolysis of Gα subunit, leading to its re-association with the Gβγ of G proteins and termination of GPCR mediated signal-ing [37]. Both the Gα and the Gβγ dimer can go on to
activate downstream effectors like adenylyl cyclase, phos-pholipase C (PLC-β), RhoA signaling, and ion channels [64, 65]. The duration of an activated GPCR-G protein is defined by the time that the Gα subunit is in its GTP-bound state [66], hence is regulated by the activities of RGS proteins. Gα subunits are subdivided into four sub-groups based on sequence homology and effector selec-tivity: Gαs, Gαi/o, Gαq, Gα12 [67]. These Gα members can either activate or inactivate distinct downstream effec-tors and its selectivity of RGS proteins is dependent on Fig. 10 Effect of siRGS4 and siRGS2 on the expression of osteogenic markers. Expression of Runx2, OC and ALP were examined at day 1, 3, 7 and 14 post osteogenic treatment initiation in siCON and siRGS4 (a–c) or siRGS2 (d–f) transfected AD-hMSCs. Graphs represent average expression level of each gene normalized to that of HSP90 and set relative to its normalized expression in siCON transfected cells. a Expression of Runx2 in siRGS4 and
siCON transfected cells. b Expression of OC in siRGS4 and siCON transfected cells. c Expression of ALP in siRGS4 and siCON transfected cells. d Expres-sion of Runx2 in siRGS2 and siCON transfected cells. e Expression of OC in siRGS2 and siCON transfected cells. f Expression of ALP in siRGS2 and siCON
transfected cells. Error bars represent variation between independent repeats (n = 2). Expression comparison was made between siCON and siRGS
sequence elements within and outside the RGS domain and the helical domain of Gα proteins [68, 69]. RGS2 pos-sesses intrinsic GAP activity that is selective for Gq-class Gα subunits, whereas RGS4 has intrinsic GAP activity for both Gq and Gi/o-class Gα subunits [38, 39]. How-ever, it is poorly understood as to how the specificity of RGS/GPCR coupling is achieved and how different RGS proteins might coordinate with each other in regulating the same biological events. Our study revealed an inter-estingly opposite gene expression pattern of RGS2 and RGS4 in response to adipogenic induction, which initially triggered our interest in further understanding their roles during human adipogenesis.
RGS4 was expressed in high level in hMSCs but was quickly down regulated to near undetectable level within 24 h post adipogenic initiation. Expression knockdown of RGS4 by siRGS4 resulted in significantly reduced total cell numbers, indicating that it normally plays a role in regulating cell proliferation, and possibly a role in hMSCs self-renewal. Interestingly, down regulation of RGS4 also inhibited adipogenic differentiation of hMSCs, indi-cating that it plays a positive role during adipogenesis, which seems to contradict with its down regulation in response to adipogenic induction. One could speculate that its down regulation during the first 3 days of adipo-genic induction might be necessary for hMSCs to exit its ‘stem cell’ mode and prepare for differentiation, how-ever, subsequent adipogenic commitment (day 3 and day 6 post adipogenic initiation) and maturation (after day 6) would benefit from up-regulation of RGS4 expres-sion. Molecular study indeed demonstrated that siRGS4 inhibited the expression of PPARγ and C/EBPα, whose normal upregulation in response to adipogenic induc-tion is concomitant with the onset of adipogenic com-mitment, suggesting that RGS4 expression is beneficial to the upregulation of those two master control genes. It is also possible that the down regulation of RGS4 during normal adipogenic differentiation of hMSCs might have exerted a negative effect throughout and maintaining its high level of expression as in undifferentiated hMSCs could have significantly facilitated the differentiation process. To distinguish the two different scenarios would require additional future study to effectively overexpress RGS4 during adipogenic differentiation. Nevertheless, our observation of the positive role that RGS4 plays dur-ing adipogenesis is consistent with past study of RGS4 knockout mice, which showed a significantly lower body weight compared to wild type mice [53], though in a separate study, the observed weight difference was con-tributed to increased catecholamine secretion in adrenal gland and consequently lipolysis in adipose tissue [54].
On the other hand, expression of RGS2 was very low in hMSCs but escalated to high level within 24 h of
adipogenic initiation, which lasted until day 6 post adipo-genic initiation before subsiding to the same expression level as in hMSCs. Our functional study of RGS2 also demonstrated that it normally played a positive role dur-ing adipogenic differentiation of hMSCs, as its expression knockdown led to decreased differentiation. However, unlike RGS4, knockdown of RGS2 did not appear to exert significant effect on the expression of known adipogenic marker genes including PPARγ, C/EBPα and LPL, sug-gesting that RGS2 might normally regulate adipogenesis through a different route. Nevertheless, the overall effect of siRGS2 on adipogenesis is consistent with past findings from RGS2 knockout mice, which have lower weights, reduced fat deposits, decreased serum lipids, and lower leptin levels [50, 51]. It is interesting to note that there was greater phenotypic suppression on adipogenesis by siRGS2 in HI FBS CM based AIM compared to Hyclone CM based AIM, which corresponded to a greater level of RGS2 expression knockdown by siRGS2 in the former vs. the latter condition. It is possible that expression knock-down is context dependent and may be more effective when the target gene’s overall expression level is lower.
While future studies are needed to understand the molecular mechanisms by which RGS2 and RGS4 might regulate adipogenesis, one could hypothesize a couple of potential mechanisms. Both Gq- and Gi-class Gα proteins can activate Rho (a subfamily of small GTPase proteins including RhoA) regulated signaling pathways involved in cytoskeletal remodeling, cell movement and orga-nelle development [70–72]. RhoA-ROCK signaling plays important role in adipogenic commitment and ROCK inhibitor promotes adipogenesis [71]. Induction of adi-pogenic differentiation leads to disruption of actin stress fibres through downregulation of RhoA-ROCK signal-ing and increased monomeric G-actin and its association with MKL1, a transcriptional coactivator, which prevents the nuclear localization of MKL1 and allows subsequent expression of PPARγ [73]. It is plausible that attenuation of Gαi and/or Gαq activity by RGS4 or RGS2 is important for downregulating RhoA-ROCK signaling and allowing subsequent activation of PPARγ. Additionally, Gi-class Gα proteins can inhibit adenylyl cyclase (AC) activity required for cAMP production. Increased cAMP level as the result of IBMX induction plays a key role in adipogenic com-mitment [17, 74]. By inactivating Gαi, it is conceivable that RGS4 may allow the activation of AC and subsequent intracellular increase of cAMP to promote adipogenesis.
RGS12 and RGS10 impairs it [48, 75, 76]. However no study thus far has examined the role of RGS in osteogen-esis, though several GPCRs like parathyroid hormone 1 receptor (PTH1R), frizzled (Fz), and calcium sensing receptor (CaSR), which play important roles in osteoblast differentiation and function, are expressed in osteoblast and regulated by RGS proteins [49]. Activated PTH1R triggers the activation of Gαq-PLC and Gαs-AC signaling [77, 78]. Gq-class Gα proteins can activate the phospho-lipase C-β (PLC-β) pathway that leads to the cleavage of phosphatidylinosiatol 4,5-biphosphate (PIP2) into inositol triphosphate (IP3) and diacylglycerol (DAG), and regu-late intracellular Ca2+ release as well as protein kinase C
(PKC) activity [77, 79]. CaSR acts as a calcium detector of extracellular Ca2+ and functions to maintain intracellular
Ca2+ homeostasis through the G
αq/11 pathway [80]. Friz-zled receptors are activated by Wnt ligands, which triggers at least three distinct intracellular signaling cascades: beta-catenin pathway (canonical), Ca2+ pathway (noncanonical)
and planar polarity pathway. All three pathways are impli-cated in bone formation [81, 82], with the canonical path-way leading to the expression of osteoblast-specific gene marker [83], Ca2+ pathway leading to intracellular Ca2+
increase [84], and the planar polarity pathway leading to the activation of Rho/Rac GTPases and cytoskeletal reor-ganization [85]. We demonstrated for the first time that RGS2 and RGS4 play apposing roles during osteogenic differentiation of hMSCs, with RGS4 as a negative regula-tor and RGS2 as a positive regularegula-tor. Their role was partly mediated by modulating the expression of known osteo-genic regulator Runx2. However, it is also possible that the effect brought on by siRGS2 and siRGS4 was mediated through modulating the Gα protein activities downstream of the above mentioned GPCR mediated signals and potentially others as well to regulate the differentiation and maturation of osteoblasts. It is also interesting to note that the uncovered roles of RGS4 and RGS2 during osteogen-esis concur with their expression pattern during normal osteogenic differentiation, with RGS4 downregulated and RGS2 upregulated upon osteogenic initiation. Our study demonstrates that RGS proteins are important regulators of bone remodeling by regulating not only osteoclastogen-esis but also osteogenosteoclastogen-esis.
Lastly, it is interesting to point out that unlike RGS2, which demonstrated a clear correlation between its mRNA expression level and protein expression level in response to siRGS2 transfection, down regulation of RGS4 appeared much delayed and weaker at the pro-tein level as compared to the mRNA level in response to siRGS4 transfection. This implies different expres-sion regulation kinetics between RGS2 and RGS4, with the latter likely having long half-life that could mask the effect of total reduced RGS4 transcripts. It is also possible
that there might be unknown post-transcriptional regu-lation that hinders the progress of transregu-lation or post-translational protein modifications that might render the RGS4 antibodies used incapable of recognizing modified forms of RGS4, obscuring the actual total protein level. Poor correlation between expression levels of mRNA and protein level has been well documented [86–88], although in very few cases, the precise mechanisms have been investigated. This differential expression regulation of RGS2 and RGS4 adds another dynamic to the com-plexity of their roles during adipogenic and osteogenic differentiation of hMSCs.
GPCRs compose the largest family of membrane recep-tors and as a result, they are also the most widely targeted membrane proteins, with estimated 40% of clinical drugs targeting this system. As downstream regulators of these proteins, RGS proteins are likely to play essential roles dur-ing a wide range of developmental processes as well. Dur-ing normal development, hMSCs residDur-ing in the adipose tissue as well as in the bone marrow would respond to dif-ferent external stimuli by self-renewing or undergoing adi-pogenic or osteogenic differentiation. Some of these signals are mediated through the GPCR proteins. It is conceiv-able that RGS proteins might serve as factors of a feedback regulatory loop, in which that active differentiation would lead to expression change in these proteins such as RGS2 and RGS4, which in return would modulate the activity of their respective GPCR proteins in order to help attenuate/ augment the cells’ further response to the external stimuli. How these proteins achieve regulatory specificity with dif-ferent GPCRs and how they may interact with each other to fine tune specific biological event would be of great interest for future studies, as they are potentially druggable molecu-lar targets for treating various physiological diseases.
Conclusions
have significant effect on the expression of examined adi-pogenic markers including C/EBPα and LPL; and lastly, (V) expression knock-down of RGS2 and RGS4 resulted in decreased and increased osteogenic differentiation respectively, indicating that RGS2 is normally a positive regulator while RGS4 is a negative regulator during oste-ogenesis. Our study demonstrates for the first time that RGS2 and RGS4 are inversely regulated during human adipogenesis even though they both play positive roles, and on the other hand, both genes were also inversely regulated during early human osteogenesis (first 48 h) but play opposing roles. This implies that members of RGS proteins may play multifaceted roles during human adipogenesis and osteogenesis to balance or counterbal-ance each other’s function during those processes.
Methods Cell culture
Human adipose-derived mesenchymal stem cells (ad-hMSCs; Fisher Scientific, cat# SV3010201) were cultured using Hyclone Advance STEM Mesenchymal Expansion Kit (Complete Media, Hyclone CM; Fisher Scientific, cat# SH30875KT) and grown and cultured in a 5% CO2 incubator at 37 °C. Cells were expanded at 1:5 splitting ratio using 0.05% trypsin–EDTA (Corning, cat# 25-02) and used at passage 4 for all assays.
Clonogenicity assay
hMSCs at P4 passage were plated at 100 cells per 10-cm plate or 96 cells per 96-well plate (1 cell/well) and cultured continuously for 21 days, with media change every 3 days. Cells were then rinsed with PBS after medium removal and stained with 0.5% crystal violet (Sigma Aldrich, cat# 6158) dissolved in 20% methanol for 30 min at room Tem-perature (RT). Colonies containing in excess of 50 cells were counted using a Leica dissecting microscope.
Immunostaining
hMSCs at P4 passage were fixed with 4% paraformaldehyde for 10 min, rinsed three times with PBS, permeated with 0.25% Triton X-100 in PBS for 10 min at RT, washed four times with PBS, 5 min each with gentle shaking, blocked with 1% BSA in PBS for 1 h at RT, incubated with primary antibodies diluted in blocking solution overnight at 4 °C, fol-lowed by incubation with secondary antibodies also diluted in blocking solution for 1 h at RT. Images were obtained using Olympus IX50 fluorescence microscope. Primary antibody against CD73 (dilution 1:5) and CD105 (dilution 1:12.5) were from Thermofisher (cat# 41-0200 and PA5-16895 respectively). Goat anti-mouse Alexa Fluor Plus 488 secondary antibody was from Thermofisher (cat# A32723) (dilution 1:500) and Donkey anti-Rabbit FITC secondary antibody (dilution 1:500) was from R&D (cat# 711-095-152).
Flow cytometry
Detailed procedure can be found in our previously pub-lished study [89]. Briefly, hMSCs at P4 passage were col-lected and centrifuged at 1000 rpm for five minutes. The pellet was resuspended in 3 ml/well wash buffer (98% PBS + 2% Fetal Calf Serum) and counted with
Coun-tess Automated Cell Counter (C10227, Life Technolo-gies). About 4.5 × 10⁵ cells in 100 μl were aliquoted into
each FACS tube (coated with 1% BSA overnight at 4 °C prior), and 5 μl of each labeled primary antibody was added in each tube for staining for 30 min at 4 °C. Cells were stained with FITC anti-human CD90 (cat# 328107, Biolegend) alone, Pacific Blue anti-human CD73 (cat# 344011, Biolegend) alone, or both together for 30 min at 4 °C. FITC Mouse IgG1 (cat# 400109, Biolegend) was used as isotype controls. Unstained hMSCs were also used as negative controls. Cells were then fixed with 2% paraformaldehyde for 30 min at RT, washed with PBS once before flow cytometry analysis. Flow etry data was acquired through a Gallios flow cytom-eter (Beckman Coulter) at the City of Hope Analytical cytometry core and analyzed using the FlowJo software by Tree Star Inc.
Cellular differentiation conditions
SiRNA reverse transfections
Two transfection methodologies, referred to as reverse and forward transfection, were examined to opti-mize transfection efficiency. Forward transfection was achieved by equal plating of cells into culture vessel fol-lowed by introduction of siRNA-transfection agent com-plex at designed time point. Reverse transfection was achieved by introduction of siRNA-transfection reagent complex to culture vessel followed by equal plating of cells. Lyophilized siRNA at 1 nmol quantity was sus-pended in 100 µl of RNAase-free water obtaining a stock concentration of 10 µM, which was further diluted to 2 µM working stock (1 μl of 2 µM siRNA is equivalent to about 28 ng of siRNA). Transfection was done in 24-well plates. In reverse transfection, for each individual well, siRNA-transfection reagent complexes were prepared by adding 2.24 μl xtremeGENE siRNA transfection reagent (Roche, cat# 04476093001) into a tube containing 224 μl MEM basal media (Corning, cat# 10-022-CV), followed by the addition of 1.6 μl of 2 µM siRNA within 5 min. The complex was incubated for 25–30 min inside a cell cul-ture hood at room temperacul-ture before transferring to a designated well. A total of 64,000 cells in 640 μl of growth media would be added to the mixture, followed by 24-h incubation in CO2 incubator before the media was exchanged for Hyclone CM growth media. The cells were further incubated for 24 h before subjecting to adipo-genic or osteoadipo-genic differentiation induction. The follow-ing siRNA were used in this study: siCON: AllStars Neg. siRNA (Qiagen, cat# 1027284); siRGS2-2: Hs_RGS2_2 (Qiagen, cat# SI00045773); siRGS2-3: Hs_RGS2_3 (Qia-gen, cat# SI00045780); siRGS4-8: Hs_RG4_8 (Qiagen, cat# SI03028018); and siRGS4-10: Hs_RG4_10 (Qiagen, cat# SI03097766).
DAPI staining and total cell count
Nuclear staining was achieved using DAPI (4′ ,6-diami-dino-2-phenylindole) nucleic acid stain (Sigma, cat# 108K4024). A working solution was prepared by dilut-ing 1:3000 of a 14.3 mM DAPI stock in 1× PBS. Briefly,
cells were fixed with 10% buffered formalin phosphate, washed three times with distilled water, and stained with the diluted DAPI solution for 30 min at room tempera-ture. Cultures were then washed three times with dis-tilled water and images were acquired using Olympus IX50 fluorescence microscope (7 images per well at 100×
magnification were taken). Nuclear counts of each image were done using CellProfiler Image Analysis Software [90].
Alizarin red staining and quantification
Mature osteocytes secrete calcium phosphate were detected 18–24 days after osteogenic induction using a
2% Alizarin Red S Staining solution (Acros Organic, cat# 130-22-3) (pH 4.1–4.3 adjusted with 0.5% Ammonium hydroxide). Cells were first fixed by 10% formalin-PBS, rinsed twice with water, incubated with Alizarin Red S solution for 10 min, washed four times with distilled water with 5 min intervals between wash, and air dried for later imaging and quantification. For quantification, a modified manufacturer’s protocol of an osteogenesis quantitation kit (Millipore, ECM815) was used. Briefly, dried stained cultures were incubated with 10% acetic acid for 20 min at room temperate. The loosely attached monolayer was then scrapped and total well content was transferred to microcentrifuge tubes. The mixtures were vortexed vigorously, parafilmed, and incubated at 85 °C for 10 min, followed by incubation on ice for 5 min and subsequent centrifugation at 20,000×g for 15 min. Super-natant was then transferred to a new microcentrifuge tube. Optical densities of solutions were measured at 405 and 690 nm in an ELx800 96 well plate reader (BioTek).
Oil‑Red‑O staining and quantification
Lipid droplets in mature adipocytes can be identified using Oil-Red-O staining solution. After fixing with 10% buffered formalin phosphate (Fisher Scientific, cat# SF100-4), cells were incubated with 100% propylene gly-col (Amresco, cat# 0575) for 5 min at room temperature, followed by its removal and staining with Whatman fil-ter paper-filfil-tered Oil Red O solution (Electron Micros-copy Sciences, cat# 36609-01) for 30 min to 2 h with gentle rocking. Next, staining solution was removed and cells were incubated with 85% propylene glycol (Fisher Scientific, cat# A426P) for 5 min, followed by rinsing in distilled water three times. Stained cells would remain covered in distilled water, parafilmed and stored at 4 °C refrigerator. Whole-well images were taken using a Leica dissection microscope. For Oil-Red-O staining quan-tification, cells samples were air dried overnight after removing water and Oil-Red-O stain was extracted using 150 μl/well (24-well plate) 100% isopropyl alcohol for 1 min. Optical density readings for extracted stain solu-tion were measured at 510 and 690 nm in an ELx800 96 well plate reader (BioTek).
Adipocyte cell counts and area measurements of stained oil droplets
To determine total adipocyte and total cell counts, wells were imaged using an Olympus IX50 microscope at 100×