Software for quantitative trait analysis
Laura Almasy* and Diane M. Warren
Department of Genetics, Southwest Foundation for Biomedical Research, San Antonio, TX 78245-0549, USA *Correspondence to: Tel:þ1 210 258 9400; Fax:þ1 210 258 9444; E-mail: [email protected]
Date received (in revised form): 20th May 2005
Abstract
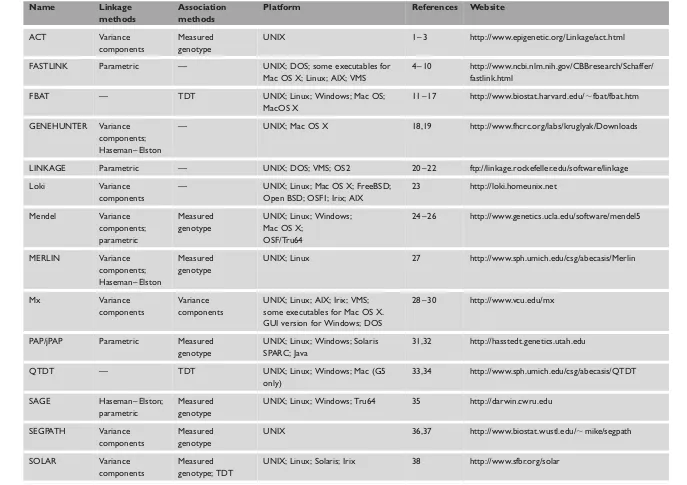
This paper provides a brief overview of software currently available for the genetic analysis of quantitative traits in humans. Programs that implement variance components, Markov Chain Monte Carlo (MCMC), Haseman – Elston (H – E) and penetrance model-based linkage analyses are discussed, as are programs for measured genotype association analyses and quantitative trait transmission disequilibrium tests. The software compared includes LINKAGE, FASTLINK, PAP, SOLAR, SEGPATH, ACT, Mx, MERLIN, GENEHUNTER, Loki, Mendel, SAGE, QTDT and FBAT. Where possible, the paper provides URLs for acquiring these programs through the internet, details of the platforms for which the software is available and the types of analyses performed.
Keywords:linkage analysis, association, QTL, software
Introduction
Localisation and characterisation of quantitative trait loci (QTLs) and causal polymorphisms influencing complex phenotypes are of major importance in statistical genetic analyses. Important steps in this process are linkage analyses of QTLs and association studies correlating phenotypes and genotypes. These investigations have been greatly facilitated by the development of a variety of computer software allowing for the fast and efficient analysis of quantitative traits.
This paper surveys software programs currently available for quantitative trait analysis. Given the rapid development of new programs, as well as the inevitable obsolescence of others, the focus here is necessarily limited to the software most widely used in the analysis of quantitative traits in humans. Also beyond the scope of this review are programs commonly used in studies of non-human model organisms and in species of agricultural importance, but designed primarily for the analysis of inbred, F2, half-sib and other specialised pedigrees.
The text of this paper has been organised by method, and is broadly divided into linkage methods and association methods. The linkage methods are further divided into parametric model-based, variance components and Hasemen – Elston (H – E) methods. The association methods are categorised into measured genotype and transmission disequilibrium-based methods. Table 1 lists all of the software discussed in this paper and provides details regarding the methods implemented, the platforms for which software is available and a link to an online site for the program. The text provides a way to survey the available offerings by methodological approach, and Table 1 a way to search by program name. All of the programs discussed are
freely available over the internet, with the exception of SAGE, for which there is a charge.
Linkage
The most commonly used methods for quantitative trait linkage analysis in humans are the variance components and H – E approaches. It is also possible to use parametric, model-based methods for quantitative trait linkage analysis. These require the specification of allele frequencies at the trait locus and genotype-specific trait means. The LINKAGE,
FASTLINK, Mendel, PAP and SAGE packages can be used for model-based linkage and joint segregation-linkage analysis of quantitative traits. As with analyses of discrete disease traits using these programs, large and complex family structures are easily accommodated, but computing time for multipoint linkage analyses is exponential with the number of genotyped markers analysed, due to the use of the Elston – Stewart algorithm.39A new Java-based jPAP is now available, although some of the functions of the original PAP have yet to be implemented in it.
At their simplest, variance components approaches model the covariance among family members as a function of unspecified aggregate additive genetic effects, effects due to a hypothetical gene in the region being tested for linkage, and a residual component that is uncorrelated among individuals and is sometimes described as an environmental component.1,38,40 Most variance component programs use maximum likelihood methods to estimate these components of variance. It is possible to add numerous complexities onto
SOFTWARE REVIEW
Table 1. Software discussed in this paper.
Name Linkage
methods
Association methods
Platform References Website
ACT Variance components
Measured genotype
UNIX 1 – 3 http://www.epigenetic.org/Linkage/act.html
FASTLINK Parametric — UNIX; DOS; some executables for Mac OS X; Linux; AIX; VMS
4 – 10 http://www.ncbi.nlm.nih.gov/CBBresearch/Schaffer/ fastlink.html
FBAT — TDT UNIX; Linux; Windows; Mac OS;
MacOS X
11 – 17 http://www.biostat.harvard.edu/,fbat/fbat.htm
GENEHUNTER Variance components; Haseman – Elston
— UNIX; Mac OS X 18,19 http://www.fhcrc.org/labs/kruglyak/Downloads
LINKAGE Parametric — UNIX; DOS; VMS; OS2 20 – 22 ftp://linkage.rockefeller.edu/software/linkage
Loki Variance components
— UNIX; Linux; Mac OS X; FreeBSD; Open BSD; OSF1; Irix; AIX
23 http://loki.homeunix.net
Mendel Variance components; parametric
Measured genotype
UNIX; Linux; Windows; Mac OS X;
OSF/Tru64
24 – 26 http://www.genetics.ucla.edu/software/mendel5
MERLIN Variance components; Haseman – Elston
Measured genotype
UNIX; Linux 27 http://www.sph.umich.edu/csg/abecasis/Merlin
Mx Variance
components
Variance components
UNIX; Linux; AIX; Irix; VMS; some executables for Mac OS X. GUI version for Windows; DOS
28 – 30 http://www.vcu.edu/mx
PAP/jPAP Parametric Measured genotype
UNIX; Linux; Windows; Solaris SPARC; Java
31,32 http://hasstedt.genetics.utah.edu
QTDT — TDT UNIX; Linux; Windows; Mac (G5
only)
33,34 http://www.sph.umich.edu/csg/abecasis/QTDT
SAGE Haseman – Elston; parametric
Measured genotype
UNIX; Linux; Windows; Tru64 35 http://darwin.cwru.edu
SEGPATH Variance components
Measured genotype
UNIX 36,37 http://www.biostat.wustl.edu/,mike/segpath
SOLAR Variance Measured UNIX; Linux; Solaris; Irix 38 http://www.sfbr.org/solar
Alma
sy
and
W
Revie
w
E
REVI
EW
q
HE
NR
Y
S
TEW
A
R
T
P
U
BLIC
A
T
IONS
147
9
–
7
364
.
HU
MAN
G
E
N
OMI
C
S
.
V
OL
2.
NO
3.
191–195
SEPTEMBER
2
005
variance component linkage models, including dominance genetic effects, epistatic interactions, gene – environment interactions, shared environment correlations, spouse corre-lations, corrections for non-normality of the trait distribution, estimation of empirical p-values, estimation of linkage power for a given study and multivariate models. Different programs provide automated routines for different subsets of these variance component extensions. GENEHUNTER automates the inclusion of dominance components. SOLAR has an epistasis option in its oligogenic multipoint linkage routine. SEGPATH makes it very easy to include a spouse correlation. SEGPATH, SOLAR, Mendel and ACT allow multivariate linkage analysis, in which the correlations between genetic and environmental components for multiple traits can be estimated. Mx has specialised routines for the analysis of twin data — its original function — although it has now been expanded to accommodate nuclear families.
The MCMC-based approach implemented in Loki also estimates the variance due to a QTL, but adds the number of QTLs influencing the trait and their allele frequencies.23This model is easily expanded to incorporate dominance effects, epistatic and gene – environment interactions and other, more complex models. Whereas most QTL linkage routines provide an LOD (logarithm of odds) score as a measure of the evi-dence in favour of a trait-influencing locus in the region being tested, Loki reports a posterior probability of there being a QTL in the region.
One of the greatest differences between specific
implementations of the variance component linkage method is the source of the multipoint identity by descent (IBD) matrices that are used to estimate QTL-specific variance in a linkage analysis. GENEHUNTER and MERLIN use a Lander-Green algorithm,41for which computing time becames exponential with the numbers of non-founders in a pedigree. Generally, families larger than 20 or 25 individuals cannot be analysed in these programs without breaking up the pedigrees into smaller units. By using a sparse binary tree, as opposed to a full binary tree, MERLIN is able to accommodate larger families than GENEHUNTER. Mendel uses either the Elston – Stewart or the Lander – Green algorithm, depending on pedigree size. SOLAR uses an extension of the Fulker – Cardon interval approach to estimating multipoint IBDs.38,42This allows both pedigrees of unlimited complexity and an unlimited number of genotyped markers. Whereas this approximation performs well for markers that are individually quite informative (such as short tandem repeats), however, it is not suitable for marker sets in which the markers are individually less informative (such as single nucleotide polymorphisms). Markov Chain Mounte Carlo (MCMC) methods are used to estimate IBDs in Loki. These methods are also approximate, but are more precise than the Fulker – Cardon interval approach. Compu-tation time for MCMC IBD estimation is linear in both the number of markers and the size of pedigree, making it suitable for use with large complex pedigrees and unlimited numbers
of markers. It is more computationally intensive than the interval approach, however, and may require weeks of com-puting time in the case of pedigrees of 100 individuals or more. A number of programs (SOLAR, ACT, SEGPATH and SAGE) are set up to use IBD matrices that are generated once per study and then stored, making it possible to import IBD matrices from a variety of sources if they are converted to the proper program-specific format.
Because a model with no QTL effects, with all genetic effects in an unspecified aggregate genetic component, forms the basis of comparison for the likelihood ratio test of linkage, most variance components programs also provide an overall estimate of the trait heritability.
The H – E linkage method, at its most basic, models the squared difference in siblings’ trait values as a function of their IBD allele sharing at a particular chromosomal location.43 There have been a wide variety of extensions to the general H – E method. The ‘revisited’ H – E uses the mean corrected cross-product of the siblings’ trait values.44This was found to be less powerful than the original H – E in some cases,45which led to the development of a variety of ‘weighted’ H – E tests using functions of the original and revisited H – E.46,47Most recently, the H – E model has been extended to model the full variance – covariance matrix within a family.48This latest version of the H – E is very similar to a variance component approach, the primary difference being that the various components are generally estimated by regression rather than maximum likelihood. Regression approaches should be computationally more efficient, whereas maximum likelihood approaches are, in theory, more powerful, although this difference is likely to be negligible in practice. Regression-based approaches may also be more robust to non-normality of the trait distribution. As with a variance components approach, the latest version of the H – E, in which the full variance – covariance matrix is modelled, is easily extended to include epistatic interactions, gene-environment interactions and so on. The original H – E linkage approach is
implemented in SAGE and GENEHUNTER. The latest expansion of the H – E is also available in SAGE. The MERLIN REGRESS routine implements an H – E extension developed by Sham et al.49that uses squared trait sums and differences between relative pairs.
Association
The commonly used association methods for quantitative traits generally fall into two main categories: measured genotype approaches and transmission disequilibrium approaches. The measured genotype approach40,50 is a fixed-effects model in which genotype-specific trait means are estimated. An additive model, in which the heterozygote trait mean is constrained to be halfway between the means of the two homozygotes, provides a single degree of freedom test. This can be
Software for quantitative trait analysis SOFTWARE REVIEWReview
implemented through a covariate that takes the values of21 andþ1 for opposing homozygotes and 0 for heterozygotes. Thus, any quantitative trait program that permits the use of covariates can be used to test a measured genotype model. These include PAP, ACT, SEGPATH, SOLAR, SAGE, Mendel and MERLIN. Non-additive models are also easily investigated through the use of different codings of the covariate. Similar analyses could be carried out with any regression program, of course, but the packages listed above have the advantage of dealing with non-independence among family members. Any standard regression routine in a statistics package would be appropriate for measured genotype analyses in unrelated individuals but would provide incorrectpvalues in the case of family data. In general, linkage programs that permit the use of covariates can be used to perform linkage analyses conditional on measured genotype as a way of testing the contribution of an associated marker to a linkage signal.51
Note that measured genotype analyses are susceptible to population stratification. That is, if there are subgroups in the data that have different trait means, any marker that differs in allele frequency between those subgroups may show associ-ation, regardless of whether or not it is in linkage disequili-brium with a QTL. Such population substructure can be detected through analyses of unlinked markers by programs such as Structure.52
Transmission disequilibrium-based tests (TDT) were originally developed to provide a test for discrete trait association in the presence of linkage that was robust to population stratification.53,54The TDT has been expanded to accommodate quantitative traits in a variety of ways.55 – 57 Essentially, the quantitative trait TDT methods test whether the trait mean in offspring differs according to whether a particular allele was or was not transmitted by a parent het-erozygous for that allele. The various methods differ by whether they require assumptions regarding the trait distri-bution and by the size of the families they can accommodate, from parent – child trios to arbitrary pedigrees. TDT analyses in FBAT require no assumptions regarding the trait distri-bution and are performed in nuclear families. Larger pedigrees can be used, but they will be decomposed into nuclear families for analysis and an empirical estimate of the variance of the test statistic will be used to account for the non-independence between nuclear families. The program QTDT33implements a variety of quantitative trait TDT tests, including those described by Allison55and by Rabinowitz.56SOLAR has an extended pedigree-compatible TDT. The gamete competition model58is a generalisation of the quantitative trait TDT that is applicable to general pedigrees, implemented in Mendel.
Conclusions
No review of this type can be completely comprehensive. The programs outlined above all have additional capabilities and
unique subroutines that could not be detailed here. Many of these programs are still under active development, with new features being added all the time. Hopefully, this paper will have provided enough information about each program that the reader will be able to discern which ones are appropriate for their needs and merit further investigation through the internet links and references provided in Table 1. Of course, Table 1 itself is not a complete catalogue of the available software, although the most widely used packages have been included. There are many more quantitative trait analysis programs than can be feasibly discussed within a single brief paper, and there are new programs appearing constantly. There are several websites that maintain general lists of genetic analysis software; perhaps the most comprehensive of these is the genetic analysis software list started by Wentian Li at Columbia University which is now maintained at: http://www.nslij-genetics.org/soft/ with a mirror site at: http://linkage.rockefeller.edu/soft.
Acknowledgments
Preparation of this manuscript was supported in part by NIH grants MH59490, AA08403, HL70751 and MH61622. We are grateful to John Blangero and Thomas Dyer for their helpful comments and suggestions.
References
1. Amos, C.I. (1994), ‘Robust variance-components approach for assessing genetic linkage in pedigrees’,Am. J. Hum. Genet.Vol. 54, pp. 535 – 543. 2. Amos, C.I., Zhu, D.K. and Boerwinkle, E. (1996), ‘Assessing genetic
linkage and association with robust components of variance approaches’, Ann. Hum. Genet.Vol. 60, pp. 143 – 160.
3. de Andrade, M., Amos, C.I. and Thiel, T.J. (1999), ‘Methods to estimate genetic components of variance for quantitative traits in family studies’, Genet. Epidemiol.Vol. 17, pp. 64 – 76.
4. Cottingham, Jr., R.W., Idury, R.M. and Schaffer, A.A. (1993), ‘Faster sequential genetic linkage computations’,Am. J. Hum. Genet.Vol. 53, pp. 252 – 263.
5. Schaffer, A.A., Gupta, S.K., Shriram, K. and Cottingham, Jr., R.W. (1994), ‘Avoiding recomputation in linkage analysis’,Hum. Hered.Vol. 44, pp. 225 – 237.
6. Schaffer, A.A. (1996), ‘Faster linkage analysis computations for pedigrees with loops or unused alleles’,Hum. Hered.Vol. 46, pp. 226 – 235. 7. Dwarkadas, S., Schaffer, A.A., Cottingham, Jr., R.W.et al.(1994),
‘Parallelization of general-linkage analysis problems’,Hum. Hered.Vol. 44, pp. 127 – 141.
8. Gupta, S.K., Schaffer, A.A., Cox, A.L.et al.(1995), ‘Integrating parallelization strategies for linkage analysis’,Comput. Biomed. Res.Vol. 28, pp. 116 – 139.
9. Becker, A., Bar-Yehuda, R. and Geiger, D. (1999), ‘Random algorithms for the loop cutset problem’, in Laskey, K.B., Prade, H. (Eds),Proceedings of the Fifteenth Conference on Uncertainty in Artificial Intelligence, Stockholm, Sweden, July 30 – August 1, 1999, Morgan Kaufmann, San Francisco, CA, pp. 49 – 56.
10. Becker, A., Geiger, D. and Schaffer, A.A. (1998), ‘Automatic selection of loop breakers for genetic linkage analysis’,Hum. Hered.Vol. 48, pp. 49 – 60. 11. Rabinowitz, D. and Laird, N. (2000), ‘A unified approach to adjusting
12. Laird, N.M., Horvath, S. and Xu, X. (2000), ‘Implementing a unified approach to family-based tests of association’,Genet. Epidemiol.Vol. 19 (Suppl. 1), pp. S36 – S42.
13. Horvath, S., Xu, X., Lake, S.L.et al.(2004), ‘Family-based tests for associating haplotypes with general phenotype data: Application to asthma genetics’,Genet. Epidemiol.Vol. 26, pp. 61 – 69.
14. Horvath, S., Xu, X. and Laird, N.M. (2001), ‘The family based association test method: Strategies for studying general genotype – phenotype associ-ations’,Eur. J. Hum. Genet.Vol. 9, pp. 301 – 306.
15. Lake, S.L., Blacker, D. and Laird, N.M. (2000), ‘Family-based tests of association in the presence of linkage’,Am. J. Hum. Genet.Vol. 67, pp. 1515 – 1525.
16. Lange, C., Silverman, E.K., Xu, X.et al.(2003), ‘A multivariate family-based association test using generalized estimating equations: FBAT-GEE’, BiostatisticsVol. 4, pp. 195 – 206.
17. Lunetta, K.L., Faraone, S.V., Biederman, J. and Laird, N.M. (2000), ‘Family-based tests of association and linkage that use unaffected sibs, covariates, and interactions’,Am. J. Hum. Genet.Vol. 66, pp. 605 – 614. 18. Kruglyak, L., Daly, M.J., Reeve-Daly, M.P. and Lander, E.S. (1996),
‘Parametric and nonparametric linkage analysis: A unified multipoint approach’,Am. J. Hum. Genet.Vol. 58, pp. 1347 – 1363.
19. Kruglyak, L. and Lander, E.S. (1998), ‘Faster multipoint linkage analysis using Fourier transforms’,J. Comput. Biol.Vol. 5, pp. 1 – 7.
20. Lathrop, G.M., Lalouel, J.M., Julier, C. and Ott, J. (1984), ‘Strategies for multilocus linkage analysis in humans’,Proc. Natl. Acad. Sci. USAVol. 81, pp. 3443 – 3446.
21. Lathrop, G.M. and Lalouel, J.M. (1984), ‘Easy calculations of lod scores and genetic risks on small computers’,Am. J. Hum. Genet.Vol. 36, pp. 460 – 465.
22. Lathrop, G.M., Lalouel, J.M. and White, R.L. (1986), ‘Construction of human linkage maps: Likelihood calculations for multilocus linkage analysis’,Genet. Epidemiol.Vol. 3, pp. 39 – 52.
23. Heath, S.C. (1997), ‘Markov chain Monte Carlo segregation and linkage analysis for oligogenic models’,Am. J. Hum. Genet.Vol. 61, pp. 748 – 760.
24. Lange, K., Weeks, D. and Boehnke, M. (1988), ‘Programs for pedigree analysis: MENDEL, FISHER, and dGENE’,Genet. Epidemiol.Vol. 5, pp. 471 – 472.
25. Stringham, H.M. and Boehnke, M. (1996), ‘Identifying marker typing incompatibilities in linkage analysis’,Am. J. Hum. Genet.Vol. 59, pp. 946 – 950.
26. Lange, K., Cantor, R., Horvath, S.et al.(2001), ‘Mendel version 4.0: A complete package for the exact genetic analysis of discrete traits in pedigree and population data sets’,Am. J. Hum. Genet.Vol. 69 (Suppl.) p. 504.
27. Abecasis, G.R., Cherny, S.S., Cookson, W.O. and Cardon, L.R. (2002), ‘Merlin — Rapid analysis of dense genetic maps using sparse gene flow trees’,Nat. Genet.Vol. 30, pp. 97 – 101.
28. Neale, M.C. (2000), ‘The use of Mx for association and linkage analysis’, GeneScreenVol. 1, pp. 107 – 111.
29. Neale, M.C., Boker, S.M., Xie, G. and Maes, H.H. (2003),Mx: Statistical Modeling, 6th Edns, Department of Psychiatry, VCU, Richmond, VA. 30. Posthuma, D., de Geus, E.J., Boomsma, D.I. and Neale, M.C. (2004), ‘Combined linkage and association tests in Mx’,Behav. Genet.Vol. 34, pp. 179 – 196.
31. Hasstedt, S.J. (2002), ‘Pedigree Analysis Package’, 5th Edns, Department of Genetics, University of Utah, Salt Lake City, UT.
32. Hasstedt, S.J. (2004),jPAP — Pedigree Analysis Package for Java, Department of Genetics, University of Utah, Salt Lake City, UT. 33. Abecasis, G.R., Cardon, L.R. and Cookson, W.O. (2000), ‘A general
test of association for quantitative traits in nuclear families’,Am. J. Hum. Genet.Vol. 66, pp. 279 – 292.
34. Abecasis, G.R., Cookson, W.O. and Cardon, L.R. (2000), ‘Pedigree tests of transmission disequilibrium’,Eur. J. Hum. Genet.Vol. 8, pp. 545 – 551.
35. S.A.G.E. (2004),Statistical Analysis for Genetic Epidemiology— computer program package available from Statistical Solutions Ltd, Cork, Ireland.
36. Province, M.A. and Rao, D.C. (1995), ‘General purpose model and a computer program for combined segregation and path analysis (SEGPATH): Automatically creating computer programs from symbolic language model specifications’,Genet. Epidemiol.Vol. 12,
pp. 203 – 219.
37. Province, M.A., Rice, T.K., Borecki, I.B.et al.(2003), ‘Multivariate and multilocus variance components method, based on structural relationships to assess quantitative trait linkage via SEGPATH’, Genet. Epidemiol.Vol. 24, pp. 128 – 138.
38. Almasy, L. and Blangero, J. (1998), ‘Multipoint quantitative-trait linkage analysis in general pedigrees’,Am. J. Hum. Genet.Vol. 62, pp. 1198 – 1211. 39. Elston, R.C. and Stewart, J. (1971), ‘A general model for the genetic
analysis of pedigree data’,Hum. Hered.Vol. 21, pp. 523 – 542. 40. Hopper, J.L. and Mathews, J.D. (1982), ‘Extensions to multivariate
normal models for pedigree analysis’,Ann. Hum. Genet.Vol. 46, pp. 373 – 383.
41. Lander, E.S. and Green, P. (1987), ‘Construction of multilocus genetic linkage maps in humans’,Proc. Natl. Acad. Sci. USAVol. 84, pp. 2363 – 2367.
42. Fulker, D.W. and Cardon, L.R. (1994), ‘A sib-pair approach to interval mapping of quantitative trait loci’,Am. J. Hum. Genet.Vol. 54, pp. 1092 – 1103.
43. Haseman, J.K. and Elston, R.C. (1972), ‘The investigation of linkage between a quantitative trait and a marker locus’,Behav. Genet.Vol. 2, pp. 3 – 19.
44. Elston, R.C., Buxbaum, S., Jacobs, K.B. and Olson, J.M. (2000), ‘Haseman and Elston revisited’,Genet. Epidemiol.Vol. 19, pp. 1 – 17. 45. Palmer, L.J., Jacobs, K.B. and Elston, R.C. (2000), ‘Haseman and Elston
revisited: The effects of ascertainment and residual familial correlations on power to detect linkage’,Genet. Epidemiol.Vol. 19,
pp. 456 – 460.
46. Xu, X., Weiss, S. and Wei, L.J. (2000), ‘A unified Haseman – Elston method for testing linkage with quantitative traits’,Am. J. Hum. Genet. Vol. 67, pp. 1025 – 1028.
47. Forrest, W.F. (2001), ‘Weighting improves the new Haseman – Elston method’,Hum. Hered.Vol. 52, pp. 47 – 54.
48. Wang, T. and Elston, R.C. (2005), ‘Two-level Haseman – Elston regression for general pedigree data analysis’,Genet. Epidemiol.Vol. 29, pp. 12 – 22. 49. Sham, P.C., Purcell, S., Cherny, S.S. and Abecasis, G.R. (2002), ‘Powerful
regression-based quantitative-trait linkage analysis of general pedigrees’, Am. J. Hum. Genet.Vol. 71, pp. 238 – 253.
50. Boerwinkle, E., Chakraborty, R. and Sing, C.F. (1986), ‘The use of measured genotype information in the analysis of quantitative phenotypes in man, I. Models and analytical methods’,Ann. Hum. Genet.Vol. 50, pp. 181 – 194.
51. Almasy, L. and Blangero, J. (2004), ‘Exploring positional candidate genes: Linkage conditional on measured genotype’,Behav. Genet.Vol. 34, pp. 173 – 177.
52. Pritchard, J.K., Stephens, M. and Donnelly, P. (2000), ‘Inference of population structure using multilocus genotype data’,GeneticsVol. 155, pp. 945 – 959.
53. Falk, C.T. and Rubinstein, P. (1987), ‘Haplotype relative risks: An easy reliable way to construct a proper control sample for risk calculations’, Ann. Hum. Genet.Vol. 51, pp. 227 – 233.
54. Spielman, R.S., McGinnis, R.E. and Ewens, W.J. (1993), ‘Transmission test for linkage disequilibrium: The insulin gene region and insulin-dependent diabetes mellitus (IDDM)’,Am. J. Hum. Genet.Vol. 52, pp. 506 – 516.
55. Allison, D.B. (1997), ‘Transmission-disequilibrium tests for quantitative traits’,Am. J. Hum. Genet.Vol. 60, pp. 676 – 690.
56. Rabinowitz, D. (1997), ‘A transmission disequilibrium test for quantitative trait loci’,Hum. Hered.Vol. 47, pp. 342 – 350.
57. Zhang, S., Zhang, K., Li, J.et al.(2001), ‘Test of association for quanti-tative traits in general pedigrees: The quantiquanti-tative pedigree disequilibrium test’,Genet. Epidemiol.Vol. 21 (Suppl. 1), pp. S370 – S375.
58. Sinsheimer, J.S., Blangero, J. and Lange, K. (2000), ‘Gamete-competition models’,Am. J. Hum. Genet.Vol. 66, pp. 1168 – 1172.
Software for quantitative trait analysis SOFTWARE REVIEWReview