e-ISSN: 2278-7461, p-ISSN: 2319-6491
Volume 5, Issue 3 [February 2016] PP: 16-23
Practicability of High Temperature and High Strain Rate
Superplastic Deep Drawing Process for AA3003 Alloy
Cylindrical Cups
Chennakesava R Alavala
Department of Mechanical Engineering, JNT University, Hyderabad-85,
Abstract: In this present work, the formability of cylindrical cups was analyzed for the feasibility of high temperature and high strain rate deep drawing process using Taguchi technique and finite element analysis based on the. The process parameters were temperature, strain rate, coefficient of friction and blank thickness. The formability limit diagrams were developed for all the trials. The formability of the deep drawn cups from AA3003 alloy was exceptional for the temperature of 500oC and strain rate of 100 s-1.
Keywords: AA3003 alloy, superplastic deep drawing process, coefficient of friction, cylindrical cups, forming limit diagram.
I.
INTRODUCTION
The deformation has been enhanced by several times in deep drawing without fracture at higher temperatures. The corollary of high strain rate superplastic (HSRS) forming process is to reduce the forming time. The conventional superplastic forming is accepted at low strain rates, in general about 10-4 – 10-3 s -1 and high forming temperatures. Abundant explorations have been convinced to boost the superplastic properties of materials such as AA1050 alloy [1], AA1070 alloy [2], AA1080 alloy [3], AA1100 alloy [4], AA2014 alloy [5], AA2017 alloy [6], AA2024 alloy [7], AA2219 alloy [8], Ti-Al-4V alloy [9], EDD steel [10], gas cylinder steel [11]. Deep drawing is a large deformation elasto-plastic problem. In the finite element simulations, a forming limit diagram (FLD) has been productively complimented to investigate the fracture phenomena by comparing the strain status [7, 8, 12, 13, 14]. AA3003 alloy is a non-heat-treatable 1.2% manganese, 0.12% copper alloy regularly available in flat rolled coil, sheet and plate from a wide range of producing mills. It has all the excellent properties of alloy 1100; excellent corrosion resistance plus the ability to be easily drawn or spun, welded or brazed. The alloy is also produced as drawn or extruded seamless tube, forgings, wire and bar and foil. The distinctive applications include cooking utensils, decorative trim, awnings, siding, storage tanks and chemical equipment.
The worth of present work was to find fitness of AA3003 alloy for high temperature and high strain rate (HTHSR) superplastic forming process. The investigation was to change the process parameters such as blank thickness, temperature, strain rate and coefficient of friction. The design of experiments was carried out using Taguchi technique. The HTHSR superplastic deep drawing process was implemented using the finite element analysis software code namely D-FORM 3D.
II.
MATERIALS AND METHODS
In the present work, AA3003alloy was used to make cylindrical cups. The levels chosen for the controllable process parameters are summarized in table 1. Each of the process parameters was deliberated at three levels. The orthogonal array (OA), L9 was preferred to carry out experimental and finite element analysis (FEA). The obligation of parameters in the OA matrix is given in table 2.
Table 1. Control parameters and levels
Factor Symbol Level–1 Level–2 Level–3
Blank thickness, mm A 1.0 1.2 1.5
Temperature, 0C B 300 400 500
Coefficient of friction C 0.2 0.3 0.4
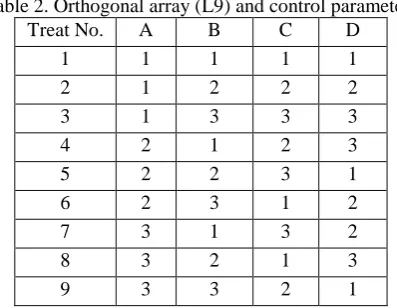
Table 2. Orthogonal array (L9) and control parameters
Treat No. A B C D
1 1 1 1 1
2 1 2 2 2
3 1 3 3 3
4 2 1 2 3
5 2 2 3 1
6 2 3 1 2
7 3 1 3 2
8 3 2 1 3
9 3 3 2 1
The finite element modeling and analysis was established using D-FORM 3D software. The cylindrical sheet blank was created with desired diameter and thickness using CAD tools. The sheet blank was meshed with tetrahedral elements [15]. The cylindrical top punch, cylindrical bottom hollow die were also modeled with appropriate inner and outer radius and corner radius using CAD tools (Fig. 1). The mechanical interface between the contact surfaces was implicated to be frictional contact and modeled as Coulomb’s friction model [7, 8].
Fig. 1. Cylindrical cup drawing without blank holder die.
Fig. 2. Discretization: (a) tetrahedron element; (b) AA3003 alloy blank sheet.
III.
RESULTS AND DISCUSSION
The finite element modeling parameters of deep drawing process were as follows: Number of tetrahedron elements for the blank sheet (Fig. 2): 21032
Number of polygons for top die: 9120 Number of polygons for bottom die: 9600
average value for the forming characteristic under null hypothesis, parameters which had Fisher’s ratio less than 3.457 were believed to have no effect on the average.
3.1 Influence of Process Parameters on Effective Stress
To reduce variation in the effective stress, the relative powers of process parameters are summarized in table 3. The adequacy of the finite element analysis was exceptional as the percent contribution due to error was zero. In table 3, the percent contribution indicates that the parameter D, strain rate, all by itself contributes the most toward the variation in the effective stress: almost 49%. The coefficient of friction (C) pitches into a fifth of the total variation (21.56%) observed in the effective stress. The temperature (B) tenders 15.44% of the total variation in the effective stress. The blank thickness (A) enriches 14% of the total variation in the effective stress. It was observed that only one result was higher than the average effective stress. Hence, all process parameters could influence the effective stress.
Table 3. ANOVA summary of the effective stress
Source Sum 1 Sum 2 Sum 3 SS v V F P
A 1218.06 581.84 1815.12 253581.53 1 253581.53 23080674.90 14.00
B 1947.99 908.34 758.69 279747.46 1 279747.46 25462265.24 15.44
C 614.36 931.12 2069.54 390431.87 1 390431.87 35536622.33 21.56
D 641.84 2532.29 440.89 887563.28 1 887563.28 80784903.83 49.00
e -0.01 4 0.00 0.00 0.00
T 4422.25 4953.60 5084.25 1811324.13 8 100.00
Note: SS is the sum of square, v is the degrees of freedom, V is the variance, F is the Fisher’s ratio, P is the percentage of contribution and T is the sum squares due to total variation.
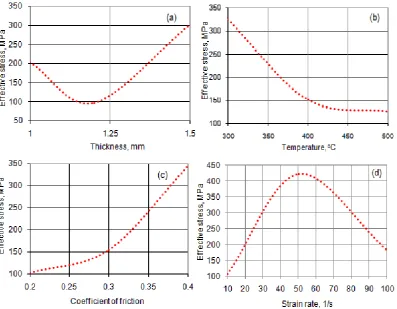
Fig. 3. Effect of process parameters on the effective stress: (a) blank thickness, (b) temperature, (c) coefficient of friction and (d) strain rate.
1.2 mm and 1.5 mm blank thicknesses. Fig. 3(b) describes the effective stress as a function of temperature. The effective stress decreased with the increase of temperature. But, the effective stress increased with the increase of friction during deep drawing process as showed in Fig 3(c). Fig. 3(d) describes the effective stress as a function of strain rate. The effective stress initially increases with the increase of the strain rate till it reaches a value of 50 s-1 and later on the effective stress decreases with the increases of strain rate from 50 to 100 s-1. This reduction in stress took place when the strain and strain rate hardening effects were outweighed by the softening effect as result of the heat generated during the plastic deformation.
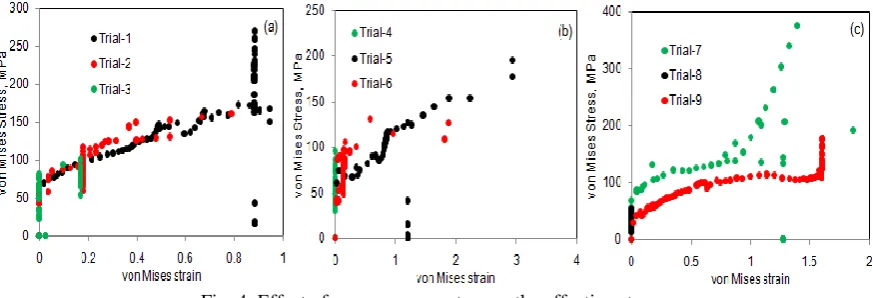
The FEA results of effective stress are showed in Fig. 4 for various test conditions as per the design of experiments. For trials 1, 2 and 3, the temperature was 300oC and other process parameters were varied as mentioned in tables 1 and 2. The effective stresses for trails 1, 2 and 3 were, respectively, 269.08 MPa, 658.26 MPa and 290.72 MPa. For trials 4, 5 and 6, the temperature was 400oC and other process parameters were as stated in tables 1 and 2. The effective stresses for trails 4, 5 and 6 were, respectively, 95.61 MPa, 195.52MPa and 290.72 MPa. For trials 7, 8 and 9, the temperature was 500oC and other process parameters were as designed in tables 1 and 2. The effective stresses for trails 7, 8 and 9 were, respectively, 1583.31 MPa, 54.57 MPa and 177.25 MPa.
Fig. 4. Effect of process parameters on the effective stress.
3.2 Influence of Process Parameters on Surface Expansion Ratio
The relative influences of process parameters are summarized in table 4. The capability of the finite element analysis was excellent as the percent contribution due to error was less than 10% or less. If the percent contribution due to error is low (10% or less), then it is assumed that no important factors were omitted from the experiment. In table 4, the percent contribution indicates that the parameter C, coefficient of friction, all by itself accords half of the total variation in the effective stress. The strain rate (D) commits to a quarter of the total variation (27.46%) observed in the effective stress. The blank thickness (A) doles up 16.87% of the total variation in the effective stress. The temperature (B) dispenses only 5.29% of the total variation in the effective stress. Of all nine results, five results are higher than the average surface expansion ratio. Hence, only one process parameters would dominant in controlling the surface expansion ratio. The strongest process parameter was coefficient of friction.
Table 4. ANOVA summary of the surface expansion ratio
Source Sum 1 Sum 2 Sum 3 SS v V F P
A 7.16 5.89 5.49 0.51 1 0.51 170.00 16.87
B 6.5 6.44 5.6 0.16 1 0.16 53.33 5.29
C 4.59 6.35 7.6 1.52 1 1.52 506.67 50.28
D 4.91 6.96 6.67 0.83 1 0.83 276.67 27.46
e 0.003 4 0 0.00 0.1
T 23.16 25.64 25.36 3.023 8 100
Fig. 5. Effect of process parameters on surface expansion ratio (a) coefficient of friction and (b) strain rate.
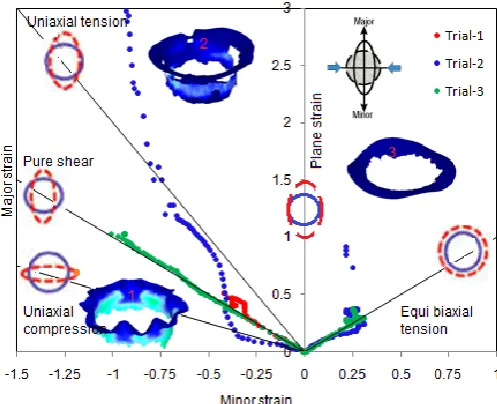
Fig. 6. Forming limit diagram with damage in the cups drawn at temperature 300oC.
Fig.7. Forming limit diagram with damage in the cups drawn at temperature 400oC.
3.3 Forming Limit Diagrams and Damages in the Cups
temperature 400oC. Cups drawn on trial 4 were undergone deep drawing process without damage. Cups drawn from trials 5 were fractured due to uniaxial tension. The fracture was observed in the flange area of the cups drawn with trail 6 due to uniaxial compression and uniaxial compression. Fig. 8 demonstrates the FLD and damages in the cups drawn from AA3003 alloy sheets with trials, 7, 8 and 9 at temperature 500oC. Cups drawn from trial 7 were experienced fracture due to uniaxial compression and shear. Cups drawn under trial 8 were not fractured. Cups drawn under trial 9 had very little fracture in the flange area due to axial compression.
Fig. 8. Forming limit diagram with damage in the cups drawn at temperature 500oC.
The comparative weightage of process parameters are summarized in table 4. The competence of the finite element analysis was outstanding as the percent contribution due to error (0.73%) was less than 10% or less. In table 5, the percent contributions indicate that all parameters would share nearly equal on damage of the cups. Of all nine results, only one result was higher than the average damage of the cups. Hence, all process parameters would prevail in scheming the damage of cups.
Table 5: ANOVA summary of the effective stress
Source Sum 1 Sum 2 Sum 3 SS v V F P
A 2.38 29.08 5.32 142.88 1 142.88 57.80 21.03
B 5.15 29.45 2.17 149.30 1 149.30 60.40 21.98
C 1.90 2.44 32.44 203.64 1 203.64 82.38 30.02
D 30.84 5.84 0.10 178.08 1 178.08 72.04 26.24
e 2.47 4 0.62 0.25 0.73
T 40.27 66.81 40.04 676.37 8 100.00
The damage of cups as a function of blank thickness is showed in Fig. 9(a). The damage of cups was high for the blank thickness of 1.2 mm and it was low for thicknesses of 1.0 mm and 1.5 mm. As seen from Fig. 9(b), the damage of cups decreased with the increase of temperature. The damage of cups increased with the increase of coefficient of friction as observed from Fig. 9(c). The damage of cups decreased with the increase of strain rate as revealed from Fig. 9(d). Therefore, high temperature and high strain rate (HTHSR) is possible with AA3003 alloy for deep drawing the cups. As proved from Fig. 10, the damage factor was higher than 10 for the cups drawn from trials 1, 3 5 and 7. The damage factor was very small for the ups drawn from the trails 6 and 9. The damage was nil in the cups drawn from the trails 4 and 8.
Fig. 10. Damage factors under different trials.
IV.
CONCLUSIONS
With strain rate of 100 s-1, temperature of 500oC, coefficient of friction of 0.2, the blank thickness of 1.5 mm could yield damageless cups (trial 8). As a result, high temperature and strain rate (HTHSR) deep drawing is potential to draw cups from AA3003 alloy.
V.
ACKNOWLEDGMENT
The author wishes to thank University Grants Commission (UGC), New Delhi, India for financial assisting this project.
REFERENCES
[1]. Reddy, A. C. Homogenization and Parametric Consequence of Warm Deep Drawing Process for 1050A Aluminum Alloy: Validation through FEA, International Journal of Science and Research, 4(4), 2015, pp. 2034-2042.
[2]. Chandini, K., Reddy, A. C. Parametric Importance of Warm Deep Drawing Process for 1070A Aluminium Alloy: Validation through FEA, International Journal of Scientific & Engineering Research, 6(4), 2015, pp. 399-407.
[3]. Yamuna, B., Reddy, A. C. Parametric Merit of Warm Deep Drawing Process for 1080A Aluminium Alloy: Validation through FEA, International Journal of Scientific & Engineering Research, 6(4), 2015, pp. 416-424.
[4]. Srinivas, T., Reddy, A.C. Parametric Optimization of Warm Deep Drawing Process of 1100 Aluminum Alloy: Validation through FEA, International Journal of Scientific & Engineering Research, 6(4), 2015, pp. 425-433.
[5]. Reddy, A. C. Parametric Optimization of Warm Deep Drawing Process of 2014T6 Aluminum Alloy Using FEA, International Journal of Scientific & Engineering Research, 6(5), 2015, pp.1016-1024. [6]. Reddy, A. C. Finite Element Analysis of Warm Deep Drawing Process for 2017T4 Aluminum Alloy:
Parametric Significance Using Taguchi Technique, International Journal of Advanced Research, 3(5), 2015, pp. 1247-1255.
[7]. Reddy, A. C. Parametric Significance of Warm Drawing Process for 2024T4 Aluminum Alloy through FEA, International Journal of Science and Research, 4(5), 2015, pp. 2345-2351.
[8]. Reddy, A. C. Formability of High Temperature and High Strain Rate Superplastic Deep Drawing Process for AA2219 Cylindrical Cups, International Journal of Advanced Research, 3(10), 2015, pp. 1016-1024. [9]. Reddy, A. C. Finite element analysis of reverse superplastic blow forming of Ti-Al-4V alloy for
[10]. Reddy, A. C., Reddy, T. K. K., Vidya Sagar, M. Experimental characterization of warm deep drawing process for EDD steel, International Journal of Multidisciplinary Research & Advances in Engineering, 4(3), 2012, pp.53-62.
[11]. Reddy, A. C . Evaluation of local thinning during cup drawing of gas cylinder steel using isotropic criteria, International Journal of Engineering and Materials Sciences, 5(2), 2012, pp.71-76.
[12]. Panich, S., Uthaisangsuk, V., Juntaratin, J., Suranuntchai, S. Determination of Forming Limit Stress Diagram for Formability Prediction of SPCE 270 Steel Sheet, Journal of Metals, Materials and Minerals, 21(1), 2011, pp.19-27.
[13]. Buakaew, V., Sodamuk, S., Sirivedin, S. Jirathearanat, S. Formability prediction of automotive parts using forming limit, Materials Engineering. 1(5), 2007, pp.91-698.
[14]. ASTM E 2218-02. Standard test method for determining forming limit curves, 2002, pp.1252-1266. [15]. C.R. Alavala. Finite Element Methods: Basic Concepts and Applications, PHI Learning Pvt. Ltd., New