Abstract - The purpose of this research is to obtain optimal activation conditions for activated carbon prepared from rice husk (RHAC) using response surface methodology (RSM). Central composite design (CCD) was used to determine the effects of the three preparation variables; activation temperature, activation time and ZnCl2: char impregnation ratio (IR) on
RHAC yield and percentage of Zn (II) removal. Based on the CCD, two quadratic models were developed for both responses. The most influential factor on each experimental design response was identified from the analysis of variance (ANOVA). The optimum conditions for RHAC were activation temperature of 500oC, activation time of 1.71 h and IR of 1.04 resulting in 34.21
% RHAC yield and 40.87 % Zn (II) removal.
Index Term- Activated carbon, Central composite design, Optimization, Rice husk, Zinc (II) removal
I. INTRODUCTION
Zinc is one of the toxic metals that is available in industrial effluents involved in acid mine drainage, galvanizing plants, natural ores and municipal wastewater treatment plants [1]. High release of zinc into environment is also from agricultural activities, sediment entrainment and groundwater intrusion [2]. In recent years, various methods of Zn (II) removal from industrial wastewater have been developed such as chemical precipitation, solvent extraction, reverse osmosis, ion exchange, evaporation, filtration, adsorption, oxidation and reduction. However, most of the methods are expensive and ineffective for low Zn (II) concentrations, produce toxic sludge and require the use of high reagent and energy [3]. Among these methods, adsorption has been specially applied as an efficient method for Zn (II) removal.
Although varieties of activated carbons are available commercially, they are very costly. Therefore, the use of new and inexpensive adsorbents for Zn (II) removal of metals from wastewater seems necessary. In recent years, several low-cost
This work was supported by the Research University grant from Universiti Sains Malaysia (Project number: 814021 and 814003). Mohd Azmier Ahmad
and Ismail Abustan are the members of Waste Management Cluster of Universiti Sains Malaysia. Nasehir Khan E M Yahaya, Muhamad Faizal Pakir
Mohamed Latiff and Olugbenga Solomon Bello are researchers working on activated carbon. The correspondence author can be contacted via e-mail:
[email protected] (M.A. Ahmad).
materials such as industrial by-products and agricultural wastes have been used as activated carbon precursor for the Zn (II) removal as well as other metal ions from water systems [4-6].
In Malaysia, rice husk is one of such alternative material that is readily available. In this work an attempt was made to optimize the preparation conditions of activated carbon from rice husk for the removal of Zn (II) ions from aqueous solutions. Utilizing rice husk in preparing activated carbon will convert this waste into value-added product. Currently, no study has been done on optimization of the production of activated carbon from rice husk for Zn (II) removal using the response surface methodology (RSM) approach. A standard RSM design called a central composite design (CCD) helps in optimizing the effective parameters with a minimum number of experiments, as well as in analyzing the interaction between the parameters [7]. The effects of preparation variables such as activation temperature, activation time and IR were studied to give a high RHAC yield and high Zn (II) percentage removal from aqueous solution.
II. MATERIALS AND METHODS
A. Materials
Rice husk (RH) was obtained from the local rice processing mill in Kepala Batas, Penang, Malaysia. Stock solutions of Zn (II) were prepared by dissolving appropriate amounts of Zn(NO3)2.6H2O (Merck, 99% purity) in deionized distilled water. Deionized water was used to prepare all solutions.
B. Preparation of RHAC
RH was washed with water and subsequently dried at 105oC for 24 h to remove moisture content. The dried RH was ground and sieved to a particle size of 1-2 mm before loading it in a stainless steel vertical tubular reactor placed in a tube furnace. Carbonization step was carried out at 400oC for 30 min under nitrogen (99.99%) flow. The char produced was mixed with ZnCl2 pellets at different impregnation ratio (IR), calculated using the equation below:
Process Optimization for Zn (II) Removal by
Activated Carbon Prepared from Rice Husk
using Chemical Activation
Nasehir Khan E M Yahaya
a, Muhamad Faizal Pakir Mohamed Latiff
a, Ismail Abustan
a,
Olugbenga Solomon Bellob, Mohd Azmier Ahmadb,*
aSchool of Civil Engineering, Engineering Campus, Universiti Sains Malaysia,
14300 Nibong Tebal, Penang, Malaysia
bSchool of Chemical Engineering, Engineering Campus, Universiti Sains Malaysia,
IR =
char
ZnCl W
W /
2
(1)
where W
2
ZnCl is the dry weight (g) of ZnCl2 pellets and Wchar is the dry weight (g) of char. Deionized water was then added to dissolve all the ZnCl2 pellets. The activation step was done using similar reactor as in carbonization step. Once the final activation temperature was reached, the gas flow was switched from nitrogen to CO2 at a flow rate of 150 ml/min. The sample was then cooled to room temperature under nitrogen flow. Finally, the sample was washed with hot deionized water and hydrochloric acid (0.1M) until the pH of the washed solution reached 6.5-7.
C. Adsorption studies
For batch adsorption studies, 0.3 g of adsorbent were mixed with 100 ml aqueous Zn(II) solutions of 50 mg/L initial concentration in 20 sets of 250 ml Erlenmeyer flasks. The mixture was agitated at 400 rpm at 30°C until equilibrium was reached. The concentration of Zn (II) solution was determined using a spectrophotometer (model DR 2010) at a wavelength of 455 nm. The percentage removal of Zn (II) at equilibrium was calculated as:
Removal(%) =(Co− Ce)
Co
x 100 (2)
where Co and Ce are the liquid-phase Zn (II) concentrations at initial state and at equilibrium, respectively.
D. Activated carbon yield
The RHAC yield was calculated as:
Yield(%) =wc
wo
x100 (3)
where wc and wo are the dry weight of final RHAC (g) and the dry weight of precursor (g), respectively.
E. Design of experiments
In this work, a standard RSM design called CCD was applied to study the variables for preparing the activated carbon from rice husk (RHAC). The CCD consists of three kinds of runs which are the 2n factorial runs, 2(n) axial runs and six center runs, where n is the number of variables. The preparation variables used were activation temperature (x1),
activation time (x2) and IR (x3) indicating that altogether 20
experiments for this procedure as calculated from (4):
𝑁 = 2n+ 2n + n
c= 23+ 2٭3 + 6 = 20 (4)
where N is the total number of experiments required.
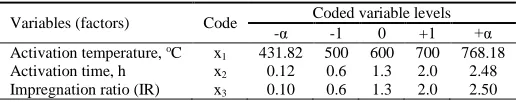
These three variables together with their respective ranges were chosen based on literature and preliminary studies are reported in Table I.
TABLE I
INDEPENDENT VARIABLES AND THEIR CODED LEVELS
Variables (factors) Code Coded variable levels
-α -1 0 +1 +α
The center points are used to determine the experimental error and the reproducibility of the data. The axial points are located at (±α, 0, 0), (0, ±α, 0) and (0, 0, ±α) where α (1.682) is the distance of the axial point from center and makes the design rotatable. The experimental sequence was randomized in order to minimize the effects of the uncontrolled factor. The two responses were RHAC yield (Y1) and percentage of Zn
(II) removal (Y2). Each response was used to develop an
empirical model which correlated the response to the preparation variables using a second-degree polynomial equation as given by (5):
𝑌 = 𝑏𝑜+ ∑ 𝑏𝑖𝑥𝑖+ (∑ 𝑏𝑖𝑖𝑥𝑖 𝑛
𝑖=1
)
2 𝑛
𝑖=1
+ ∑
𝑛−1
𝑖=1
∑ 𝑏𝑖𝑗𝑥𝑖𝑥𝑗 𝑛
𝑗=𝑖+1
(5)
where Y is the predicted response, bo the constant coefficient,
bi the linear coefficients, bijthe interaction coefficients, biithe
quadratic coefficients and xi, xj are the coded values of the
activated carbon preparation variables.
F. Model fitting and statistical analysis
The experimental data were analyzed using a statistical software Design Expert software version 6.0.6 (STAT-EASE Inc., Minneapolis, USA) for regression analysis to fit the second-degree polynomial equation and also for the evaluation of the statistical significance of the equations developed.
G. Characterization of RHAC
The surface area, pore volume and average pore diameter of the RHAC were determined by using Micromeritics ASAP 2020 volumetric adsorption analyzer. A 21-point analysis was carried out at 77 K to obtain the nitrogen adsorption isotherm. The surface area of the sample was determined using Brunauer-Emmett-Teller (BET) equation. The total pore volume was estimated to be the liquid volume of nitrogen at a relative pressure of 0.98. The surface morphology of the samples was examined using a scanning electron microscope (JEOL, JSM-6460 LV, Japan).
III. RESULTS AND DISCUSSION
A. Development of regression model equation
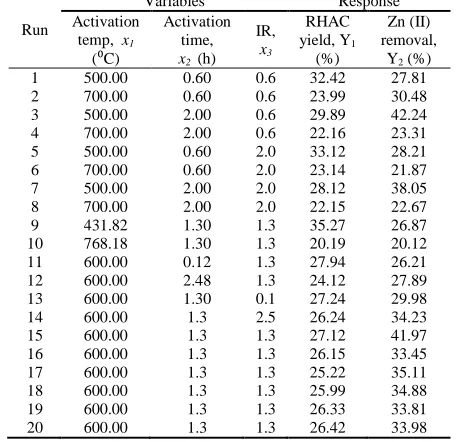
Table II shows the complete design matrixes together with both the response values obtained from the experimental work. Run 15-20 at the center point were conducted to determine the experimental error and the reproducibility of the data. The RHAC yield and the percentage of Zn (II) removal were found to range from 20.19 to 35.27% and 20.12 to 42.24%, respectively. According to the sequential model sum of squares, the models were selected based on the highest order polynomials where the additional terms were significant. For both responses quadratic models were selected as suggested by the software. The final empirical formula models for the RHAC yield (Y1) and Zn (II) removal (Y2) in terms of
Y1 = 26.20 – 4.21x1 - 1.23x2 - 0.26x3 + 0.54x12 –0.061x22 + 0.19x32 + 0.59 x1x2 + 0.026x1x3 –0.20x2x3 (6)
Y2 = 35.46 – 3.61x1 +1.52x2 – 0.43x3 – 3.78x12 –2.52x22 – 0.73x32– 3.83x1x2 – 0.68 x1x3 + 0.42x2x3 (7)
TABLE II
EXPERIMENTAL DESIGN MATRIX FOR PREPARATION OF RHAC
Run
Variables Response
Activation temp, x1
(⁰C)
Activation time,
x2 (h) IR,
x3
RHAC yield, Y1
(%)
Zn (II) removal,
Y2 (%) 1 500.00 0.60 0.6 32.42 27.81 2 700.00 0.60 0.6 23.99 30.48 3 500.00 2.00 0.6 29.89 42.24 4 700.00 2.00 0.6 22.16 23.31 5 500.00 0.60 2.0 33.12 28.21 6 700.00 0.60 2.0 23.14 21.87 7 500.00 2.00 2.0 28.12 38.05 8 700.00 2.00 2.0 22.15 22.67 9 431.82 1.30 1.3 35.27 26.87 10 768.18 1.30 1.3 20.19 20.12 11 600.00 0.12 1.3 27.94 26.21 12 600.00 2.48 1.3 24.12 27.89 13 600.00 1.30 0.1 27.24 29.98 14 600.00 1.3 2.5 26.24 34.23 15 600.00 1.3 1.3 27.12 41.97 16 600.00 1.3 1.3 26.15 33.45 17 600.00 1.3 1.3 25.22 35.11 18 600.00 1.3 1.3 25.99 34.88 19 600.00 1.3 1.3 26.33 33.81 20 600.00 1.3 1.3 26.42 33.98
The quality of the model developed was evaluated based on the correlation coefficient (R2) value. The closer the R2 value to unity, the better the model as this will give predicted values which are closer to the actual values for the response [8]. The R2 values for (6) and (7) are 0.985 and 0.822 respectively. These values indicated that 98.5 and 82.2 % of the total variation in the RHAC yield and Zn (II) removal respectively were attributed to the experimental variables studied. The R2 value of 0.985 and 0.822 for (6) and (7) were considered very high, indicating that there were a good agreement between the experimental and the predicted values for RHAC yield and the removal of Zn (II) as suggested by the model.
B. Analysis of variance
The validity of the models were further justified through analysis of variance (ANOVA), the results are presented in Tables 3 and 4. F-value from the model implied the significance of the model similarly, the value of Prob > F less than 0.05 indicated that the model terms were significant [9]. Table 3 reports the ANOVA values for RHAC yield. The prediction of the model is significant with F-value of 73.29 and Prob > F less than 0.0001. In this case, x1, x2, x12 and x1x2
were significant model terms whereas x3, x22, x32x1x3andx2x3
were insignificant to the response. However, the effect of activation temperature was greater than activation time on RHAC yield.
TABLE III
ANOVA FOR RESPONSE SURFACE QUADRATIC MODEL FOR RHAC YIELD
Source Sum of squares
Degree of freedom
Mean
square F value Prob > F Model 271.23 9 30.14 73.29 <0.0001
x1 241.85 1 241.85 588.18 <0.0001
x2 20.60 1 20.60 50.11 <0.0001
x3 0.96 1 0.96 2.32 0.1585
x12 4.20 1 4.20 10.21 0.0096
x22 0.054 1 0.054 0.13 0.7239
x32 0.52 1 0.52 1.26 0.2878
x1x2 2.77 1 2.77 6.74 0.0266
x1x3 0.0055 1 0.0055 0.013 0.9101
x2x3 0.33 1 0.33 0.81 0.3899
Residual 0.41 10 0.41 - -
The ANOVA data for Zn (II) removal is as presented in Table IV. The model F-value of 4.49 and Prob > F of 0.014 again confirmed that the model was significant. In this case, x1, x12, x22 and x1x2 were significant model term whereas x2, x3,
x32x1x3andx2x3 were insignificant to the response. From the
statistical results obtained, the two models above were found to be adequate to predict the responses for RHAC prepared within the range of the variables studied.
TABLE IV
ANOVA FOR RESPONSE SURFACE QUADRATIC MODEL FOR ZINC (II) REMOVAL OF RHAC
Source Sum of squares
Degree of freedom
Mean square
F
value Prob > F Model 607.89 9 67.54 4.49 0.014
x1 178.89 1 178.20 11.84 0.0063
x2 31.45 1 31.45 2.09 0.1789
x3 2.54 1 2.54 0.17 0.6897
x12 205.74 1 205.74 13.67 0.0041
x22 91.63 1 91.63 6.09 0.0333
x32 7.77 1 7.77 0.52 0.4889
x1x2 117.35 1 117.35 7.80 0.019
x1x3 3.73 1 3.73 0.25 0.6295
x2x3 1.43 1 1.43 0.095 0.7644
Residual 150.5 10 15.05 - -
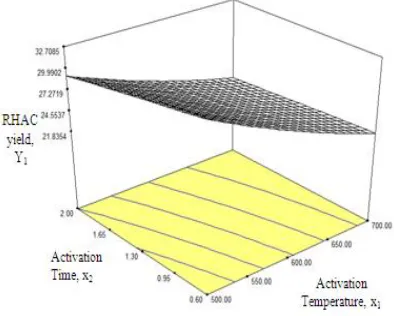
C.Activated carbon yield and Zn (II) removal
Fig. 1. Three dimensional response surface plot for RHAC yield (Effect of activation temperature and activation time, IR = 1.3).
Fig. 2 shows the three-dimensional response surface which was constructed to show the effects of activation temperature and activation time on the Zn (II) removal. It was observed that Zn (II) removal increased with increase in activation temperature. The highest Zn (II) removal was obtained at the maximum activation temperature within the range of study. Increasing activation temperature widens the activated carbon pores, making it more favorable for Zn (II) removal [12]. The activation time showed insignificant effect to the response as supported by low F value of 2.09 as given in Table IV.
Fig. 2. Three dimensional response surface plot for percentage Zn (II) removal (Effect of activation temperature and activation time, IR = 1.3).
D. Process Optimization
One of the main aims of this study was to find the optimum process parameters at which RHAC produced will have a high carbon yield and a high affinity Zn (II) removal. However, it is difficult to optimize these responses under the same condition because the interest regions of factors are different. When adsorption performance increases, RHAC yield will decrease and vice versa. Therefore, the function of desirability was applied using Design-Expert software in order
variables were set within the range study. The experimental conditions with the highest desirability were selected and applied to prepare the optimum RHAC. The predicted and experimental results of RHAC yield and Zn (II) removal at optimum conditions are listed in Table V.
TABLE V
MODEL VALIDATION Act.
temp., x1 (oC)
Act. time, x2 (h)
IR, x3
RHAC yield (%) Zn (II) removal (%)
Pred. Act. Err.
(%) Pred. Act. Err. (%) 500 1.71 1.04 35.27 34.21 3.00 42.24 40.87 3.24
The optimum RHAC was obtained by using 500oC, 1.71 h and 1.04 of activation temperature, activation time and IR respectively. The optimum RHAC showed 34.21% of RHAC yield and 40.87% Zn (II) removal with small error of 3% and 3.24% for RHAC yield and Zn (II) removal, respectively.
E. Activated carbon characterization
IV. CONCLUSIONS
RSM was successfully used to investigate the effects of preparation variables on the RHAC yield and Zn (II) removal. The optimum RHAC preparation conditions were obtained using activation temperature, activation time and IR of 500oC, 1.71 h and 1.04, respectively, which resulted in 34.21% of RHAC yield and 40.87% of Zn (II) removal. Through analysis of the response surface, activation temperature was found to has significant effect on RHAC yield and Zn (II) removal. The RHAC demonstrated homogeneous type of pores structure with well-developed porosity.
REFERENCES
[1] L. Norton, K. Baskaran, S.T.McKenzie, “Biosorption of zinc from aqueous solutions using biosolids”, Adv. Environ. Res., 8, 2004, 629-635.
[2] C.K. Jain, “Application of chemical mass balance to upstream/downstream river monitoring data”, J Hydrol., 182,
1996, 105-115.
[3] J.T. Matheichal, Q. Yu, J. Feltham, “Cu (II) binding by E. Radiata
biomaterial”, Environ. Technol., 18, 1997, 25-34.
[4] A. Mellah, S. Chegrouche, “The removal of zinc from aqueous solutions by natural bentonite”, Water Res., 31,1997, 621-629. [5] S.H. Gharaibeh, W.Y. Abu-El-Shar, M.M. Al-Kofahi, “Removal of
selected heavy metals from aqueous solutions using processed solid residue of olive mill products”, Water Res., 32, 1998, 498-502.
[6] M. Lehmann, A.I. Zouboulis, K.A. Matis, “Removal of metal ions from dilute aqueous solutions: a comparative study of inorganic sorbent materials”, Chemosphere, 39, 1999, 81-892.
[7] A.M.M. Vargas, C.A. Garcia, E.M. Reis, E. Lenzi, W.F. Costa, V.C. Almeida, “NaOH-activated carbon from flamboyant (Delonix regia) pods: Optimization of preparation conditions using central composite rotatable design”, Chem. Eng. J., 162, 2010, 43-50. [8] M.A. Ahmad, R. Alrozi, “Optimization of preparation conditions
for mangosteen peel-based activated carbons for the removal of Remazol Brilliant Blue R using response surface methodology”,
Chem. Eng. J., 165, 2010, 883-890.
[9] J.N. Sahu, J. Acharya, B.C. Meikap, “Optimization of production conditions for activated carbons from Tamarind wood by zinc chloride using response surface methodology”, Bioresour. Technol., 101, 2010, 1974-1982.
[10] B.H. Hameed, I.A.W. Tan, A.L. Ahmad, “Preparation of oil palm empty fruit bunch-based activated carbon for removal of 2,4,6-trichlorophenol: Optimization using response surface methodology”, J. Hazard. Mater., 164, 2009, 1316-1324. [11] I.A.W. Tan, A.L. Ahmad, B.H. Hameed, “Optimization of
preparation conditions for activated carbons from coconut husk using response surface methodology”, Chem. Eng. J. 137, 2008, 462-470.
[12] R.L.Tseng, S.K. Tseng, F.C. Wu, “Preparation of high surface area carbons from Corncob with KOH etching plus CO2 gasification for the adsorption of dyes and phenols from water”, Coll. Surf. A: Physicochem. Eng. Asp., 279, 2006, 69-78.