Abstract— This paper presents the results of research of the
microstructure of the composite blade W55RBVS for the wind turbine of up to 6kW power after structural testing up to failure. The first part of the testing consists of the static testing of the structure up to the moment of the blade failure. The aim of the first part of the test was to define rigidity of the blade W55RBVS , to determine the maximum force which leads to faliure and the relative span of the blade failure. Blade testing i s performed in the Aerotechnics Laboratory of the Faculty of Mechanical Engineering, Belgrade University. The second part of the testing consists of comparing the critically loaded part with sub-critically loaded part. This test was carried out by atomic force microscopy (Eng. Atomic Force Microscopy-AFM). All the results and analysis are presented in this paper. The test result will be used to redesign the blades.
Index Term— Structural Testing, Small Wind Turbine,
Composite Blade, Blade Testing, Microstructure, Atomic Force Microscopy.
I. INT RODUCT ION
The programme for testing rigidity of the composite rotor blade W55RBVS of the wind turbine Scirocco is defined by standard IEC 61400‐2 [1]. The rotor blade testing is done in an Aerotechnics Laboratory at the Faculty of Mechanical Engineering, Belgrade University. The purpose of this testing is to define the rigidity of the rotor blade and to determine the maximum force that causes the failure of the rotor blade as well as the spot of the failure. This research uses atomic and magnetic force microscopy to determine differences of the surface topography and magnetic properties between parts of the wind turbine blade that were under different load during
Prof. dr Časlav Mitrović is a professor at the University of Belgrade, Faculty of Mechanical Engineering, Aeronautical Engineering Department in the field of aviation from June 1998. Časlav Mitrović is also the author or co-author of more than 200 works and projects in the field of aviation. He is a
Director of Mechanical Engineering Alumni Foundation (e-mail: [email protected])
Prof. dr Nebojša Petrović is Aerospace Institute Director at Aeronautical Engineering Department of Faculty of Mechanical Engineering, University of
Belgrade. (e-mail: [email protected]).
Mr Dragoljub Bekric is a Ph.D candidate at Aeronautical Engineering Department of Faculty of Mechanical Engineering, University of Belgrade
(e-mail: [email protected]).
Prof. dr Aleksandar Bengin is a professor at the University of Belgrade, Faculty of Mechanical Engineering, Aeronautical Engineering Department .
(e-mail: [email protected]).
Prof. dr Branislav Rakićević is Head of accredited laboratories CIAH, at Faculty of Mechanical Engineering, University of Belgrade. (e-mail:
the mechanical testing of rigidity. This may lead to n ew insight in the structure of the materials used for wind turbine blades and potentially bring improvements to their mechanical properties.
II. ST RUCT URAL TEST ING
The purpose of this research is to test the established technology of designing the composite rotor bladeW55RBVS of wind turbine Scirocco [2].
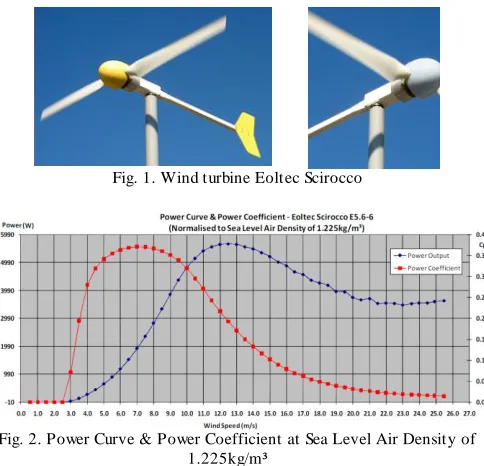
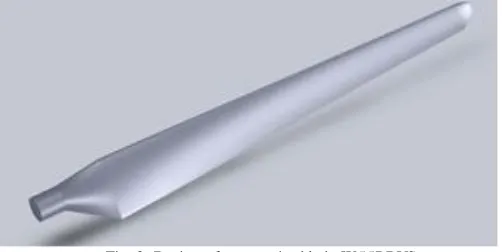
Scirocco is a 5.6m diameter rotor (Fig. 1), 6kW output professional-scale (Fig. 2). wind turbine ideal for remote sites with medium power needs, such as small farms, houses, or large homesteads and especially rural or village electrification, sea water desalination, direct electrical water wind -driven pumping. This wind turbine is a common practice and it is built in several countries in Europe and America.
Fig. 1. Wind turbine Eoltec Scirocco
Fig. 2. Power Curve & Power Coefficient at Sea Level Air Density of 1.225kg/m³
Unlike most of its competitors, which use furling technique to decrease acquisition cost at the detriment of performances and reliability, Scirocco WT is designed and realized without compromise, using state of the art components, centrifugal pitch overspeed regulation device, slewing rings for blades attachment and yawing, 100% sealed direct drive permanent magnet generator. Design and calculations have been made according to IEC 61400-2 design rules [3][4].
Scirocco is characterized by low rotation speed, a very high
Micro-Structure Characterization of Composite
Wind Turbine Blade Following Structural
Testing
efficiency, especially in the lower to medium wind speed range which is prevailing most of the time.
This is the result of the conjunction of an optimized 2 blades rotor, an efficient direct drive PM generator, and variable speed management combined with the maximal power point tracking control following the constantly varying wind speed. Composite rotor blades W55RBVS are produced in the WING.d.o.o company (Fig.3).
Fig. 3. Design of composite bladesW55RBVS
The design of rotor blades is a balanced integration of aerodynamics, structural analysis and dynamics, choice of different type of composite materials, production technology and overall economy.
The design of modern rotor includes choice of blade number, airfoil, chord and twist distribution. Additional criteria are reliability, noise and aesthetic considerations. The blade design process is multi-objective and generally include two optimization functions, maximum annual energy production or minimum cost of energy.
To optimize minimum cost of energy requires a multi-disciplinary method that includes an aerodynamic model, structural model, along with cost models for the blades and all major wind turbine components .
A. Programme for testing
The programme for testing rigidity of the composite rotor blade W55RBVS, made in WING.d.o.o. company, of the wind turbine Scirocco is defined by standard IEC 61400-2. The rotor blade testing is done in Aerotechnics Laboratory at the Faculty of Mechanical Engineering, Belgrade University.
The purpose of this testing is to define rigidity of the rotor blade and to determine the maximum force that causes failure of the rotor blade as well as the spot of the failure.
Methods used for this purpose and the way of performing this testing are common practice of aeronautical reseach institutes.
B. Rotor blade acceptances
Rotor blade acceptance provides a holding link between the wind turbine blade and the test table grid. The rotor blade is mounted on the structure at the angle of attack. (Fig. 4).
A special rotor blade holder is prepared for this testing. This holder constitutes of extremely rigid specious grid made of steel C and L profiles that are mutually connected by bolt links.
The link between the rotor blade and the holder is
accomplished through 30mm board and by bolts M8 of 8.8 quality.
Fig. 4. Rotor blade acceptance
C. Measuring equipment
The central acquisition unit HBM SPIDER 8 represents a multifunctional model of receiving analogue and digital signals with parallel tracing of the flow of input units, by means of integrated microcomputer, using higher level system to relieve the acquisition route and to provide the flow of signals from certain “smart sensors” directly to the control unit.
SPIDER 8 is a multichannel acquisition unit desig ned for dynamic parallel measuring. Thanks to integration with personal computer as a higher level system, the process of measuring is remarkably simple and the total acquisition system is compact and of small dimensions (Fig. 5).
Fig. 5. T wo modules of SPIDER 8
This eight-channel acquisition unit provides 9600 measurings per second per each channel with resolution of 16 bits. All 8 A/D convertors work simultaneously and in a real time follow the transformation of physical values into a digital signal.
Two modules are used for this experiment in this way providing that 16 measuring values are at a disposal for the experiment.
measuring scale from ±1 to ±500mm. Four different spots are considered in measurement performing (Fig. 6).
Fig. 6. Inductive displacement sensor LVDT - HBM
Six force sensors specially made for this purpose are used for measuring the force. Each force sensor consists of four measuring tapes glued on the body of the sensor in a way shown on the fig. 7. The function of the two measuring tapes glued in axial direction is to measure the deformation of the sensor body during its load, while the function of the other two measuring tapes glued crosswise is to compensate the deformations caused by sensor body bending and in this way to provide that the measuring value should be proportional only to axial load.
a) b)
Fig. 7. Force sensor a) scheme; b) on the blade
Each of the force sensors is connected to Vitston full measuring bridge. The measuring bridge is supplied with direct input voltage VI, while output voltage VO depends on resistance change of the measuring tapes R1, R2, R3 and R4 caused by their deformations and it is proportional to axial force value that influences the sensor. The method of bonding the measuring tapes into measuring bridge provides above mentioned compensation of bending moment influences on the output voltage.
Introducing force is performed by means of specially made system that consists of supporting structure, pulley, reductor unit and engine with frequent control. The maximum force possible that can be achieved with this system is 2500 daN (Fig. 8).
Fig. 8. Constriction for force distribution
D. Realization of the experiment
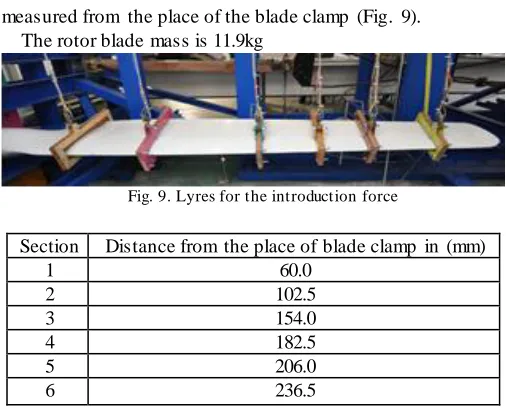
The rotor blade is loaded in six sections by lyres and
measured from the place of the blade clamp (Fig. 9). The rotor blade mass is 11.9kg
Fig. 9. Lyres for the introduction force
Section Distance from the place of blade clamp in (mm)
1 60.0
2 102.5
3 154.0
4 182.5
5 206.0
6 236.5
The experiment is performed in the accordance with IEC 61400-2 standard. The rotor blade failure is marked with the resulting force of 490.76 daN under maximum deflection of 27.999mm. After the testing is completed, some separations are recorded on the following distances (mm) (Fig. 10-12):
a)
b)
c)
Fig. 11. T he load distribution of each section in function of time
Fig. 12. T he resulting force distribution in function of time
III. TEST ING BY AFM/MFM MODE
The second part of the testing consists of comparing the critically loaded part with sub-critically loaded part.
The composite material is micro-glass fibers reinforced with epoxide resin. The impellers were exposed to critical load until failure and parts from critically and sub-critically loaded regions of wind turbine blade are investigated by Magnetic Force Microscopy (MFM). Magnetic force microscopy is able to provide characterization of surface and internal structure near surface of the sample, which is used in this paper to give analysis of structural change of material with different loads. Results and comparison of microstructure of two parts of wind turbine blade are analyzed and presented . Atomic Force Microscope (AFM) was also used to observe the surface morphology of the composite samples [5].
A. Measuring equipments
Fig. 13. T he JEOL SPM 5200
The scanning probe microscope used in this study is a SPM -5200 from JEOL, Japan. The SPM--5200 is a multipurpose,
high resolution scanning probe microscope offering ease of use with diverse measurement and sample environments (Fig. 13).
Fig. 14. T heCantilever with a sharp tip (probe)
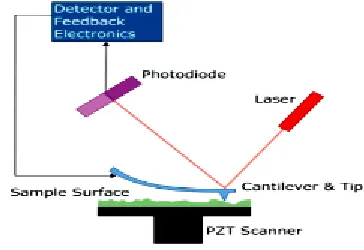
Typically, the deflection is measured using a laser spot reflected from the top surface of the cantilever into an array of photodiodes. TappingMode AFM is a more recent development in which the imaging probe is vertically oscillated at or near the resonant frequency of the cantilever (Fig. 14).
Electromechanical feedback maintains the oscillation at a constant amplitude during scanning. The image is produced by mapping the distance when the scanner moves vertically, to maintain the constant oscillation amplitude at each lateral data point (Fig. 15).
Fig. 15. Scheme of measurements using a laser
The key advantage of TappingMode is the elimination of the lateral shear forces present in contact mode, which, on many specimens, can damage the structure being imaged. TappingMode AFM can be conducted in an air or liquid environment (Fig. 16).
Fig. 16. AFM with a microscale cantilever and a sharp tip (probe)
that maps magnetic force gradient above the sample surface (Fig. 17). Unlike AFM, the MFM uses a probe tip coated with a thin film of ferromagnetic material. This kind of probe tip will react to the magnetic domains on the sample surface. The image of the sample is obtained with two-pass technique in which initial scan is used to obtain the topography of the sample. In the second scan, the tip-sample distance is increased and the biased tip is scanned along the topography line obtained from the first scan. The topographical line maintains constant tip sample distance, which equals the line of the constant van der Waals force.
Fig. 17. LiftMode to obtain both topography and magnetic force gradient
So, when the tip follows the topography line in the second scan, the van der Waals forces acting on the tip are kept constant. Thus, the only change in force affecting the signal is the change of the magnetic force. Magnetic property evaluation is based on the magnetic force gradient image that shows the qualitative distribution of the magnetic field within the scanned area, pointing to the local distribution of magnetic properties. The cantilever used in this study is produced by MikroMasch (Estonia) by trade name NCS18 Co -Cr. MFM probe is silicon etched probe tip that has conical shape. It is coated with Co and Cr layers, so resulting tip radius with the coating is 90nm. Full tip cone angle is 40°.
B. Results
Average of roughness:
0 0
1
( )
L aR
f s
Z ds
L
(1)
Root mean square roughness:
2 0 0 1 ( ( ) ) L
Rq f s Z ds
L
(2)
The 10-point average roughness is defined as the “sum of the average value of the absolute values of the deviation from the centerline between the largest deviation and the fifth deviation, and the average value of the absolute values of the deviation between the smallest deviation and the fifth deviation.
The 10-point average roughness is defined as the “sum of the average value of the absolute values of the deviation from the centerline between the largest deviation and the fifth deviation, and the average value of the absolute values of the
deviation between the smallest deviation and the fifth deviation.
1 2 3 4 5 1 2 3 4 5
10
p p p p p v v v v v
z z z z z z z z z z
Rzijs
(3)
The height z at the position d along the line is defined as: z=f(s). The height Zo of the centerline is defined as:
0 0
1 ( )
L
Z f s ds
L
(4)
Maximum difference between high (maximum value Z ) and low (minimum max value Zmin) (Rz) : Rz= Rmax-Rmin
C. Sample 1- Less Loaded
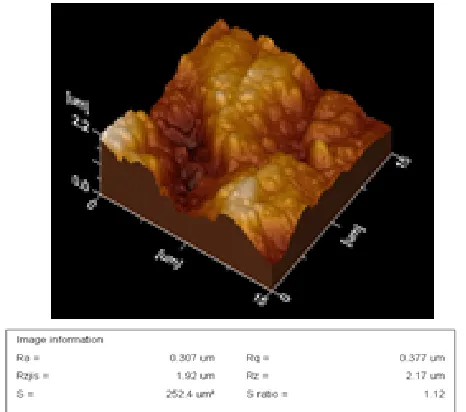
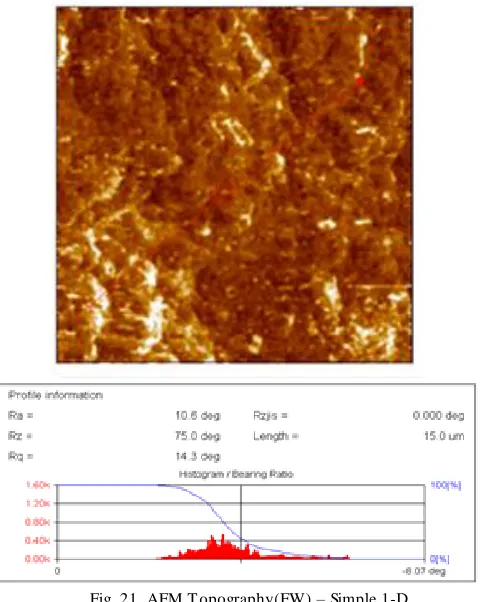
It is expected for the part of material that is less lo aded (Sample 1, shown on Fig. 18-21) to have less surface roughness as layers of silicone fibers held by epoxy will be more evenly aligned. AFM research shows that Sample 1 has smaller average surface roughness (Ra) by 200 nm than in Sample 2 which had higher load during the breaking of wind turbine. This could mean that inner layers of the material were deformed and may not be aligned as in their original position.
Fig. 19. AFM T opography(FW) – Simple 1-B
Fig. 20. AFM T opography(FW) – Simple 1-C
Fig. 21. AFM T opography(FW) – Simple 1-D
D. Sample 21- Higher Loaded
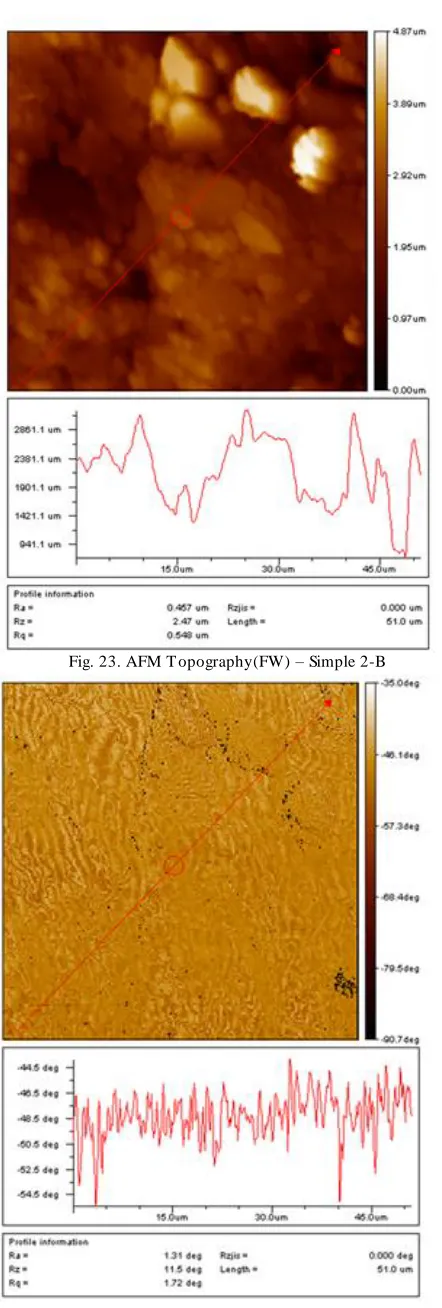
From the figures representing magnetic characteristics of the material it is apparent that Sample 1 has relatively uniform distribution of magnetic properties while Sample 2 has „‟black dots‟‟ which represent abrupt change in sample magnetization i.e. change in magnetic field gradient. The existence of so called „‟black dots‟‟ on the figure of higher loaded sample (Sample 2, shown on Fig. 22-25) indicates possible changes in material structure that is on its stratification upon loading.
Fig. 23. AFM T opography(FW) – Simple 2-B
Fig. 24. AFM T opography(FW) – Simple 2-C
Fig. 25. AFM T opography(FW) – Simple 2-B
IV. CONCLUSION
This experiment confirms that the wind turbine blade W55RBVS has very high rigidity.
Research by Atomic/Magnetic Force Microscopy shows that sample taken from part with higher load have largest surface roughness and height differences as it is expected. The existence of ‟‟black dots‟‟ (‟‟magnetic holes‟‟) indicates stratification inside the composite.
ACKNOWLEDGMENT
This research was supported by the Ministry of Science and Technological Development, Republic of Serbia – projects: TR35035, TR36001.
REFERENCES
[1] Č. Mitrović, N. Petrović, A. Bengin, D. Bekrić, V.Dragović,
A.Simonović, G. Vorotović, S. Radojević, D. Stamenković, “Structural T esting of Small Wind T urbine Blade up to Failure“, International Conference on Innovative Technologies. Conference IN-T ECH 2011, Bratislava, 2011.
[2] R.Backers , Eoltec Shirocco E5.6-6, Instalation&Maintanence Manual,
2009-20010, Solacity Inc.
[3] International standard IEC 61400-1, Wind turbines – Part 1: Design
requirements, Switzerland.
[4] International standard IEC 61400-2, Wind turbines – Part 2: Design
requirements for small wind turbines, Switzerland.
[5] N.Yahya, M.Kashif, H.Daud, H.Mohd Zaid, A.Shafie, N.Nasir,