ABILITY CONSIDERATION OF F-K AND SPAC
METHODS USING MICROTREMORS IN NORTH
OF IRAN
M. Esfahanizadeh1, M. Davoodi2, E. Haghshenas3, M. K. Jafari4
I. INTRODUCTION
Precise assessment of the S-wave velocity of the sub-layers has specific significance for the sites evaluation and other fields in earthquake study. One of the important points in estimating local site effects is the knowledge of basin structure: geometry of the interface between the filling and the bedrock, nature and thickness of the sediments. In most of the cities and urban areas of the world are founded on soft the soil composition is prone to amplify seismic waves. One of the most important environmental properties of the soil is shear-wave velocity. Nowadays by means of non destructive methods, shear-wave velocity of the subsurface layers of the earth are determined. By using microtremor in a single station or more to measure shear wave velocity of the earth layers many researchers and engineers are interested recently to evaluate different sites. For the low cost and lesser time consuming, compared to other Vs study methods such as boring and direct measurements, this method is now acceptable. Microtremor measurement is a very helpful method for obtaining ground dynamic character, together with the main period and the site amplification factor using H/V spectral ratios.
The solitary site microtremor method is based on using the H/V technique, introduced by Nakamura in 1989. This technique gives accurately the natural frequency of sedimentary deposits. Though, it has some margins in estimating the Vs profile due to its simultaneous dependency on sediment thickness and shear wave velocity. The shape of used sites are triangular, circular, semi-circular, orthogonal, of course most usual ones for array arrangement can be used. In the urban areas, use of each form depends on spatial limitations on organization of site stations and circular and semi-circular arrays mostly are used (Cara 2008).
The microtremor array methods are based on properties of surface wave and are as the alternative technique, which could give the Vs profile of a site. There are two main classes of array processing methods, the Frequency-Wave number (F-K) and the Spatial Autocorrelation (SPAC) methods.
1
Ph.D Student, Department of Civil Engineering, Science and Research Branch, Islamic Azad University, Tehran
2
Assistant Prof., International Institute of Earthquake Engineering and Seismology, Tehran. I.R. Iran
3
Assistant Prof. of IIEES, Tehran. I.R. Iran
4
Prof. of IIEES, Tehran. I.R. Iran
International Journal of Latest Trends in Engineering and Technology Vol.(8)Issue(1), pp.667-673 DOI: http://dx.doi.org/10.21172/1.81.087 e-ISSN:2278-621X
Abstract: In this research a set of microtremor array measuring was performed in site of Shaghayegh
Park-Tehran with goal of evaluating the shear wave velocity (Vs) profile for the layers close to the surface. The F-K array processing and SPAC techniques are used and the results are compared with other data particularly a 180 meter depth. The data in different times are compared with the real Vs profile. The results show the SPAC process is more suitable in comparison to the f-k method. SPAC technique shows similar results to the f-k method when few data stations are used for measuring with small dimensions. The dispersion curves obtained through processing each of subarrays were extracted and then compared with the dispersion curve obtained through shear wave velocity profile of Down Hole. At the end our results are compared with previous works and strength points are mentioned. This comparison indicated better efficiency of orthogonal arrays in the mentioned site.The assessment showed better efficiency of orthogonal arrays in the used site.
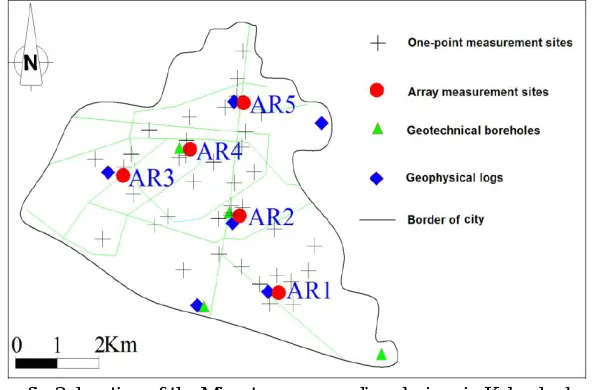
fig1: The place of the study 2.1 Geotechnical and seismic site Kelarabad
Geotechnical and geophysical studies in order to identify and geotechnical studies at the site had done. The location of the four holes are 73, 63, 43, 33 meter in different parts of the studied area with method of Wash Boring. During drilling operations impact test at different depths done. Test impact and influence common standard test to measure density especially in geotechnical investigations and assessment of granular soils consistency in fine-grained soils sticky are considered.
Subsurface soil conditions, obtained by the four holes, indicates that layers of soil in the study area is mainly sandy soils with clay, mud and sand is coarse particles. Geophysical studies to estimate the dynamic parameters of subsurface layers of elastic modulus and modulus shear wave velocity profile for dynamic analysis and accurate determination of compression and shear took place (Davoodi 2008).
2.2 Microtremor array registration on Kelarabad
fig 2: Installing devices for calibration and comparison
Collecting microtremor data on 21 to 23 March of 2009 is done; recording of the 13 hours each day often began 1 pm and lasted 10 am the next morning. It also uses a database of domestic and international networks of non-earthquake accelerometer in a radius of 333 km study area during data recording. The sampling frequency is 133 symbol/second (Nakamura 1989).
2.3 Micrometer measurement
Field measurements made by both methods, an array of measurement and measurement for single point. Measurement data in Kelarabad in the number 35 spots by a single point in five point method are recorded. The proposed method is only recorded data to consider Takes.
In Figure 5 Microtremor recording devices in the Kelarabad are shown (Paolucci 1999).
fig 3: location of the Microtremor recording devices in Kelarabad
Also, due to the international road near the site to the north, the traffic and pedestrians and vehicles are registered and in addition, because of the changing conditions of climate in northern of Iran, the climate air was collected at harvest time if it affects the data that is Microtremor study. A relationship in which Phase velocity than the wavelength or frequency changes, the property is called dispersion. Property distribution Specific surface waves on the surface of a layered environment are released and the waves are not observed volume. A curve that changes the phase velocity of the wave length or frequency show, called dispersion curve (Nourozi 2013).
Area is divided into five areas as AR1, AR2, AR, 3, AR4 and AR5 whereon AR1 denotes the oldest and grading through to AR5 which denotes the most recent formed alluvium.
Aki in 1965 settled a method to realize a phase-velocity dispersion curve from the microtremors data by a seismic array. He found the spatial cross-correlation coefficient as a function of frequency for a given
inter-station distance, r, and angular frequency, ω, ρ(r, ω), averaged over many different azimuths, τ, can be
written as (Berberian 1985).
0 2
0 1
(r, ) ( )
2 ( 0, ) ( , , )
r J
c
r r d
(1)where ρ (r = 0, ω) is the average autocorrelation function at the centre of the array,
(r,
, ω) is the cross -correlation function between the record at a site and the record gained at the site, c, is the phase velocity at frequency ω at the site, and J0 is the Bessel function of first kind and order zero. The power spectrum at frequency f and vector wavenumber k for an array of N is
1 1 , exp , 1 NP f k ij f ik rij
i j
(2) whereN = number of sensors.
fij
= cross-power spectrum between ith and jth sensors at frequency f.
i j ij r r
r (ri and rj are the position vectors of the ith and jth sensors).
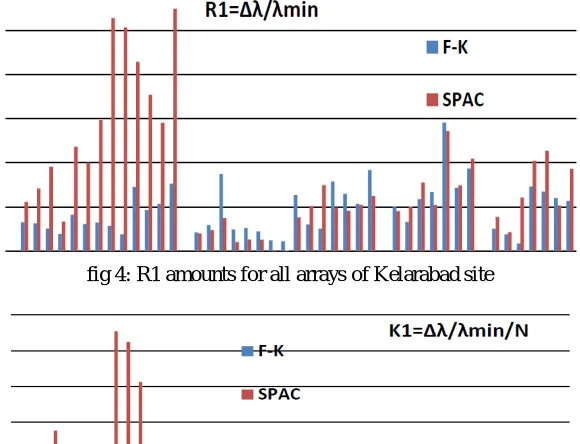
fig 4: R1 amounts for all arrays of Kelarabad site
fig 5: K1 amounts for all arrays of Kelarabad site
III. CONSIDERATIONS
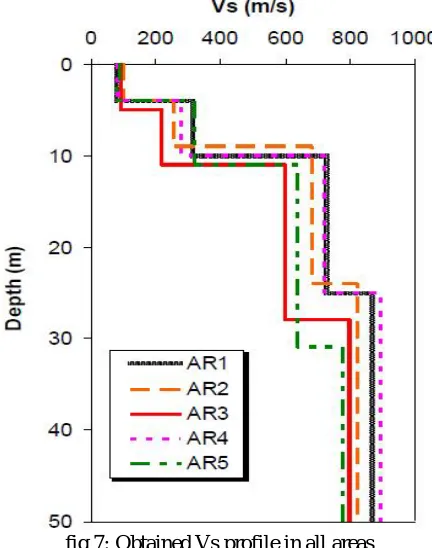
To find the shear wave profile of subsurface layers, neighbourhood algorithm is used. Different input models were considered for a parametric study. Based on obtained average results from f-k processing method, it seemed that Vs profile derived from array A is more consistent with previous site investigation results (Figure 5). The results of E-array (using f-k method) in several available times compared to the reference Vs profile (In- Hole investigations) are presented in Figure 8-a; Also for array A (SPAC) in Figure 8-b. Inversion processing results are shown in figure 6.Obtained Vs in all areas shown in figure 7.
fig 7: Obtained Vs profile in all areas
IV. EVALUATING THE PRECISION VALUES
Figure 8 shows examples of f-k spectra for four different size arrays using the records observed at JEP. The f-k spectra are calculated at 51
51 grid points at each frequency. This figure presents the f-k spectra at 2.73Hz, 1.66Hz, 0.98Hz and 0.49Hz from the records observed by the M-, L-, X- and D-arrays, respectively. The propagation direction () is measured clockwise from the north in degrees. We estimate the phase velocity (V) in km/sec from the maximum peak in the f-k spectrum.fig 8: f-k spectra plots for frequencies 0.42, 0.94, 1.66, and 2.73 Hz are calculated from microtremors records V. RESULTS AND CONCLUSION
estimated Vs values are larger than reference Vs values. Our method shows better results than Betting (2001).In this method, results are more precise in different frequencies also in comparison with Park (2004). Vs profiles in different times show precision of sensing the depth of layer in the low traffic times was more than high traffic times in the both f-k and SPAC methods. Sharp layer changes have been detected in the near of surface ground less than 10 meter Reliability of f-k method almost in the all arrays is more than SPAC method.
REFERENCES:
[1]. Askari, A., Azadi, M., Ghayamghamian, M.R., (2004) “Preliminary Seismic Microzonation of Bam.” Journal of Seismology and Earthquake Engineering (JSEE), Vol. 5, No. 4, PP. 69-80.
[2]. Berberian, M., Goreishi, M., Arjang, A. & Mohajer A., (1985) "Investigating of neoseismotectonics and seismicity and faulting in Tehran", 56th Report, Geological Survey of Iran, Tehran.
[3]. Bettig B., Bard P-Y, Scherbaum F, Riepl J, Cotton F, Cornou C, Hatzfeld D. (2001)“Analysis of dense array noise measurements using the modified spatial auto-correlation method (SPAC): application to the Grenoble area”. Bolettino di Geofisica Teorica Applicata; 42(3-4): 281-304.
[4]. Bonnefoy S, Cornou C, Kristek J, Ohrnberger M, Wathelet M, Bard P-Y, Moczo P, Faeh D, Cotton (2004),Simulation of Seismic Ambient Vibrations, 13th World Conference on Earthquake Engineering,Canada. [5]. Cara F, Di Giulio G, Galluzzo D, Foijtikova L, Maresca R, Moczo P, Rovelli A.(2003) “Predominent frequency variations
in the ambient noise recorded in the Colfiorito basin (Umbria, Italy)”. European Geophysical Society-American Geophysical Union – European Union of Geophysics Joint Assembly, Nice.
[6]. Cornou C. (2004). “Simulation of seismic ambient noise: I H/V and array techniques of canonical models”. Proceedings of the 13th World Conference on Earthquake Engineering, Vancouver, Canada. Paper no. 1120.
[7]. Davoodi M, Haghshenas E, Esfahanizadeh M, Mirjalili M, Atashband S.(2008) Evaluate reliability of f-k and SPAC methods, 14th World Conference on Earthquake Engineering, Englewood Cliffs, New Jersy.
[8]. Gardner, G. F., Gardner, L. W. and Gregory, A. R.,(1994) Formation velocity and density the diagnostic basic for stratigraphic trap, Geophysics, 39, 770-780.
[9]. Nakamura Y. (1989) “A method for dynamic characteristics estimation of subsurface using microtremor on the ground surface”. Quaterly Report Railway Tech. Res.; 30(1):25-30.
[10].Nourozi M. (2013), Application of Microtremor for Investigation of Sedimentary Basin Using Cross-Correlation Technique, M.Sc. thesis in IIEES, 2013.
[11].Paolucci, R, (1999) “Shear resonance frequencies of alluvial valleys by Rayleigh’s method”. Earthquake Spectra; 15(3):503:21.
[12].Park, C. B., Miller, R. D., Laflen D., Neb C., Ivanov, J., Bennett B., and Huggins R. (2004),Imaging dispersion curves of passive surface waves. SEG Expanded Abstracts 23, 1357-1360.