Laboratory Evaluation of Lime Modified Asphalt
Concrete mixes with respective to Moisture
Susceptibility
Md. Kamal Hossain
1and Faiz Ullah
2Abstract
—
This study is carried out to evaluate the effectiveness of lime as a modifier and also a replacement of stone filler in the road paving asphalt concrete mixtures. The control optimum Asphaltic Concrete (AC) mix without lime and the modified AC mixes with lime in varying percentage as substitute to crushed stone filler by the same amount in the mineral aggregate were prepared in laboratory for fabrication of the test specimens. Design asphalt content was obtained 5.8 % from Marshall Method of mix design. The same asphalt content was used for AC control mix and modified AC mixes with lime in 1.0%, 1.5%, 2.0% and 2.5% for preparation of test specimens. Marshall Stability and Indirect tensile strength tests were conducted on unconditioned and conditioned test specimens of AC Mix without lime and modified AC mixes with lime for evaluation of loss of stability and Tensile Strength Ratio. The results obtained from modified AC mixes with lime shows a reduction in loss of stability and increase in tensile strength ratio. The increase in tensile strength ratio was found 3.3%, 5.3%, 6.5% and 8.1% and loss of stability are 14.8%, 28.1%, 45.0% and 51.5% against the addition of 1.0%, 1.5%, 2.0% and 2.5% lime respectively in modified AC mixes. The tensile strength ratio and loss of stability are the parameters for assessing the effect of water susceptibility of AC mixes. Results of this study shows that the addition of lime up to 2.5 % in AC mixes produced with Bolaganj stone aggregate increased the resistance to adverse effect of water.Index Term
—
Asphalt Concrete, Marshall Stability, Tensile Strength Ratio.I. INTRODUCTION
On highways and urban roads many damaged spots can be seen after the seasonal rains, especially in eastern half of the Bangladesh where aggregate are comparatively weaker and sensitive to water. In the eastern part of the country the local available stone of Bolaganj is mainly used in aggregate production for the road pavement. Bolaganj stone have been reported to have an affinity towards water due to its hydrophilic character and AC mixes produced by using aggregate of these stone is susceptible to moisture and less durable thereby. In consideration of high annual rainfall and long rainy season, a necessity of modification of AC mixes is a need to control the moisture susceptibility aspects, which leads to stripping and raveling in the AC surfacing.
Considerable research and development has been done to achieve a mix which can satisfactorily resist the major distresses and water sensitively problems in pavements. One
This work was done in the Dhaka University of Engineering and Technology (DUET), Gazipur in order to update the Marshall testing
system and also as a part of second author‘s Master‘s by research.
1 Md. Kamal Hossain is a Professor of Department of Civil Engg., Dhaka
University of Engg. & Technology, Gazipur-1700, Bangladesh. (e-mail: drkamalhossain@yahoo.co.in)
2
Faiz Ullah isSenior Vice President, Intercontinental Consultants and Technocrates Pvt. Ltd., A-8, Green Park, New Delhi, India.
of the major steps towards this is achieved by incorporating additives in AC mixes to improve its temperature and water susceptibilities, especially for tropical climate regions. Use of additives to significantly improve the properties of the AC mixes such as temperature and water susceptibilities, strength and durability had been reported by researches in countries like USA, India and Saudi Arabia (Ronald and Epps, 1989). Such promising results could present a cure for different types of distress and deterioration in the pavement in Bangladesh. The study is designed to investigate the engineering properties of AC mixes modified with hydrated lime as part of the filler with regards to effectiveness and look for the improvements obtained as compared to conventional AC mix without lime.
II. RESEARCH BACKGROUND
Engineers face with serious problems with the quality of paving material. Often aggregates are transported from long distances at high cost because local aggregate supplies of high quality have been depleted. As a result, additives to AC mixes have been widely accepted by the paving industry for the present time. The concept of additives is logical, and results from laboratory testing look positive. Hydrated Lime, Calcium Hydroxide Ca (OH)2, commonly used in soil
stabilization have also traditionally been used in AC mixes as a filler to improve the properties. Lime has special binding qualities in addition to the role of filler. It has been used for the purpose of providing stiffening or reinforcement to the bitumen as well as ‗Filling in‘ the voids in the aggregate matrix.
1111603-04-8282 IJCEE-IJENS © August 2011 IJENS
bituminous mixes for use in highway construction. Sometimes, it is difficult to coat certain aggregate with bitumen because of their siliceous or acidic surfaces. Hydrated lime, which is highly alkaline, starts a chemical reaction that changes the character of the aggregate surfaces and neutralizes any acidic properties present in the aggregate. Adding hydrated lime often improves the coat-ability and bonding properties of bitumen to these aggregate (Boyoton, R. S., 1980). This research will focus on the effectiveness of lime as a modifier and also a replacement of stone filler in asphalt concrete mixture, which will play active roles in solving moisture susceptibility related problems of course aggregate.
III..MATERIAL AND METHODOLOGY
Material characterization consists of evaluation of engineering properties of component materials i.e., bitumen and aggregate, mix design include determination of design Asphalt content for layer gradation by Marshall procedure and moisture susceptibility tests covers Marshall stability and Indirect tensile strength determinations.
A. Aggregate
Bolagonj Boulder stone is the only source of stone, locally available in Eastern Part of the Bangladesh. Hence the aggregate of this stone source is chosen for the present study. The aggregate fractions for the study have been collected from stone crushing plant at Dhaka. Crushed stone fine aggregate containing fines which is a by-product from stone crushing also collected from the same plant for use as fine aggregate and filler in the experimental work of this study.
The aggregate were subjected to testing as per ASTM standard test methods to evaluate the properties which are of significance for AC mix aggregate. The tests include Loss Angles abrasion test, Water absorption test, soundness test, abrasion test, and specific gravity test for coarse and fine aggregates. The test results together with specification limits of (Roads and Highways Department) RHD are summarized in Table I. These results are in agreement with RHD specification limits for AC wearing course.
B. Bitumen/Asphalt cement
Bitumen of grade 80/100 penetration is used in experimental works of this study and collected from the sealed container/drum manufactured by Eastern Refinery, Chittagong. The main reason of using this grade is its wide use in all road projects in the country being the single refinery in Bangladesh. A series of tests including penetration, specific gravity, softening point, thin film oven (TFO) test, flash point, ductility, and solubility in carbon tetrachloride were conducted for the basic characterization properties of penetration grade asphalt. The test results are shown in Table II, which complies with the requirement of RHD specifications.
TABLEI
TEST RESULTS OF AGGREGATE
TEST Wearing course RHD
Specifications
Los Angles.
Abrasion, % 33.4 35 Max.
Specific Gravity Bulk O. D. Apparent
CA 2.67 2.75
FA 2.61 2.70
P G 2.63 2.73
2.5 Min.
Water Absorption, % 1.08 1.29 1.40 2 Max. Soundness, % Loss 8.2 5.2 6.3 10 Max. Apparent Specific
Gravity of Lime 2.72
Coating and Stripping
of Bitumen, % 95
Min. 95% retained Broken faces
(retained 4.75 mm) 2 or more faces, %
86 75% Min.
Flakiness Index 24 25 Max.
Plasticity Index Non-plastic 3 Max.
Clay lumps and
friable particles, % 0.09 1 Max.
Lightweight
pieces, % 0.10 1 Max.
Sand Equivalent 53 50 Min.
TABLEIII
TEST RESULTS OF BITUMEN
Physical Properties Test Results
RHD Specification Fresh Sample
Specific gravity, @ 25 oC 1.025 1.01 – 1.05 Penetration dmm @ 25o C 82 80 - 100 Softening Point in oC 49 45 – 52 oC Flash Point, Cleavland Open
Cup, o C 320 250 Min
Solubility in carbon
Tetrachloride 99.8 99 Min.
Thin Film Oven (TFO) Sample
Percent loss (TFO) 0.057 0.1 Max.
Penetration dmm @ 25oC 65 64 Min.
C. Filler
Fillers used in this study are: 1) Crushed Stone fillers
2) Crushed stone filler with hydrated lime Crushed stone filler (0.075 mm finer material) supplemented to the combined mineral aggregate from crushed stone fine aggregate (FA). Hydrated lime was added in four different percentages (1%, 1.5%, 2% and 2.5%) in mineral aggregate of Modified AC mixes. Hydrated Lime collected from local vendors to ensure availability in future. In both types the percent finer than 0.075 mm determined and found to greater than 75 and acceptable in reference of specifications for filler.
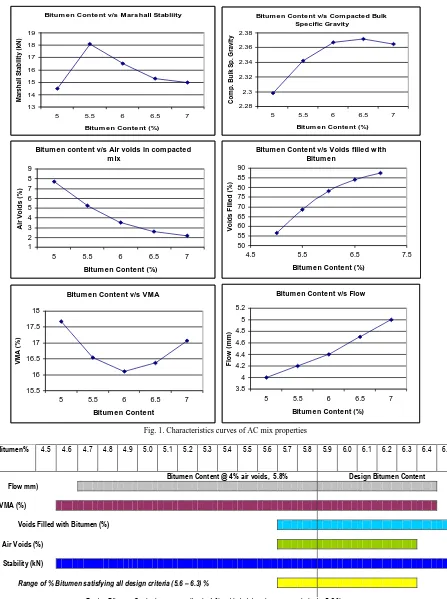
D. Design Asphalt content
Specific gravity and the median of specified voids (i.e. 4%) is noted. The optimum bitumen content of the AC mix then calculated as the numerical mean of the bitumen contents as noted above and found to be 5.9%. This procedure of determining the optimum bitumen content has been revised by a new procedure. The design bitumen content as worked out is found to be 5.8% (by weight of mix) and shown in the
Fig. 2.
After studying the test results, it is found that for the selected aggregate gradation, the Design Asphalt Content required is 5.8% (by weight of the mix). This Design Asphalt Content will be used in preparing further mixes and test specimens with addition of different percentages of lime to substitute the crushed stone filler. The prepared mixes
Bitum e n Conte nt v/s Mars hall Stabliity
13 14 15 16 17 18 19
5 5.5 6 6.5 7
Bitum e n Conte nt (%)
M
ar
sh
al
l S
ta
b
ili
ty
(
kN
)
Bitum en Content v/s Com pacted Bulk Specific Gravity
2.28 2.3 2.32 2.34 2.36 2.38
5 5.5 6 6.5 7
Bitum en Content (%)
C
o
m
p
.
B
u
lk
S
p
.
G
ra
v
it
y
Bitum en content v/s Air voids in com pacted m ix
1 2 3 4 5 6 7 8 9
5 5.5 6 6.5 7
Bitum en Content (%)
A
ir
V
o
id
s
(
%
)
Bitum en Content v/s Voids filled w ith Bitum en
50 55 60 65 70 75 80 85 90
4.5 5.5 6.5 7.5
Bitum en Content (%)
V
o
id
s
F
il
le
d
(
%
)
Bitum en Content v/s VMA
15.5 16 16.5 17 17.5 18
5 5.5 6 6.5 7
Bitum en Content
V
M
A
(
%
)
Bitum en Content v/s Flow
3.8 4 4.2 4.4 4.6 4.8 5 5.2
5 5.5 6 6.5 7
Bitum en Content (%)
F
lo
w
(
m
m
)
Fig. 1. Characteristics curves of AC mix properties
Bitumen% 4.5 4.6 4.7 4.8 4.9 5.0 5.1 5.2 5.3 5.4 5.5 5.6 5.7 5.8 5.9 6.0 6.1 6.2 6.3 6.4 6.5
Bitumen Content @ 4% air voids, 5.8% Design Bitumen Content Flow mm)
VMA (%)
Voids Filled with Bitumen (%)
Air Voids (%)
Stability (kN)
Range of % Bitumen satisfying all design criteria (5.6 – 6.3) %
Design Bitumen Content corresponding to 4 % voids in laboratory compacted mix: 5.8 %
1111603-04-8282 IJCEE-IJENS © August 2011 IJENS
will be subjected to further tests, such as Marshall Stability loss, Indirect Tensile Strength on lime modified mix in varying doses of lime.
The mix design methods are the process and procedures to establish the aggregate particle size distribution and to determine the corresponding design asphalt content that would let the AC mix to perform satisfactorily, particularly with respect to stability and durability aspects. There are many mix design methods used throughout the world such as Marshall Mix design method, Hubbard field mix design method, Hveem Mix design method, Asphalt Institute‘s Triaxial method of mix design etc. Out of these Marshall mix design method is used in this study.
E. Marshall Mix Design Method
The Corps of Engineers selected a testing machine and a method of bituminous mix design conceived by Bruce Marshall of Mississippi State Highway Department. The Marshall Test procedure has been standardized by the American Society for Testing and Materials by ASTM designation D-1559 ―Resistance to Plastic Flow of Bituminous Mixtures Using Marshall Apparatus‖. The procedure and design criteria, is adopted by RHD with some modifications to suit the environmental conditions in Bangladesh and shown in Table III.
TABLEIIIII
MIX DESIGN CRITERIA FOR AC MIX (RHD SPECIFICATION)
Marshall Mix Criteria
Min. Max.
Compaction (No. of blows on each face) 75
Stability, kN 8.2 -
Flow, mm 2.5 4.5
Percent Air Voids 3 5
Percent voids in mineral aggregate 15 20 Marshall Stability Flow Ratio 2.5
Percent Voids filled 70 85
Percent Bitumen Content 5.5 6.5
Percent Loss of Stability on immersion 25
F. Moisture Susceptibility Tests
Following tests were carried out on the Optimum AC mix without lime and modified AC mixes with lime in varying percentages to characterize the mix behavior in respect of moisture susceptibility aspects. The tests which were conducted to analyze the effects are:
1. Marshall Stability and Flow test of conditioned and unconditioned compacted mixes for Loss of Stability.
2. Indirect Tensile Strength of conditioned and unconditioned compacted mixes for Tensile Strength Ratio.
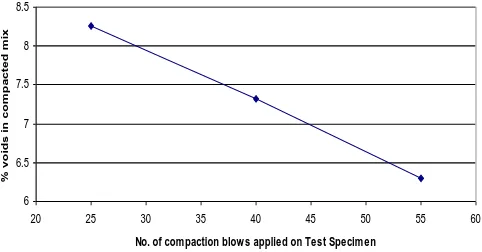
Establishment of compaction effort for 7 % voids: Standard Test procedure for Indirect Tensile Strength requires testing on specimen having voids 6 to 7 %. As such the compaction effort, the number of blows to be applied on the test specimen during its preparation has to be established. To establish this, test specimens at design bitumen content 5.8% (by weight of mix) prepared by applying 25, 40 and 55 number of blows of Marshall hammer on each face of the specimens. Percent air voids in the compacted test specimen
computed using bulk SG of specimen and the maximum SG of the mix. A characteristics curve, number of blows verses air voids drawn and corresponding to 7% air voids the numbers of blows as 44 blows obtained and shown in Fig. 3.
6 6.5 7 7.5 8 8.5
20 25 30 35 40 45 50 55 60
No. of compaction blow s applied on Test Specimen
%
v
o
id
s
i
n
c
o
m
p
a
c
t
e
d
m
ix
Fig. 3. Number of blows applied on the specimen v/s air voids
Schedule of Tests: To study the effect of lime as modifier on characteristics of designed mixes, AC mixes with 0%, 1%, 1.5%, 2.0% and 2.5% of lime as a replacement of crushed stone fines filler were prepared. AC mix with no lime (0% lime) represents the control mix and lime added mix represent the lime modified mix
A set of six test specimens were prepared using 75 blows of hammer on each face to determine the loss in stability each for no lime and added lime in varying percentages. Similarly a set of eight test specimens were prepared using 44 blows of hammer to get 7 %air voids in the compacted mix for no lime and added lime in varying doses of lime. The test specimens prepared with 75 blows were tested for stability after immersion in water at 600C for 35 minutes and 24 hours to determine the loss in Stability. The test specimens prepared with 44 blows of hammer were subjected to Indirect tensile strength test on un-conditioned (after 2 hours soaking in water at 250C) and conditioned specimens (24 hours immersion in water at 600C plus 2 hours immersion in water at 250C) to determine the Tensile Strength Ratio (TSR). Distribution of the test specimen for each type of test is shown in Table IV.
TABLEIVV
SCHEDULE OF TETS FOR WATER SUSCEPTIBILITY OF AC MIXES
Test Control
Mix
Lime modified Mix
1% 1.5% 2% 2.5 %
Marshall Stability for Loss of
Stability @ 60o C 6 6 6 6 6
Indirect Tensile Strength for Tensile Strength Ratio
@ 25oC (2 hrs) 4 4 4 4 4
@ 60oC (24 hrs)
+ @ 25oC (2 hrs)
4 4 4 4 4
IV. RESULTS AND DISCUSSION
Results of laboratory testing carried out to evaluate the engineering properties of the optimum AC mix without lime and modified AC mixes with lime in varying percentages is discussed in this section. A statistical approach has been adopted in the analysis of test data using the standard deviation values adjusted for 90 % confidence level. The evaluation of results has been carried in reference to the results for same properties of the optimum AC mix without lime to quantify the benefits achieved for resistance to adverse effect of water.
Marshall Stability Analysis at 60o C after 35 minutes and 24 hours of immersion in water was performed to estimate the loss of stability of the modified mixes. This has led to the results is shown in Table V for the Optimum AC mix without lime (control mix) and modified AC mixes with lime in varying percentages (lime modified mixes). The loss of stability as obtained for control mix is in the order of 23 percent. This value is very close to the maximum permissible value of 25 percent, set forth by the Roads and Highway department (Bangladesh) specifications. The analysis of the results of loss of stability of lime modified AC mixes by adding up to 2.5% lime show that there is reduction in loss of stability. The stability losses with 1.0%, 1.5 %, 2.0% and 2.5% addition are 19.7%, 16.6%, 12.7 and 11.2 respectively and show a trend of proportionate reduction with increase in added percentage of lime.Similar research has been done by Beg M. G. (1995) in Kingdom of Saudi Arabia. He mentioned that the addition of hydrated lime in AC mix has been found to be effective in reducing the damaging effect of water. The damaging effect of water has been also studied in USA on lime modified AC after 35 minutes and 24 hours of immersion in water was performed to estimate the loss of stability of the modified mixes. This has led to the results is shown in Table V for the Optimum
AC mix without lime (control mix) and modified AC mixes with lime in varying percentages (lime modified mixes). The loss of stability as obtained for control mix is in the order of 23 percent. This value is very close to the maximum permissible value of 25 percent, set forth by the Roads and Highway department (Bangladesh) specifications. The analysis of the results of loss of stability of lime modified AC mixes by adding up to 2.5% lime show that there is reduction in loss of stability. The stability losses with 1.0%, 1.5 %, 2.0% and 2.5% addition are 19.7%, 16.6%, 12.7 and 11.2 respectively and show a trend of proportionate reduction with increase in added percentage of lime.Similar research has been done by Beg M. G. (1995) in Kingdom of Saudi Arabia. He mentioned that the addition of hydrated lime in AC mix has been found to be effective in reducing the damaging effect of water. The damaging effect of water has been also studied in USA on lime modified AC mixes containing Baghouse fines and designed by Superpave mix design method and found to be more resistant to the effects of water (Shidhore A. V., 2005).
A reduction of 0.1 mm to 0.3 mm in the flow value of the lime modified AC mixes is observed in comparison of control mix. The reduction in flow value is proportionate to the percentage of added lime replacing the stone filler. This is an indication for the improvement in resistance to rutting on the road, while experiencing the repetitions of traffic load under hot climate. This is in agreement with the finding of Peterson J. C. (1987).
Percent reduction in loss of stability of lime modified AC mixes in doses of 1%, 1.5%, 2%, 2.5% while comparing with loss of stability of control mix (without lime) are14.58, 28.08, 44.92, 51.54 respectively.
The results of Indirect Tensile Strength test of control mix with no lime and lime modified mixes in varying percentages of lime are shown in Table VI. It is observed from the results that addition of lime can increase the TABLEV
STABILITY AND FLOW DATA FROM MARSHALL TESTS
Mix Type
Marshall Stability
(kN), at 600C for
35 min.
Marshall Stability (kN), at 600C for 24
hrs.
Loss of Stability
(%)
Improvement in Stability/Reduction
in loss of Stability (%)
Marshall Flow (mm), at 600C for 35
min.
Marshall Flow (mm), at 600C for 24 hrs. Control
mix
No lime 17.18 13.21 23.11 0 4.27 5.10
Lime modified
1.0 % 17.17 13.78 19.74 14.58 4.25 5.03
1.5 % 16.91 14.21 16.62 28.08 4.23 5.01
2.0 % 16.80 14.66 12.73 44.92 4.10 4.90
2.5 % 16.61 14.75 11.20 51.54 4.10 4.80
TABLEVI
SPLIT TENSILE STRENGTH AND TENSILE STRENGTH RATIO OF VARIOUS MIXES
Mix Type
Split tensile Strength after 2 hrs at 250C.
Split Tensile Strength after (24 hrs at 600C + 2 hrs at 250C)
Tensile Strength Ratio (%)
% gains
Control No lime
540.4 426.5 78.9 0.0
Lime modified
1.0 % 616.7 502.8 81.5 3.30
1.5 % 554.6 460.6 83.1 5.32
2.0 % 548.4 461.4 84.1 6.59
1111603-04-8282 IJCEE-IJENS © August 2011 IJENS
Indirect Tensile strength of conditioned specimens (soaked in water at 60 0C for 24 hours plus at 25 0C for 2 hours) of modified AC mixes to achieve the desired target of Tensile Strength Ratio (TSR). In comparison to the TSR of control mix (without lime), there is increase in TSR of lime modified mixes by 3.3%, 5.3%, 6.6% and 8.1% when 1%, 1.5%, 2% and 2.5 lime is added respectively to replace the crushed stone filler in AC mix. Similar behavior was also observed by Thomas, W. K. (1984).
The effects of lime addition in varying percentages to modify the AC mixes are analyzed statistically using the data obtained from the tests performed on the control optimum AC mix without lime and modified AC mixes with lime. The data from the Marshall Stability test and the Indirect Tensile Strength test for estimating the percent loss of stability and Tensile Strength Ratio has been adjusted for statistical corrections and deviations to define the Limits. The Upper Limit (UL) and the Lower Limits (LL) for population mean has been established using the computed Standard Deviation for 90% confidence levels separately. Statistical analysis of the results of Marshall Stability on test specimen after 35 minutes and 24 hours when soaked in water at 60 0C reveals that ―different percent of added lime have equal means‖. This indicates that there is an effect on the results when lime is added to replace the crushed stone
filler and to modify the AC mixes with lime. The Loss of stability is getting reduced proportionately with increase in percentage of amount of added lime. Details of these are shown in Tables VII for stability after 35 minute immersion in water and that of stability after 24 hours in Table VIII, when soaked in water maintained at 60 0C. Loss of Stability as estimated from the results is shown in Table IX. Upper Limit and Lower Limit have been defined by the adding and subtracting the standard deviation value adjusted for 90 % confidence level from the arithmetic mean value. In estimation of loss of stability three situations from the Upper Limit, Lower Limit and combination for most critical situation have been considered for 90% confidence levels and shown in Table IX.
Statistical analysis on the test data of Indirect Tensile Strength after immersion in water at 2 hours at 25 0C and (24 hours at 600C+2 hours at 250C) also reveals that there is an effect of lime addition on the results. The results of Indirect Tensile Strength are shown in Table X for unconditioned (2 hours of immersion) specimen and in Table XI for conditioned (24 hours + 2 hours immersion) specimens for different AC mixes. The Tensile Strength Ratio (TSR) results as estimated from the results in consideration of standard deviation adjusted for 90% confidence level are shown in Table XII.
TABLEVII
MARSHALL STABILITY (KN) AFTER 35 MIN IMMERSION IN WATER AT 600C
% Lime added to replace Stone Filler
0.0 1.0 1.5 2.0 2.5
Test Specimen - 1 17.34 16.88 16.88 16.73 16.70
Test Specimen - 2 16.88 17.46 17.06 16.78 16.12
Test Specimen - 3 17.32 17.17 16.78 16.88 17.02
Mean 17.18 17.17 16.91 16.8 16.61
Variance 0.0676 0.081 0.0202 0.0059 0.2082
Standard Deviation 0.260 0.285 0.142 0.077 0.456
UL for 90% Confidence Level 17.600 17.64 17.14 16.92 17.36
LL for 90% Confidence Level 16.750 16.7 16.68 16.67 15.86
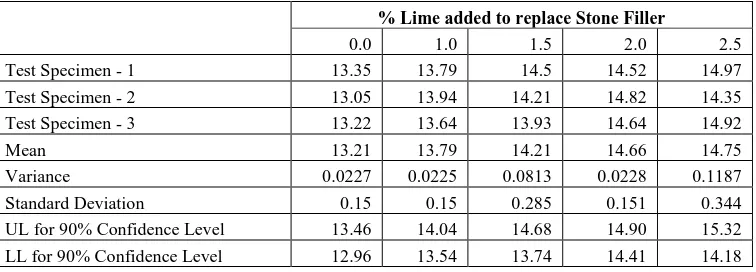
TABLEVIII
MARSHALL STABILITY (KN) AFTER 24 HRS IMMERSION IN WATER AT 600C
% Lime added to replace Stone Filler
0.0 1.0 1.5 2.0 2.5
Test Specimen - 1 13.35 13.79 14.5 14.52 14.97
Test Specimen - 2 13.05 13.94 14.21 14.82 14.35
Test Specimen - 3 13.22 13.64 13.93 14.64 14.92
Mean 13.21 13.79 14.21 14.66 14.75
Variance 0.0227 0.0225 0.0813 0.0228 0.1187
Standard Deviation 0.15 0.15 0.285 0.151 0.344
UL for 90% Confidence Level 13.46 14.04 14.68 14.90 15.32
V. CONCLUSIONS
Based on the laboratory tests, its interpretation and evaluation, the following conclusions are drawn:
-
Incorporation of hydrated lime in varying doses to replace the crushed stone fines filler by the same amount has resulted in change in the engineering properties of the AC mixes. stress.-
Results of modified AC mixes with lime show a resistance towards the adverse effects of water on compacted mix on the pattern of, increase in quantity of added lime, increases the resistance against the adverse effects of water. In comparison to the AC mix without lime, an increase in Tensile Strength Ratio is achieved by 3.3%, 5.3%, 6.5% and 8.1% corresponding to 1.0%, 1.5%, 2.0% and 2.5% lime addition respectively. Also a reduction in the loss of stability of 14.8%, 28.1%, 44.95 and 51.5% corresponding to 1.0 %, 1.5%, 2.0% and 2.5% lime addition TABLEIX%LOSS OF STABILITY AFTER 24 HOURS IMMERSION IN WATER AT 600C
% Lime added
0.0 1.0 1.5 2.0 2.5
on UL basis 23.52 20.41 14.35 11.94 11.75
on LL basis 22.63 18.92 17.63 13.56 10.59
on Critical basis 27.7 24.55 20.38 15.06 20.05
TABLEX
INDIRECT TENSILE STRENGTH (KPA) AFTER 2 HRS IMMERTION IN WATER AT 250C (UN-CONDITIONED SPECIMENS)
% Lime added to replace Stone Filler
No lime(0) 1.0 1.5 2.0 2.5
Test Specimen - 1 545.3 606.6 563.2 548.6 555.60
Test Specimen - 2 556.7 620.5 550 546 579.7
Test Specimen - 3 536.1 632.6 563.8 544.9 558.1
Test Specimen - 4 523.4 607.1 541.2 554 570.4
Mean 540.38 616.7 554.55 548.38 565.95
Variance 199.062 151.807 119.771 16.469 125.871
Standard Deviation 14.109 12.402 10.944 4.058 11.219
UL for 90% Confidence Level 563.59 637.1 572.55 555.06 584.41
LL for 90% Confidence Level 517.17 596.3 536.55 541.7 547.49
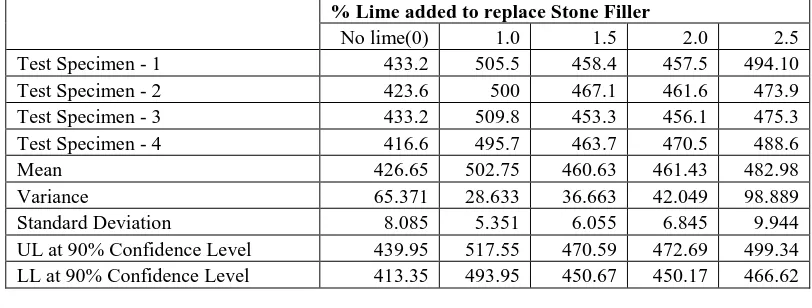
TABLEXI
INDIRECT TENSILE STRENGTH (KPA) AFTER 2 HRS IMMERTION IN WATER AT 600C, FOLLOWED BY 2 HRS AT 250C (CONDITIONED SPECIMENS)
% Lime added to replace Stone Filler
No lime(0) 1.0 1.5 2.0 2.5
Test Specimen - 1 433.2 505.5 458.4 457.5 494.10
Test Specimen - 2 423.6 500 467.1 461.6 473.9
Test Specimen - 3 433.2 509.8 453.3 456.1 475.3
Test Specimen - 4 416.6 495.7 463.7 470.5 488.6
Mean 426.65 502.75 460.63 461.43 482.98
Variance 65.371 28.633 36.663 42.049 98.889
Standard Deviation 8.085 5.351 6.055 6.845 9.944
UL at 90% Confidence Level 439.95 517.55 470.59 472.69 499.34
LL at 90% Confidence Level 413.35 493.95 450.67 450.17 466.62
TABLE XII
TENSILE STRENGTH RATIO (TSR)
% Lime added to replace Stone Filler
No lime(0) 1.0 1.5 2.0 2.5
on UL basis 78.06 81.24 82.19 85.16 85.44
on LL basis 79.93 82.84 83.99 83.1 85.23
1111603-04-8282 IJCEE-IJENS © August 2011 IJENS
is observed. The reduction in loss of stability and enhancement in TSR are in comparison of the properties of AC mix without lime.
- The increase in TSR and increase in resistance towards loss of stability are commensurate with increase in quantity of added lime. The TSR values as obtained by adding 1%, 1.5%, 2.0% and 2.5% of lime are 81.5%, 83.1, 84.1 and 85.3 % respectively. The added lime shall be decided to satisfy the applicable specifications which vary from 80% to 85% of TSR depending on the climatic conditions.
ACKNOWLEDGMENT
The second author acknowledge to the Department of Civil Engineering for giving financial assistance and guidelines for his Master‘s study in the DUET, Gazipur of Bangladesh. The valuable discussion and suggestions with Professor Nuruzzaman of DUET is also acknowledged. The first author acknowledges the help of his colleagues Mr. Abdar Hossain, assistant technical officer help and mental support during the Marshall test.
REFERENCES
[1] Beg, M. G., ―Laboratory evaluation of headmanites and lime modified asphalt concrete mixes‖, M. Sc. Thesis, King Fahad University of Petroleums and Minerals, Darhran, Saudi Arabia, 1995. [2] Dorrence, S. M. P. and Peterson J. C., ― Identification of chemical
types in asphalt‘s strongly absorbed at the asphalt-aggregate interface and their relative displacement by water‖. Proc. AAPT, 1977Vol. 46, pp. 151-175l.
[3] Little, D. N. and Epps, J. ― The benefits of hydrated lime in hot mix asphalt‖, Report for national lime association, 2001.
[4] Peterson, J. C., ―Lime treatment of asphalt to reduce age hardening and improve flow properties‖ Presentation at the Annul meeting of AAPT, Reno,Nevada, Feb, 1987, pp. 23-25.
[5] Robert S. B., ―Chemistry and technology of lime and limestone‖, Second Edition, John Wiley &Sons, New York, 1980.
[6] Ronald, L. T., and Epps, A. J., ―Using additives and modifiers in hot mix asphal.‖ National Asphalt Paving Associations, NAPA. Report No. –QIP 114A, 1989. PP. 03-10.
[7] Shidhore A. V.,‖Use of lime as anti-strip additive for mitigating moisture susceptibility of asphalt mixes containing baghouse fines‖, M. Sc. Thesis, North Carolina State University, Raleigh, 2005.
[8] Sebaaly, P. E., Hilty, E. and Weizel, D. ―Effectiveness of lime in hot
mix asphalt pavement‘. University of Nevada,. Reno, 2001, http://www.wrscunt.edu/WRSCMoisture_files/repor.pdf.
[9] Thomas W. K and James, N. A., ―Techniques for reducing moisture damage in asphalt mixtures‖, Research Report, University of Texas at Austin, Nov. 1984.
ABOUT THE AUTHORS
Dr. Md. Kamal Hossain is a Fellow of Institute of Engineers, Bangladesh
(IEB). He is a Professor of department of civil engineering in Dhaka University of Engineering & Technology (DUET), Bangladesh. He received B. Sc. Eng. (Civil) from BUET, Bangladesh in 1993 and M. Sc. Engg. (Civil & Transportation) from the same University in 1997 and Ph. D. in 1999 from UKM Malysia.. He has born in Khulna district of Bangladesh in December 01, 1968. His research interest includes soil improvement, laboratory based element and model tests of soil, small strain stiffness properties, dynamic properties of soil, geotechnical earthquake engineering.
Faiz Ulllah is a Fellow of Institute of Engineers, India and Institution of Engineers, Bangladesh. He is a highway & geotechnical consultant and presently with Intercontinental Consultants and Technocrates Pvt. Limited, New Delhi, India as Senior Vice President. He received B. Sc. Engg. (Civil) from AMU Aligarh, India in 1975and M. Engg. (Transportation Engg.) from Dhaka University of Engineering & Technology, Bangladesh in 2009. He born in Basti district of Uttar Pradesh, India on January 01 1954. His research interest includes pavement design and rehabilitation, laboratory