Wavelet Based Classification of Finger Movements
Using EEG Signals
1
R. Shantha Selva Kumari, 2 P. Induja
1
Senior Professor & Head, Department of ECE, Mepco Schlenk Engineering College Sivakasi, Tamilnadu, India
2
PG Student, Department of ECE, Mepco Schlenk Engineering College Sivakasi, Tamilnadu, India
Abstract - Brain-computer interfaces (BCIs) have been examined in the field of bio-medical engineering. This brain-computer interface method is very useful for the people who are suffered by some nervous disorder to control or operate the external devices. EEG dataset are acquired and these signals are processed for identifying the brain thoughts to control the device. Here we proposed the method for the classification of the finger movements using EEG signals which are used in the application of artificial upper limb. This method includes pre processing, feature extraction and feature classification. Pre processing includes the removal of artifacts in the EEG signals due to some noises like eye blinking, etc. Discrete Wavelet Transform is used for the feature extraction. Features in both time domain and frequency domain are evaluated on the various EEG Signals. Based on the features extracted from various EEG signals, they are classified for the different finger movements using SVM classifier. The accuracy of 96.67% has been achieved for the proposed finger movement’s classification.
Keywords - Brain Signals, Electroencephalogram (EEG), Discrete Wavelet Transform, Support Vector Machine (SVM).
1. Introduction
Brain Computer Interface is a communication pathway between the brain and an external device. Any natural form of communication or control requires peripheral nerves and muscles in a human body. This mode of communication is the most useful application for the people to communicate or operate any device who are attacked by some nerve diseases. In this interface, the brain signals are extracted and the device will operate based on the thinking of the person. The commonly used brain signal is the Electroencephalogram (EEG) signal. The reasons for the usage of EEG signals are it is easily recorded and it is also processed with the help of the inexpensive equipment [1].
1.1 EEG Signals
EEG signals which are easily recorded in a non-invasive manner by placing electrodes on the scalp. The international 10-20 system is followed to the placement of electrodes on the scalp that has been standardized by the American Electroencephalographic Society. EEG signals contain a set of signals which are classified according to their frequency. These frequency bands from low to high are referred to as delta (δ), theta (θ), alpha (α), beta (β), and gamma (γ) respectively. The delta band which lies below 4 Hz. These are only observed in adults in deep sleep state. Theta waves which lie within the 4 to 7 Hz range have a large amount of frequencies in young children and adults in drowsy or sleepy states. Alpha waves lie within the 8 to 12 Hz range. The amplitude of the alpha waves increases when the eyes are closed and the body relaxation. Alpha waves lie within the 8 to 12 Hz range. These are found over the occipital region in the brain. The amplitude of the alpha waves increases when the eyes are closed and the body relaxation but if there is a presence of any mental effort or the opening state of eyes, they will attenuate. Mu rhythms may present in the range where the alpha rhythms present, but there are some important physiological differences between them. Beta rhythms lie within 12 to 30 Hz range. They are related to the motor activities of the brain. Gamma band waves occupy the frequency ranging from 30 to 100 Hz. These band signals are used very less in EEG based BCI systems because the artifact signals are likely to affect them [2].
1.2 EEG Recording Systems
non-invasive method. The EEG signals which acquire from the scalp are processed by the amplifiers to enlarge the amplitude of the analog signal. Due to this amplification of the amplitude of the EEG signals the A/D converter can digitalize the signal in a more accurate way. The recording device may be a personal computer or store and displaying data. The potential difference between signal or active electrode and reference electrode is measured as the EEG signal over time. An additional third electrode which is used to measure the difference voltage between the active electrode or signal electrode and the reference points is referred as ground electrode.
Therefore EEG signal measurement contains three electrode of one active, one reference and one ground electrode [4]. There are up to 128 or 256 active electrodes in multi channel configurations. Silver Chloride (AgCl) is used to make these electrodes. The contact impedance between the electrode and scalp should be in the range of 1 kΩ and 10 kΩ to record the accurate signals. The electrode-tissue interface behaves as a low pass filter because it is resistive as well as capacitive. The impedance is dependent on the several factors such as the interface layer, electrode surface area and temperature. The conductive path between the skin and each electrode is created by EEG gel that reduces the impedance. Electrodes which do not need to use of gels called ‘dry electrodes’. It has been made with other materials such as titanium and stainless-steel [4]. These electrodes may be dry active electrodes which have pre amplification circuits for dealing with very high electrode/skin interfacial impedances. The dry passive electrodes have no active circuits. They are linked with EEG recording systems of ultra high input impedance. The amplitude is in the order of micro volts for electro bio signals which are very sensitive to electronic noise. Background noise is generated by the external sources such as power lines. Internal sources generate thermal, shot, flicker and burst noises. To reduce the effects of the noise such as electromagnetic interference shielding or to the reduction of common mode signal design considerations should be addressed [2].
2. Related Works
Arnaud Delorme created a statistical framework that is based on Gaussian Mixture Models and Maximum A Posteriori model adaptation [5], successfully applied to speaker and face authentication. It allows the user to be trained to work with the authentication system and then be tested for the identity. Lee developed a system to identify people using EEG signals generated during their imagined speech [6]. With the help of the model, subjects are identifiable to 99.76% accuracy. But, there are chances that people can’t imagine their speech with the same
characteristics every time. Darvishi suggested an idea of user authentication with more accuracy and robustness [7] using EEG signals. He addressed two major problems associated with EEG biometrics. One is that the large EEG features size and the relatively limited EEG data size, make it difficult to train a robust model; the other is that the signals from EEG scalp may not be reliable in many situations.
3. Proposed
Method
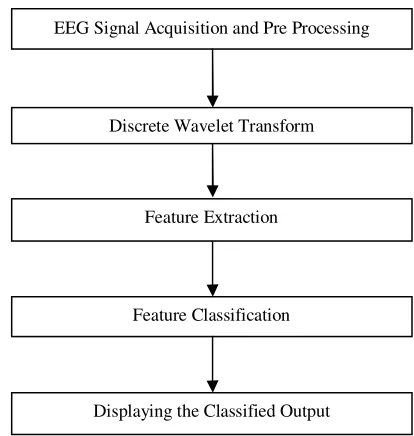
In our proposed method, the finger movements are classified based on the extracted feature values. The block diagram of the proposed method is shown in Figure 1. There are 4 steps in the classification of the finger movements using EEG signals. They are EEG signal acquisition and pre processing, Feature Extraction, Feature Classification and displaying of the classified output. Feature Extraction is done with the help of Discrete Wavelet Transform. As the alpha and beta bands contain more information about the finger movements, those band signals alone taken for the feature extraction.
Fig. 1 Block Diagram of the proposed method
3.1 EEG Signal Acquisitions and Pre Processing
EEG signals are collected from the database [5]. The signal may be affected by some artefacts due to the eye blinking noise and the electrical noises from the external devices. These signals are removed with the help of the Butterworth low pass filtering with the cut-off frequency of 64Hz. The C3 and C4 electrode signals are the most responsible electrodes for the finger movements. So those signals are taken for the analysis.
EEG Signal Acquisition and Pre Processing
Discrete Wavelet Transform
Feature Extraction
Feature Classification
3.1 Discrete Wavelet Transform
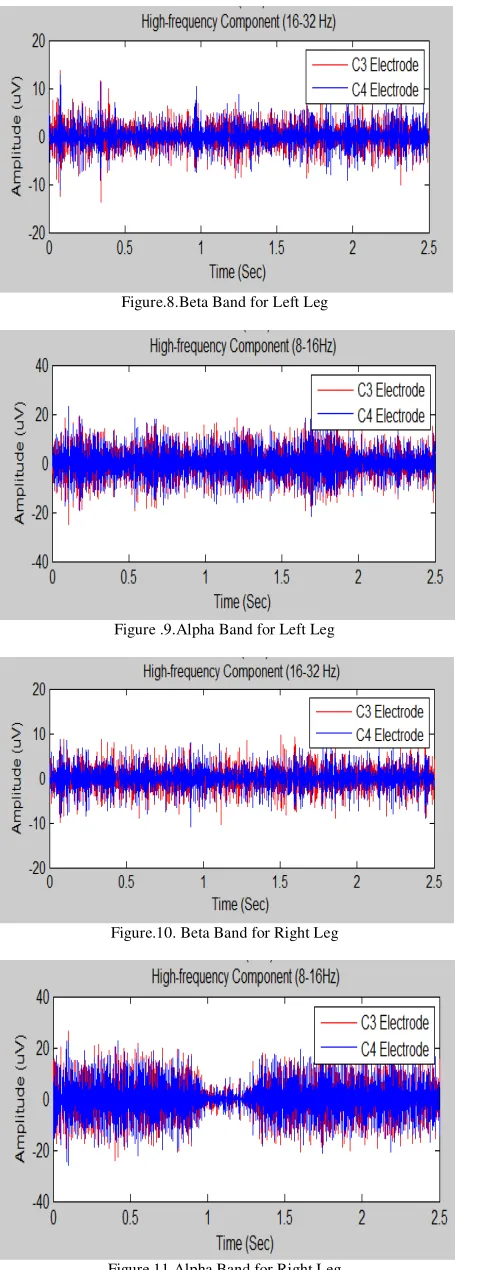
The EEG signals contain the alpha, beta, gamma, theta, mu bands. Alpha and Beta bands are taken for the consideration. The features are extracted from these bands alone. The bands are separated from the EEG signal using Discrete Wavelet Transform. In the first level of decomposition the signals are separated as 0-32Hz and 32-64Hz. In the second level, the low pass signals are approximated with the frequency bands of 0-16Hz (Alpha) and 16-32Hz (Beta). From these alpha and beta band signals, features are extracted to identify the hand finger and leg movements.
3.2 Feature Extraction
Features are extracted for alpha and beta band signals of EEG waves. Totally six features are extracted from these signals. They are modified mean absolute value (MMAV), Root Mean Square (RMS), Waveform Length (WL), Zero Crossing (ZC), Slope Sign Change (SSC) and Simple Square Integral (SSI). Among these six, four features are time domain features and two are frequency domain features. Time Domain Features are Modified Mean Absolute Value, Root Mean Square, Waveform Length and Simple Square Integral. Frequency Domain Features are Zero Crossing and Slope Sign Change.
Modified Mean Absolute Value:Modified Mean Absolute Value is similar to the average rectified value. It can be calculated using the moving average of full-wave rectified EEG signal. In other words, it is calculated by taking average of the absolute value of the EEG signal. It is an easy way for the detection of muscle contraction levels. It is defined as
∑
==
N i n ny
h
N
MMAV
11
(1)Root Mean Square: Root Mean Square is modelled as amplitude modulated Gaussian random process whose RMS is related to the constant force and non-fatiguing contraction. It relates to the standard deviation, which can be expressed as
∑
==
N i ny
N
RMS
1 21
(2)Waveform Length: Waveform Length is the cumulative length of the waveform over the time segment. WL is related to the waveform amplitude, frequency and time. It is given by
∑
= +−
=
N n n ny
y
WL
1 1 (3)Simple Square Integral: Simple Square Integral uses the energy of the EEG signal as a feature. It can be expressed as
∑
==
N n ny
SSI
1 2 (4) Zero Crossing: Zero crossing is the number of times that the amplitude value of the EEG signal crosses the zero y-axis. In EEG feature, the threshold condition is used to abstain from the background noise. This feature provides an approximate estimation of the frequency domain properties. It can be formulated asthreshold
y
y
y
y
ZC
N n n n nn
∩
−
≥
=
∑
= − − 1 1 1)
*
sgn(
(5)Slope Sign Change: Slope Sign Change (SSC) is similar to ZC. It is another method to represent the frequency information of EEG signal. The number of changes between positive and negative slope among three consecutive segments are performed with the threshold function for avoiding the interference in EEG signal. The calculation is defined as
(
) (
)
[
]
[
]
∑
= − −−
−
=
N n n n nn
y
y
y
y
f
SSC
2 1 1*
(6)3.3 Feature Classification
The features which are extracted from the alpha and beta bands of the EEG signal are classified using the Support Vector Machine (SVM) classifier. Two signals are taken for training and the remaining signals are taken for the testing. Based on the trained signals feature values the test signals are classified that which leg movement or the hand finger movement.
4. Results and Discussions
signals from each type have taken for the training phase. The remaining signals are taken for the testing phase. The signals of Left Leg, Right Leg, Left Hand Finger Close, Left Hand Finger Open, Right Hand Finger Close and Right Hand Finger Open are shown in Fig 2-7.
Fig.2. Left Leg
Fig.3. Right Leg
Fig.4. Left Hand Finger Close
Fig.5. Left Hand Finger Open
Fig.6. Right Hand Finger Close
Fig.7. Right Hand Finger Open
Figure.8.Beta Band for Left Leg
Figure .9.Alpha Band for Left Leg
Figure.10. Beta Band for Right Leg
Figure.11.Alpha Band for Right Leg
Figure.12.Beta Band for Left Finger Closed
Figure.13.Alpha Band for Left Finger Closed
Figure.14.Beta Band for Left Finger Opened
Figure.16. Beta Band-Right Finger Closed
Figure.17.Alpha Band-Right Finger Closed
Figure.18.Beta Band-Right Finger Opened
Figure.19. Alpha Band-Right Finger Opened
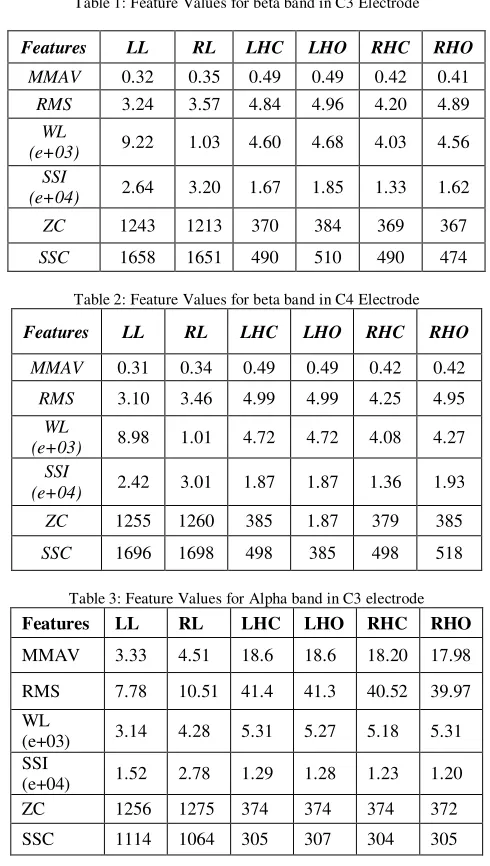
Six features are extracted from these alpha and beta bands of each type of signal. The feature values of the beta band signal measured in C3 electrode for each signal are given in Table 1. The feature values of the beta band signal measured in C4 electrode for each signal are given in Table 2. The feature values of the Alpha band signal measured in C3 electrode for each signal are given in Table 3.
LHO – Left Hand Finger Open LHC – Left Hand Finger Close RHO – Right Hand Finger Open RHC – Right Hand Finger Close LL – Left Leg
RL – Right Leg
Table 1: Feature Values for beta band in C3 Electrode
Features LL RL LHC LHO RHC RHO
MMAV 0.32 0.35 0.49 0.49 0.42 0.41
RMS 3.24 3.57 4.84 4.96 4.20 4.89 WL
(e+03) 9.22 1.03 4.60 4.68 4.03 4.56
SSI
(e+04) 2.64 3.20 1.67 1.85 1.33 1.62
ZC 1243 1213 370 384 369 367
SSC 1658 1651 490 510 490 474
Table 2: Feature Values for beta band in C4 Electrode
Features LL RL LHC LHO RHC RHO
MMAV 0.31 0.34 0.49 0.49 0.42 0.42
RMS 3.10 3.46 4.99 4.99 4.25 4.95
WL
(e+03) 8.98 1.01 4.72 4.72 4.08 4.27
SSI
(e+04) 2.42 3.01 1.87 1.87 1.36 1.93
ZC 1255 1260 385 1.87 379 385
SSC 1696 1698 498 385 498 518
Table 3: Feature Values for Alpha band in C3 electrode
Features LL RL LHC LHO RHC RHO
MMAV 3.33 4.51 18.6 18.6 18.20 17.98
RMS 7.78 10.51 41.4 41.3 40.52 39.97
WL
(e+03) 3.14 4.28 5.31 5.27 5.18 5.31 SSI
(e+04) 1.52 2.78 1.29 1.28 1.23 1.20 ZC 1256 1275 374 374 374 372
Table-4: Feature Values for Alpha band in C4 electrode
Features LL RL LHC LHO RHC RHO
MMAV 3.11 4.31 18.6 18.6 18.02 18.58
RMS 7.33 10.07 41.2 41.1 40.19 39.68
WL
(e+03) 2.92 4.08 5.28 5.24 5.14 5.186
SSI
(e+04) 1.34 2.54 1.28 1.26 1.21 1.186
ZC 1258 1283 371 376 372 383
SSC 1130 1079 305 307 304 305
These feature values are trained using SVM classifier. The testing signals were given and the signals are classified based on its feature values. Classification results are shown in Fig 20.
Fig.20. Classification Result for two testing signals
The result analysis table is shown in Table V. This table gives the details of the accuracy of the classification of the finger movements using the feature values obtained above.
Table-5.Result Analysis Table
Features LL RL LHC LHO RHC RHO
Total No. Of
Signals 5 5 5 5 5 5
No. of Training
Signals
2 2 2 2 2 2
No. of Testing Signals
3 3 3 3 3 3
No. of Correctly
Detected Signals
3 3 3 3 3 2
No. of Wrongly Detected Signals
0 0 0 0 0 1
Accuracy
(%) 100 100 100 100 100 80
5. Conclusions
The proposed work is to analyse classification of the finger movements using EEG signals in particular Left and Right hand fingers open and close are focused. Alpha and Beta bands of the signals are extracted using the Discrete Wavelet Transform. Four features in time domain and two features in frequency domain are extracted. These six features can be fed to the classifier for further classification of different finger movements which are used in the application of artificial upper limb. The accuracy of 96.67% is achieved for the wavelet based classification of finger movements using EEG signals.
References
[1] C.Vigneshwari, V.Vimala, S.Vaira Vignesh, G.Sumithra, “Analysis of Finger Movements Using EEG Signal,” in International Journal of Emerging Technology and Advanced Engineering, vol.3, Issue 1, pp. 583-588, January 2013.
[2] Fonseca C., Cunha J.P.S., Martins R.E., Ferreira V.M., de Sa J.P.M., Barbosa M.A., da Silva A.M. A Novel Dry Active Electrode for EEG Recording. IEEE Trans. Biomed. Eng. 2007; pp.162–165.
[3] Arnaud Delorme and Scott Makeig, “EEG Changes Accompanying Learned Regulation of 12 Hz EEG Activity,” IEEE transactions on neural systems and rehabilitation Engineering, vol. 11, no. 2, June 2003. [4] Darvishi S., Al-Ani A. “Brain-computer interface
analysis using continuous wavelet transform and adaptive neuro-fuzzy classifier”, Proceedings of the 29th International Annual Conference IEEE Engineering, Medicine and Biology Society, August 2007, pp. 3220- 3223.
[5] http://sites.google.com/site/projectbci/
[6] Robi Polikar, The Wavelet Tutorial, http://users.rowan.edu/~polikar/WAVELETS / WTpart1.html.
[7] T.Ebrahimi, J.M. Vesin and G.Garcia. “Brain-computer interface in multimedia communication”, IEEE Signal Processing Magazine, vol.20, pp 14-24, 2003.
[8] V.J.Samar, A.Bopardikar, R.Rao and K.Swartz. Wavelet analysis of neuro electric waveforms: a conceptual tutorial. Brain Language. Vol.66, pp.7-60, 1999.
[9] W. W. Abbott and A. A. Faisal, “Ultra-low-cost 3D gaze estimation: An intuitive high information throughput compliment to brain machine interfaces”, J.Neural Eng., vol.9, no.4, 2012.
[10] Y. Liu et al., “Implementation of SSVEP based BCI with emotive EPOC,” in Proc. IEEE Int. Conf. Virtual Environ. Human-Computer Interface and Measurement Syst. (VECIMS), 2012, pp. 34–37.
R. Shantha Selva Kumari received her BE degree in Electronics and Communication Engineering from Bharathiyar University, in 1987 and MS degree in Electronics and Control from Birla Institute of Technology, Pilani, in 1994. She completed her PhD degree in Bio-signal processing in 2008 from Manonmanium Sundaranar University, Tirunelveli. She has 28 years of teaching experience and is currently working as Professor and Heading the Department of Electronics and Communication Engineering at Mepco Schlenk Engineering College, India.
Her current research interest includes signal processing, wavelets and its applications, neural networks. She is a life member in ISTE, FIETE and CSI.