e-ISSN: 2278-067X, p-ISSN: 2278-800X, www.ijerd.com
Volume 13, Issue 5 (May 2017), PP.29-33
Self-Regulation of the Project Great Inga for an Interconnected
Electrical Network.
Lidinga Mobonda
1, Alphonse Omboua
2Phd In Engineering Sciences, Dept.Of Electricity, University Of Brazzaville-Congo1
Phd In Applied Sciences, From The University Of Liege. Prof At The University Of Brazzaville-Congo2
ABSTRACT
: In this article we present a mathematical approach which deals with the stability of power plants from which the synchronism should be lost; the regime on the interconnected network such as dynamic regime of linearization, the adjustment of the frequency and the regulation of power where we will take as the digital application, the case of the project great Inga (Inga is the great hydraulic power plant located in the Democratic Republic of Congo). The study of project great Inga planned for interconnecting several African countries.Keywords
:
Inga, Alternator, Regulation, Automatic, Interconnected network.I. INTRODUCTION
The interconnection of power plants in the electrical networks requires the synchronism, the equality of the voltages and the succession order of the phases to the interconnection. A fault made up on one of power plants can create a disruption felt by the whole interconnected networks. The interconnection between power plants must be able to rely on the stability of the whole, otherwise it is not used at the time where it should be useful. During an abrupt modification of the load asked by the users or the power supplied by the producer(s), we chronologically observe according to the greatness of the order from the size of the in the first second, following phenomena:
A spread of wave on the lines during the order of the one hundredth of a second.
A change of the frequency in all the network corresponding to a change of the kinetic energy from the rotating groups.
An intervention of the primary regulators (regulators to static instructions) corresponding to the frequency setting.
The stability of the operation from power plants is a function of five levels of orientations in the progressive direction of their durations[1]:
Immediate Exploitation (of the order of second) bringing the primary regulation.
Immediate scheduled Exploitation (of the order of a few second) bringing the second regulation.
Short-term exploitation or economic dispatching (of the order of a few minutes) bringing the tertiary regulation.
Medium-term exploitation or daily exploitation (day) said uncertain future.
II. REGULATION OF SPEED OF A WATERTURBINE
Let first us of all remember by what mechanism the speed regulators assure the distribution of the load between the diverse machines of a network. The regulator of a group aims at settling the speed, it has for mission to establish between the speed of regime and the power, a relation called characteristic of statismω(P). Let us consider a speed of regime(𝛚d) imposed to the groups by the load from the network, we are goingto
notice that both generators develop, for the groups by the load of the network, we are going to notice that both groups develop, for this speed, a power P1d, from and one group P2d; from another; then, the total power [2] of
the network isPd= P1d + P2d (1)
During an abrupt variation of the flow rate Q0, the level N0 and the flowrate of the turbine isq0 = Q0
.When the flowrate decreases abruptly and passes fromQ0 to Q’ as a result from a reduction of the load in an
upstream factory, the level is going first to fall down to a speed such as :
(3)
Let us take as the origin of the levels, the minimum level N2, it and then we have:
(4)
and (5)
II. PRIMARY REGULATION OF THE FREQUENCY
The primary regulation is operated by the action of the speed regulators from the groups of production which generally act on the organs of admission of the driving fluid from the turbine when the speed of the group (image of the frequency) is away from instruction speed as a result of an imbalance between the production and the consumption of the whole synchronous interconnected system. For each group j participating to the primary regulation frequency-power, the law of static regulation of the mechanical power resulting from the action of the speed regulator has to be in the form[3]:
(6)
Pj: real power supplied by the group j with almost still mode.
Pcj: power of instruction of the group j with the reference f0.
f : frequency deducted from the measure of speed from the group j.
f0 : frequency of instruction, generally equals to the reference frequency (50Hz).
Ki : regulating energy of the group j.
The compensation of a gap from the balance sheet production-consumptionΔPbilby all the regulating groups is
equal:
(7)
The resultant gap from frequency is then determined by the following equation: (8)
: total regulating energy of the synchronous system
IV. SECONDARY REGULATION OF THE FREQUENCY AND THE POWER
The action of the primary regulation remains a gap of frequency with regard to the frequency of instruction f0. It also causes gaps on the exchanges between the synchronous interconnected system and the generative groups[3]. Indeed, all the groups of the various synchronous interconnected systems, participating to theprimary regulation, react to the variation of common frequency that the disturbance occurs on the electric system. The function of gap from regulation ΔE used for the secondary regulation (as in France) is obtained by:
(9)
: gap of frequency with regard to the frequency of reference;
: gap between the balance of powers measured on the interconnection lines of highways with the neighboring and λ: secondary regulating energy.
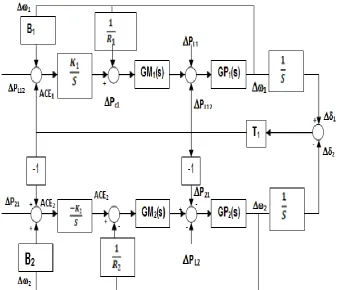
Figure 1. Interconnection of the groups with central regulator
The gap of the frequency f )is balanced by a coefficient ) which must be amplified, andequal to (kA)
. As the latter is not known with big precision, it makes consider / kA)to obtain the gap of regulation.
: coefficient to increase the regulator (10)
III. SUBDIVISION OF THE REGULATION SYSTEM OF POWER
For an interconnected system with large number of generators, the modelling of the regulation of power for each generator, is very complex. We can use a technical aggregation to obtain an approximately simplified model. The precision of the pattern and its utility are acquired when the coherent limits of groups of generators coincide with the functioning or the utility. In this case, under a mere functioning, generators are frequently checked as an easy system. In such a case, the water is called (regulated domain). The model using the regulated domain is very useful when discovering the exchange between close powers[4]. Thus is positive when is negative, with the fall of the frequency, are negative and ACE2 is the sum of two positive quantities with
the tendency of cancellation. In accordance with the main basis of set operations, we want to increase PC2 while
IV. REGULATION OF THE POWER, CASE OF SEVERAL GENERATORS
4.1 Case of Three Generators
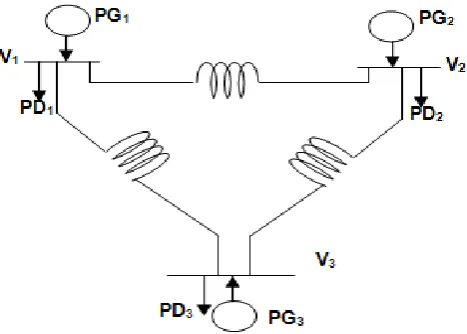
We are interested in the active power and suppose that we can use the model. All the voltages being fixed to their nominal values can be used as regulator of power in each generator. However we are going to consider that every connection is a connection of generators [6].
In every connection, we have inside the case of three generators: PGi = PDi + P
Figure 3. Power supplies by three generators
Pi is the total active power for each connected generator in the system. Let us suppose a point of functioning such as :
(11)
And with (12) (13) And (14)
We shall have the following incremental relation:
(15)
For each generator, we use the linearization and we have:
(16)
is the internal angle of the termal electricity of each generator. Then, we consider the behavior of PDi. Generally PDidepends on the amplitude of the voltage and the frequency. In our case, we consider that PDi
increases with the frequency. This supposition is in accordance with the observed behavior.
We can take into account the change of the outside load (disturbance) from the electrical network. So we can imagine an excessive increase of the load due to an interconnection from a network. In accordance with this description for small changes of the frequency. Let us suppose that:
(17)
The first one from two terms describes the linearization. The frequency depends on the load and is the change of the load in the entrance during an interconnection. Let us note that the point of functioning of the frequency is o, which must be close, but not necessary with the nominal frequency[6]. When defining the frequency in the voltage for each connection, the immediate voltage will be:
(18)
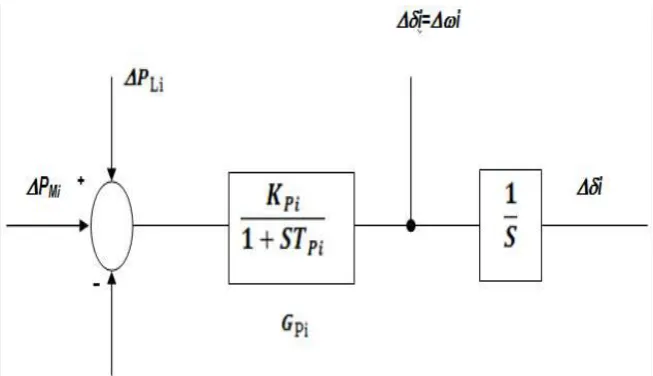
The relationships which precede are shown in the block diagram of figure 5 below.
Kpi=1/Di and Tpi=Mi/Di. The figure below represents the system in block diagram, we have as an exit and PMi
Figure 4. block diagram for the generator
4.2. Case of two generators
In this case, we have two coefficients of the synchronous system to be considered [7]: (19)
(20)
: synchronous of the turbine 1-2and : synchronous of the turbine 2-1
V. APPLICATION TO THE GREAT INGA PROJECT IN THE INTERCONNECTED
NETWORK
5.1 Digital applications to the great Inga project.
We consider the same estimated data in the board below, for the functioning in isolated network. The behavior of the regulation of parameters from the alternator (frequency, voltage and power) with regard to the interconnected network to the various power plants.
(Board V.1 Estimated data of the isolated network to the project Big Inga)
Parameters Symbol /Unit
Net1 Net2 Net3 Net4 Net5
Vacucous speed No (tr/min) 375 375 375 375 375 Vacuousfrenquency Fo (Hz) 50 50 50 50 50 Engine torque Cm (MNm) 15,5 15,5 15,5 15,5 15,5 Vacuous voltage Vo (kV) 16 16 16 16 16 Power of network Pr (MW) 250 500 750 1000 1250 Voltage of network Ur (kV) 500 500 500 500 500 Resistance of winding R (MΩ) 0,25 0,25 0,25 0,25 0,25 Efficciency Η (%) 0,90 0,90 0,90 0,90 0,90
With Net: electrical network.
The data of the estimated power from power plants in interconnection with the project Great Inga are in the board below.
(Board V.2: illustration of powers from power plants in possible interconnection with the project Great Inga)
Power plants P (MW) Pr1 Pr2 Pr3 Pr4 Pr5 Power plant 1 (Imboulou) 120 250 500 750 1000 1250 Power plant 2 350 250 500 750 1000 1250 Power plant 3 500 250 500 750 1000 1250 Power plant 4 650 250 500 750 1000 1250
P is the power of the power plant in the interconnection and Pr : call power from the interconnected network.
(Board V.2 - Obtained results)
Parameter Formula Obtainedresults Power supplied by the turbine
Efficiency of the generator %
Angular speed rad/s
Rotation speed of the generator tr/min
Frequency of these currents 13,73 Hz
Pulsation of these currents which
deducts with the frequency rad/s
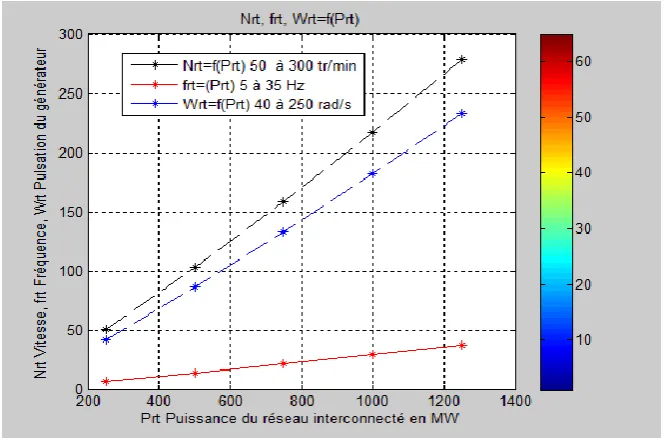
5.3 Graphic simulation to the interconnected network
Figure 5. Graphic simulation of power plant to the interconnected network
5.4 Digital applications of the regulation the project Great Inga
In titular experiments, the stability of the network is linked to the frequency regulation through the value of instruction close to the nominal value. The data from experiments of the isolated electrical network are written in the board below.
(Board V.3: Data from the isolated network by imposition of the frequency) Parameter Symbol Unit Net1 Net2 Net3 Net4 Net5
Frequency in load Fr Hz 49.5 49.5 49.5 49.5 49.5 Vacuous voltage Vo kV 16 16 16 16 16 Network voltage Ur kV 500 500 500 500 500 Network power Pr MW 250 500 750 1000 1250 Resistance of the winding R MΩ 0,25 0,25 0,25 0,25 0,25
When we impose the frequency in an energy system, the rotation speed, the angular speed and the pulsation, all these parameters stay constant in from of the variation of the electrodynamics parameters of the network. In this condition, the alternator produces on the network voltage and stable frequency, but the power supplied by the turbine will give a variable engine torque. Thus, in an important electrical network, the engine torque, the frequency and the power are bound by a following mathematical relationship:
5.5 Resolutions of the regulation of the electrical network 2
(22)
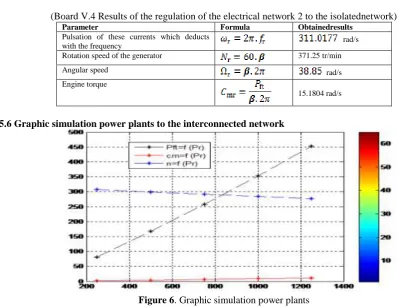
(Board V.4 Results of the regulation of the electrical network 2 to the isolatednetwork) Parameter Formula Obtainedresults
Pulsation of these currents which deducts
with the frequency rad/s
Rotation speed of the generator 371.25 tr/min
Angular speed rad/s
Engine torque
15.1804 rad/s
5.6 Graphic simulation power plants to the interconnected network
Figure 6. Graphic simulation power plants
VI. CONCLUSION
The approach presented in this study deals with the survey of the self-regulation of the frequency and the module of the voltage from alternators in an interconnected network. This study enabled us to scrutinize on the following points:
Regulation of speed from a water turbine; Primary Regulation of the frequency;
Secondary Regulation of the frequency-power; power supplied by five power plants;
Block diagram of the generator; Regulation of the power by a generator; Regulation of her (it) by several generators.
In addition, we developed equations linked to the static regime, before the disturbance, after the disturbance, the power difference, the incremental relation of power, the frequency for each connection, and the equation of the regulation of the frequency and power of each connection, and the equations of the regulation of the frequency and power of the alternator.
REFERENCES
[1]. https://iiteeeestudents.wordpress.com/2011/11/14/interconnected-grid-system [2]. http://www.sciencedirect.com/science/article/pii/S037877960700017X
[3]. J.F. Canard, " Impact of the generation of energy scattered in the distribution networks ", Doctoral thesis, National polytechnic institute of Grenoble, December 12th, 2000.
[4]. B. Gotzig, " Research for an Optimal Diagram of Exploitation of an Electric Distribution network ", Doctoral thesis, National polytechnic institute of Grenoble, December, 1997.