e-ISSN: 2278-067X, p-ISSN: 2278-800X, www.ijerd.com
Volume 12, Issue 11 (November 2016), PP.43-47
Degradation Pattern for Various Biomasses
Ashok Kumar¹*, Arshi Mehta
2,
¹Developement Environergy Services LimitedAbstract
:
As per study of Ministry of New and Renewable Energy, Current availability of biomass in India isestimated at about 500 million metric tons per year and estimated surplus biomass availability at about 120 – 150 million metric tons per annum covering agricultural and forestry residues corresponding to a potential of about 18,000 MW. The Main difficulty in biomass utilization is fuel degradation. With time moisture and sand % change due to its inherent chemical reaction (due to high temperature), moisture ingress from earth and rainfall during storage. Thus the mass and Gross Calorific Value (GCV) change over year which in turn impact plant performance. That’s why biomass properties measured at the time of procurement do not match with those at the time of fuel feeding. So plant has to take care of degradation rate of various biomasses and feeding time also have to be selected accordingly. Rate of degradation is dependent on if biomass is covered or uncovered.
Keywords:
Moisture, sand, GCV, degradation, procurement and feeding.I. INTRODUCTION
Agriculture plays crucial role in India’s economy. More than 58% of the rural households depend on agriculture as their principal means of livelihood. As per the 3rd Advance Estimates, India's food grain production has increased marginally to 252.23 million tons (MT) in the 2015-16 crop years. Production of pulses is estimated at 17.06 million tones. Crop residue of every crop determines the biomass potential in India.
The biomass based power plants are seen as challenging projects, as there is a lot of dependence on fuel from agricultural yields. The entire fuel chain is very complex, which begins right from the stage of harvesting of the crop. The process involves collection of the biomass feedstock after harvesting; stacking, baling, etc after which the fuel is transported to the storage centers of the power plants.
There is uncertainty in the availability of biomass throughout the year. Biomass is available at the stretch of 2-3 months in a year and that too after the harvesting period.. So there is a need to procure and then store required quantity of biomass within this stipulated time. Other problem is associated with management of biomass collection, transportation, processing and storage; problems that come up while setting up large size biomass plants.
Moreover properties like moisture content, sand percentage and Gross Calorific Value change while the biomass is still in storage area. This change in properties is called biomass degradation and which in turn has become a major challenge for the concerned authorities. The degradation rate decreases if the biomass is covered when it is in storage period. Inherent chemical reactions and moisture ingress from the surface are the only two reasons for degradation in covered fuels while in case of uncovered fuels rainfall also contributes to increase in moisture content of the biomass. This results in faster degradation in uncovered fuels as compared to covered fuels.
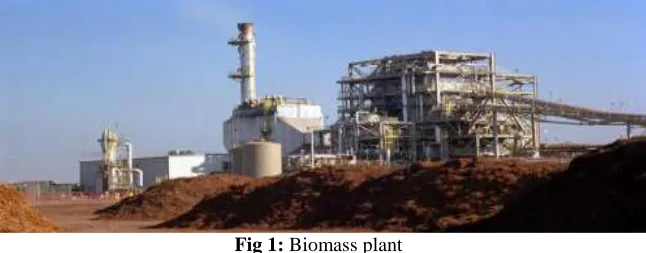
Fig 1: Biomass plant
II. UNCOVERED BIOMASS
Properties of all 4 types of biomass are given:
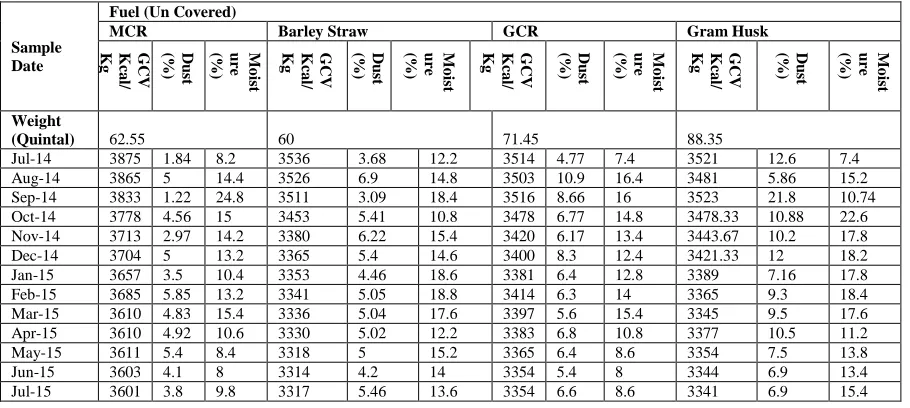
Table I: Mass, GCV, moisture % and sand % of various biomass
Sample Date
Fuel (Un Covered)
MCR Barley Straw GCR Gram Husk
GC V Kca l/ Kg D u st (%) M o ist u re (%) GC V Kca l/ Kg D u st (%) M o ist u re (%) GC V Kca l/ Kg D u st (%) M o ist u re (%) GC V Kca l/ Kg D u st (%) M o ist u re (%) Weight
(Quintal) 62.55 60 71.45 88.35
Jul-14 3875 1.84 8.2 3536 3.68 12.2 3514 4.77 7.4 3521 12.6 7.4 Aug-14 3865 5 14.4 3526 6.9 14.8 3503 10.9 16.4 3481 5.86 15.2 Sep-14 3833 1.22 24.8 3511 3.09 18.4 3516 8.66 16 3523 21.8 10.74 Oct-14 3778 4.56 15 3453 5.41 10.8 3478 6.77 14.8 3478.33 10.88 22.6 Nov-14 3713 2.97 14.2 3380 6.22 15.4 3420 6.17 13.4 3443.67 10.2 17.8 Dec-14 3704 5 13.2 3365 5.4 14.6 3400 8.3 12.4 3421.33 12 18.2 Jan-15 3657 3.5 10.4 3353 4.46 18.6 3381 6.4 12.8 3389 7.16 17.8 Feb-15 3685 5.85 13.2 3341 5.05 18.8 3414 6.3 14 3365 9.3 18.4 Mar-15 3610 4.83 15.4 3336 5.04 17.6 3397 5.6 15.4 3345 9.5 17.6 Apr-15 3610 4.92 10.6 3330 5.02 12.2 3383 6.8 10.8 3377 10.5 11.2 May-15 3611 5.4 8.4 3318 5 15.2 3365 6.4 8.6 3354 7.5 13.8 Jun-15 3603 4.1 8 3314 4.2 14 3354 5.4 8 3344 6.9 13.4 Jul-15 3601 3.8 9.8 3317 5.46 13.6 3354 6.6 8.6 3341 6.9 15.4
Variation in GCV and mass shows degradation of fuel with respect to time. Degradation rate for all 4 types of biomass will be:
Fig 2: Degradation in terms ofGCV and mass for various biomass
Degradation in terms of mass calculates as given below:
Mass without moisture and sand = Total mass of fuel *(1-mosture %/100)*(1-sand %/100) For MCR in month of July 2014 = 62.55*(1-1.84/100)*(1-8.2/100)
= 56.2 Qt.
Same we can calculate for remaining months and rate of degradation can be established. From Fig 2 it is clear that degradation rate is lesser on mass basis as compare to GCV basis. Degradation in terms of mass determines as rebating of moisture and sand from total mass. But moisture and sand determination is still tough challenge for biomass since biomass has variable properties throughout in heap. Sampling methodology for biomass is not developed yet. Like in coal sampling, quarter cone method adopted for sampling. That’s why degradation rate determines on the basis of GCV only.
7.1 6.2 4.6 5.1 0.0 1.0 2.0 3.0 4.0 5.0 6.0 7.0 8.0 0.00 0.50 1.00 1.50 2.00 2.50 3.00 3.50 4.00 MCR Barley Straw GCR Gram Husk
% change in GCV % change in
mass
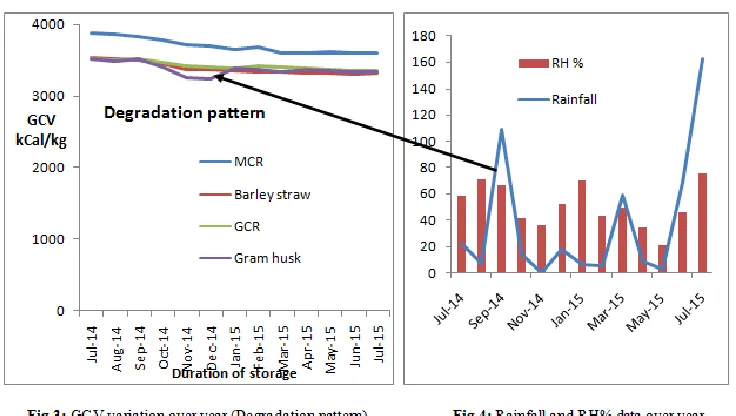
From Fig 2 and Fig 3, Degradation rate for MCR is maximum which 7.1% but GCV of MCR is higher than others. It is clear from graph that MCR degrades in between month of October to February since Rainfall and RH% was maximum in September ( Fig 4: Rainfall and RH% over year) which observed in October month. Effect of RH% and Rainfall noticed on other fuel and can be controlled by covering MCR with Tarpolin. Same has analysed later stage. For other fuel like Barley Straw and GCR degradation pattern is same like MCR, even degradation rate is lower than MCR, but availability is lower than MCR. GCR has unique pattern than others. This shows that GCR affects lower than other which may storage in open space also.
III. COVERED BIOMASS
Properties of all 4 types of biomass are given:
Table II: Mass, GCV, moisture % and sand % of various biomass
Sample Date
Fuel (Covered)
MCR Barley Straw GCR Gram Husk
G
C
V
K
c
a
l/K
g
D
u
st
(%)
M
oi
stu
re
(%)
G
C
V
K
c
a
l/K
g
D
u
st
(%)
M
oi
stu
re
(%)
G
C
V
K
c
a
l/K
g
D
u
st
(%)
M
oi
stu
re
(%)
G
C
V
K
c
a
l/K
g
D
u
st
(%)
M
oi
stu
re
(%)
Weight
(Quintal) 60.4 66.25 74.6 95.85
Jul-14 3884 2.45 7.8 3549 7.02 14.6 3590 2.35 7.4 3531 9.4 9.4 Aug-14 3873 5.85 9.8 3533.8 10.75 11.6 3514 12.28 9.8 3514 18 7.4 Sep-14 3845 2.14 15.2 3516 4.78 17.6 3503 8.23 14.2 3491 10.4 15.4 Oct-14 3835.5 3.04 16.2 3499 5.58 8.8 3481 6.82 6.8 3464 9.78 11
Nov-14 3821 5.3 12 3482 4.89 13.4 3474 7.28 10.4 3452 8.87 10.4 Dec-14 3816 5.1 13 3482 5.4 14.6 3470 7.6 12.2 3437 6.08 12.4 Jan-15 3774 3.9 12.6 3447 4.6 14.2 3424 6.3 14 3435 8.3 13.2 Feb-15 3742 5 11 3436 5 15.2 3429 7.3 14.4 3424 10.4 12.8 Mar-15 3682 5.08 13.2 3413 5 20.2 3400 5.7 12.6 3424 9.2 16.2 Apr-15 3674 5.3 11.6 3424 5.5 11 3383 6.8 10.8 3407 10.2 11.8 May-15 3658 4.8 13.6 3331 5.9 12.6 3412 5.6 14.4 3402 9.5 9.2 Jun-15 3652 4.7 12 3332 4.1 10.2 3408 6 12.8 3400 6.5 8 Jul-15 3657 4.04 11.8 3331 5.9 10.4 3412 6.17 11.8 3401 6.7 8.8
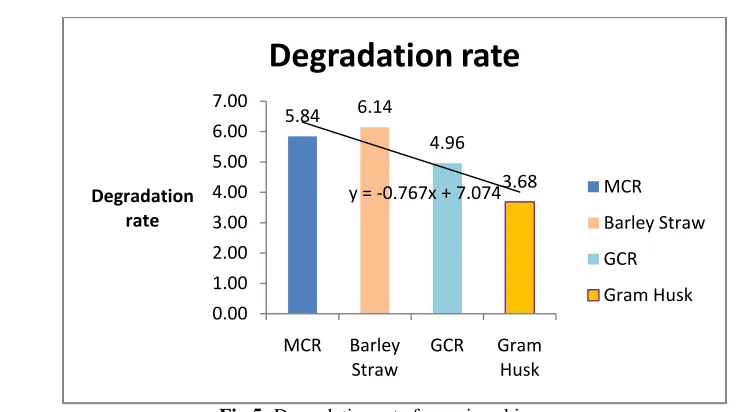
Fig 5: Degradation rate for various biomass
For MCR, degradation rate is 5.84% only which is slightly lesser than that for uncovered MCR. This shows MCR degrades not only due to rainfall and RH% (added by surrounding) but also by moisture ingress from earth. Same apply for other fuel also. In case of GCR (Gwar Crop Residue) pattern is completely reverse than other fuel as it degrades more in covered condition. This might be cause of internal reaction due to heat in heap. Further study will require for study of such behavior.
5.84 6.14
4.96
3.68 y = -0.767x + 7.074
0.00 1.00 2.00 3.00 4.00 5.00 6.00 7.00
MCR Barley
Straw
GCR Gram
Husk
Degradation rate
Degradation rate
MCR
Barley Straw
GCR
Gram Husk
0 1000 2000 3000 4000
Ju
l-14 Aug… Sep…
Oct
-…
N
o
v…
De
c…
Jan
-…
Fe
b
…
Ma
r…
Ap
r-…
Ma
…
Ju
n
-…
Ju
l-15
GCV kCal/kg
Duration of storage
Degradation pattern
MCR
Barley straw
GCR
Gram husk
0 20 40 60 80 100 120 140 160 180
RH %
From Fig 6 & 7 it is clear that effect of rainfall & RH% is not reflecting on all four types of fuel. Pattern of degradation is also more uniform than that of uncovered fuel. Since in Uncovered fuel GCV were changing due to external factors like rainfall but in case of covered fuel degradation rate is dependent upon its internal chemical reaction and moisture ingress from earth only. Least degradation rate observed in Gram husk and maximum degradation noticed in Barley Straw. This means Barley Straw is required to cover on top priority and Gram husk requires less priority to be covered. MCR is also needed to be covered on top priority since degradation rate is lesser in covered condition.
IV. CONCLUSION
One year analysis of 4 types of biomass shows that degradation pattern in covered condition in more linear than uncovered. Degradation pattern of various biomass will help for improving the performance of power plant. Good quality fuel mixing with known pattern (degradation) will improve plant performance all time. Degradation is one of the major losses in fuel out of other all losses like Transportation loss, windage loss and carpet loss.
REFERENCES
[1]. Leena singh, R. Sunderesan, Renu Sarin, Waste to Energy Generation from municipal solid waste in India, Vol. 6 No.2 pp 1228-1232, April-June 2014