Volume 3 Issue 1 – March 2015 26 ISSN : 2319-6319
Analysis of Denoising Techniques with
Application in Medical Images
VikramVerma
Associate Professor JMIT Radaur
Pooja Sharma
Assistant Professor JMIT Radaur
Tajinder Kumar
Assistant Professor JMIT Radaur
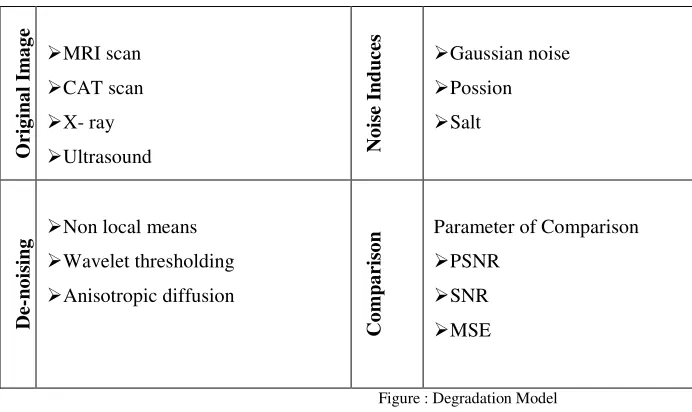
Abstract - Medical images like MRI, CAT scan, and ultrasound play role of back bone in diagnostics. Images generated from various medical diagnostic machines are transmitted through channels before used by clinical experts. Transmission through noise channel sometimes degrades and corrupts the image making it inappropriate for accurate diagnose. The aim of this article is to study andanalyse the effect of noise on medical images. Different types of noises were intentionally added such as Gaussian, Salt and Pepper, Speckle and Poisson and corrupted the medical images with varying values of mean and variance .Different filtering algorithm: Anisotropic
Diffusion, Wavelet Thresholding, NL-Means and Wavelet are applied to de-noise images. Simulation results include comparison of effect of different noise and consequently de-noising. The effectiveness of discussed algorithms were compared on the basis of: Signal to Noise Ratio (SNR),Peak to Signal noise ratio (PSNR), Mean square Error (MSE).
I. INTRODUCTION
The handling of digital images has become a subject of widespread interest in different areas especially in medical field. For achieving an accurate and efficient diagnosis, medical staff requires substantial quality digital images. However, in their acquisition or transmission procedures, images may be corrupted by a disruptive noise, which could mask the subtle and meaningful features. Therefore obtained images from clinical examinations should be treated to assist doctors in results interpretation accurately. In order for a correct diagnosis, these medical images are required to be noise free. Here we highlights the various filtering algorithms that are applied on the corrupted medical images to make them noise free. We have intentionallyadded different types of noises such as Gaussian, Salt and Pepper,Speckle and Poisson. Medical images are corrupted with varying values of mean and variance and then denoising is applied.Basic filters like Averaging, Median, Weiner and Adaptive filters are applied for preprocessing.We have implemented various filtering algorithms Anisotropic Diffusion, Wavelet Thresholding, Total Variation, NL-Means, Decision Based algorithm and Wavelet on various medical images such as Magnetic Resonance, X-rays, and Ultrasound. The effectiveness of discussed algorithms is compared on the basis of Peak to Signal noise ratio (PSNR), Mean square Error (MSE), Signal noise ratio SNR.
II. NOISE MODEL
Volume 3 Issue 1 – March 2015 27 ISSN : 2319-6319
O
ri
g
in
a
l
Im
a
g
e
MRI scan CAT scan X- ray
Ultrasound N
o
is
e
In
d
u
ce
s
Gaussian noise Possion Salt
D
e-n
o
is
in
g Non local means Wavelet thresholding Anisotropic diffusion
C
o
m
p
a
ri
so
n Parameter of Comparison PSNR
SNR
MSE
Figure : Degradation Model
WAVELET THRESHOLDING methods are used for noise removal. Wavelet coefficients are processed in order to remove noise[Rami Cohen].
The thresholded wavelet coefficients are obtained using either hard or soft thresholding rule given respectively by: The de-noising technique is carried out in the following manner:
Step1. Load 8 bit image of size 512 * 512. Step2.Analyzing an image
Step3.Performing decompositions and reconstructions (command line only) Step4. De-noising an image
NL MEANSparametric filter named Non-local meanis used for MRIimage denoising[2]. Unlike other local smoothing filters, non-local means filter averages all observed pixels to recover a single pixel. The weight of each pixel depends on the distance between its intensity grey level vector and that of the target pixel.
The wavelet de-noising procedure involves three steps. The basic version of the procedure follows these steps:
Step1. Decomposition of image:Choose a wavelet, choose a level N. Compute the wavelet decomposition of the signal s at level N.
Step2.Threshold detail coefficients: For each level from 1 to N, select a threshold and apply soft thresholding to the detail coefficients.
Step3.Reconstruct of image:Compute wavelet reconstruction using the original approximation coefficients of level N and the modified detail coefficients of levels from 1 to N.
III.RESULTS
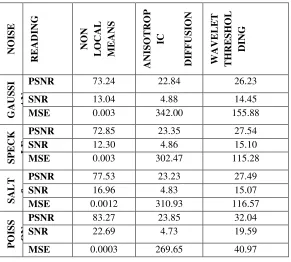
After comparing the results of all the above mentioned denoising techniques, we can conclude the following:Wavelet thresholding removes speckle noise most efficiently and doesn’t remove salt &pepper noise as shown in Table 1 and Table 2. NON LOCAL MEANS: Gaussian noise is most effectively removed by it.
Volume 3 Issue 1 – March 2015 28 ISSN : 2319-6319
Table 2.
IV.CONCLUSION
Three denoising techniques analyzed conclude to following main results.NL mean removes all the four noises effectively. Waveletthresholdingremoves all the four noises to certain extent. Wavelet de noising it only removes Gaussian noise but does not give acceptable result for other noises.
V. FUTURE SCOPE
Future research in the filtering of medical images will strive towards improving the accuracy, precision and computational speed of filtering methods, as well as reducing the amount of manual interaction.
N
O
IS
E
R
E
A
D
IN
G
N
O
N
L
O
C
A
L
M
E
A
N
S
A
N
IS
O
T
R
O
P
IC
D
IF
F
U
S
IO
N
W
A
V
E
L
E
T
T
H
R
E
S
H
O
L
D
IN
G
G
A
U
S
S
I
A
N
PSNR 73.24 22.84 26.23
SNR 13.04 4.88 14.45
MSE 0.003 342.00 155.88
S
P
E
C
K
L
E
PSNR 72.85 23.35 27.54
SNR 12.30 4.86 15.10
MSE 0.003 302.47 115.28
S
A
L
T
&
PSNR 77.53 23.23 27.49
SNR 16.96 4.83 15.07
MSE 0.0012 310.93 116.57
P
O
IS
S
O
N
PSNR 83.27 23.85 32.04
SNR 22.69 4.73 19.59
MSE 0.0003 269.65 40.97
N
O
IS
E
R
E
A
D
IN
G
U
L
T
R
A
S
O
U
N
D
M
R
I
C
T
-S
C
A
N
X
-R
A
Y
P
S
N
R 28.59 23.87 30.89 27.94
G
A
U
S
S
IA
N S
N
R 14.44 11.43 19.72 17.98
M
S
Volume 3 Issue 1 – March 2015 29 ISSN : 2319-6319 denoised image
50 100 150 200 250 300
20 40 60 80 100 120 140 160 180 200 220
50 100 150 200 250 300 original image
100 200 300 400 500
50 100 150 200 250 300 350 400 450
10 20 30 40 50 60 denoised image
50 100 150 200 250 300
50
100
150 200
250
300
50 100 150 200 250 300
noisy image
50 100 150 200 250 300
20 40 60 80 100 120 140 160 180 200 220
10 20 30 40 50 60
Denoised Image REFERENCES
[1] http://tx.technion.ac.il/~rc/SignalDenoisingUsingWavelets_RamiCohen.pdf. [2] http://www.sciencedirect.com/science/article/pii/S1361841508000248
[3] Rajni, Anutam, “Image Denoising Techniques –An Overview,” International Journal of Computer Applications (0975-8887), Vol. 86, No.16, January 2014.
[4] S.Sutha, E. JebamalarLeavline, D. ASR Antony GnanaSingh, “ A Comprehensive Study on Wavelet based Shrinkage Methods for Denoising Natural Images,” WSEAS Transactions on Signal Processing, Vol. 9, Issue 4, October 2013
[5] Idan Ram, Michael Elad, “Generalized Tree-Based Wavelet Transform,” IEEE Transactions On Signal Processing, Vol. 59, No. 9, September 2011.
A. SIMULATED RESULTS
B
.
O
ri
g
in
a
l
im
a
g
e
C. MRI D. CAT SCAN E. ULTRASOUND
F
.
N
o
is
ed
i
m
a
g
e
G
.H.
noisy image
100 200 300 400 500
50 100 150 200 250 300 350 400 450
I.
J
.
D
en
o
is
ed
u
si
n
g
n
o
n
l
o
ca
l
m
ea
n
K.
Denoised Image
L.
Volume 3 Issue 1 – March 2015 30 ISSN : 2319-6319 denoised image
50 100 150 200 250 300
20 40 60 80 100 120 140 160 180 200 220
50 100 150 200 250
original image
50 100 150 200 250 300
20 40 60 80 100 120 140 160 180 200 220
10 20 30 40 50 60
N
.
D
en
o
is
ed
u
si
n
g
w
a
v
el
et
O.
denoised image
50 100 150 200 250 300 50
100 150 200 250 300
50 100 150 200 250
P.
denoised image
100 200 300 400 500
50 100 150 200 250 300 350 400 450
50 100 150 200 250 Q.
R
.
D
en
o
is
ed
u
si
n
g
w
a
v
el
et
th
re
sh
o
ld
in
g
S.
denoised image
50 100 150 200 250 300 50
100 150 200 250 300
50 100 150 200 250 300
T.
denoised image
100 200 300 400 500
50 100 150 200 250 300 350 400 450
50 100 150 200 250 300
U.