FORMULATION AND EVALUATION OF COLON TARGETED DRUG DELIVERY OF
BUDESONIDE USING MODIFIED CODES SYSTEM
Krutika A. Kulkarni
1Yogivilla, Manjalpur Baroda, Gujarat, India 2,3LJ Institute of Pharmacy, Ahmedabad, Gujarat, India
A R T I C L E I N F O
INTRODUCTION
Site-specific delivery of drugs to the site of action has the potential to reduce side effects and to increase pharmacological response. One of the seemingly interesting areas to target drugs through oral route is the colon. Various systems have been developed for colon-specific drug delivery: covalent linkage of a drug with a carrier, coating with pH sensitive polymers, time-dependent release systems, and enzymatically controlled delivery systems. Enteric systems are the most commonly used for colon
delivery, but the pH difference between the small intestine and colon is not being very pronounced leading to poor site specificity. The drawback of the time-dependent release system is its inability to sense any variation in the upper gastrointestinal tract transit time; besides, any variation in gastric emptying time may lead to drug release in the small intestine before arrival to the colon. There is a steep gradient of enzyme activity along the gastrointestinal tract; these enzymes are derived from gut microflora. In humans, the stomach and small intestine contain roughly 103
forming units (CFU)/mL.
International Journal of Current Advanced Research
ISSN: O: 2319-6475, ISSN: P: 2319-6505,
Available Online at www.journalijcar.org
Volume 7; Issue 4(B); April 2018; Page No.
DOI: http://dx.doi.org/10.24327/ijcar.2018
Copyright©2018 Krutika A. Kulkarni et al. This is an open access article distributed under the Creative Commons Attribution License, which permits unrestricted use, distribution, and reproduction in any medium, provided the original work is properly cited.
*Corresponding author: Krutika A. Kulkarni
Yogivilla, Manjalpur Baroda, Gujarat, India
Article History:
Received 24th January, 2018 Received in revised form 13th
February, 2018 Accepted 8th March, 2018 Published online 28th April, 2018
Key words:
CODES System, Budesonide, Karaya gum, caecal content, microflora, Eudragit E100, Eudragit S100
FORMULATION AND EVALUATION OF COLON TARGETED DRUG DELIVERY OF
BUDESONIDE USING MODIFIED CODES SYSTEM
Krutika A. Kulkarni
1., Jaymin Patel
2and Shreeraj Shah
Yogivilla, Manjalpur Baroda, Gujarat, India LJ Institute of Pharmacy, Ahmedabad, Gujarat, India
A B S T R A C T
The purpose of this study was to prepare budesonide tablet to deliver the drug to colon in intact form which is used to treat IBD, ulcerative colitis, Chron’s disease. In present study budesonide tablets were prepared using CODES Technology for targeting the drug to colon. The core tablets were prepared using natural polymer Karaya gum which gets degraded by colonic enzymes. Tablet is coated with Eudragit E100 and super coated with Eudragit S100 which will retard the drug release in upper GI Tract and in 6.8pH phosphate buffer in presence of rat caecal micro flora it gave the drug release. The formulation batches were prepared by BOX-BEHNKEN Factorial Design using 3 independent variables X1(con. of Karaya gum), X2 (%wt. gain by Eudragit E100), X3 (% wt. gain by Eudragit S100) and Dependent variable Y5 (% drug release in 5hr) and Y12 (% drug release in 12hr). On the basis of criteria that, not more than 5% drug should release within 5hr (Y5). Where F8 batch was decided as optimized batch because only 2% drug released within 5hr. The result showed that optimized formulation had delivered the maximum amount of drug to the colon in intact form.
specific delivery of drugs to the site of action has the potential to reduce side effects and to increase pharmacological response. One of the seemingly interesting areas to target drugs through oral route is the colon. Various specific drug delivery: covalent linkage of a drug with a carrier, coating with
pH-dependent release systems, and enzymatically controlled delivery systems. Enteric-coated systems are the most commonly used for colonic drug delivery, but the pH difference between the small intestine and colon is not being very pronounced leading to poor site dependent release system is its inability to sense any variation in the upper inal tract transit time; besides, any variation in gastric emptying time may lead to drug release in the small intestine before arrival to the colon. There is a steep gradient of enzyme activity along the gastrointestinal tract; these rom gut microflora. In humans, the stomach and small intestine contain roughly 103–104 colony
However, the concentration of microflora
passing from the terminal ileum to the ascending colon the numbers reach 1,011–1,012 CFU/mL. These bacteria survive and thrive by fermenting a wide range of substrates (e.g., oligosaccharides, polysaccharides, mono polysaccharides) left undigested in the small intestine. Hence, enzymatically controlled delivery systems is considered a convenient approach for
site-colon where no drug release can occur unless the system arrives to the colon (7–9). BUD is
has important implications in the pharmacotherapy of inflammatory bowel disease, especially in the treatment of ulcerative colitis and Crohn’s disease. BUD is approximately twice as active as beclomethasone dipropionate, and i
1,000 times more active than either prednisolone or hydrocortisone in inducing intracutaneous vasoconstriction (as a marker of anti-inflammatory activity). BUD is commercially available in the market in the form of enteric preparations mainly for the treatment of small intestine active Crohn’s disease. However, these products, similar to other available site-specific dosage forms, are not sufficiently selective to treat colonic inflammatory bowel disease. It was found that less than 5% of the drug was available beyond the ileum and cecum, and therefore, colonic delivery still needs to be optimized by a more reliable colon
Previous workers have developed BUD microparticles for colon delivery. However, being relatively complex
their large-scale manufacturing requires a lot of technological
International Journal of Current Advanced Research
6505, Impact Factor: 6.614
www.journalijcar.org
; Page No. 11387-11392
//dx.doi.org/10.24327/ijcar.2018.11392.1969
This is an open access article distributed under the Creative Commons Attribution License, which permits unrestricted use, distribution, and reproduction in any medium, provided the original work is properly cited.
Krutika A. Kulkarni
FORMULATION AND EVALUATION OF COLON TARGETED DRUG DELIVERY OF
Shreeraj Shah
3budesonide tablet to deliver the drug to colon in intact form which is used to treat IBD, ulcerative colitis, Chron’s disease. In present study budesonide tablets were prepared using CODES Technology for targeting the drug to repared using natural polymer Karaya gum which gets degraded by colonic enzymes. Tablet is coated with Eudragit E100 and super coated with Eudragit S100 which will retard the drug release in upper GI Tract and in 6.8pH phosphate aecal micro flora it gave the drug release. The formulation BEHNKEN Factorial Design using 3 independent variables X1(con. of Karaya gum), X2 (%wt. gain by Eudragit E100), X3 (% wt. gain by Eudragit Y5 (% drug release in 5hr) and Y12 (% drug release in 12hr). On the basis of criteria that, not more than 5% drug should release within 5hr (Y5). Where F8 batch was decided as optimized batch because only 2% drug released within 5hr. t optimized formulation had delivered the maximum amount of drug
However, the concentration of microflora rises dramatically passing from the terminal ileum to the ascending colon where 1,012 CFU/mL. These bacteria survive and thrive by fermenting a wide range of substrates (e.g., oligosaccharides, polysaccharides, mono ) left undigested in the small intestine. Hence, enzymatically controlled delivery systems is considered a -specific drug delivery to the colon where no drug release can occur unless the system 9). BUD is a potent corticosteroid that has important implications in the pharmacotherapy of inflammatory bowel disease, especially in the treatment of ulcerative colitis and Crohn’s disease. BUD is approximately twice as active as beclomethasone dipropionate, and it is over 1,000 times more active than either prednisolone or hydrocortisone in inducing intracutaneous vasoconstriction (as inflammatory activity). BUD is commercially available in the market in the form of enteric-coated nly for the treatment of small intestine active Crohn’s disease. However, these products, similar to other specific dosage forms, are not sufficiently selective to treat colonic inflammatory bowel disease. It was he drug was available beyond the ileum and cecum, and therefore, colonic delivery still needs to be optimized by a more reliable colon-specific system. Previous workers have developed BUD microparticles for colon delivery. However, being relatively complex systems, scale manufacturing requires a lot of technological
Research Article
Formulation And Evaluation of Colon Targeted Drug Delivery of Budesonide Using Modified Codes System
advancement and skills. So, an attempt was made to formulate spray coated tablets, which could be formulated easily, using the usual tableting techniques The aim of the present study was to formulate BUD compression-coated tablets to prevent drug release in the stomach, had an additional lag phase to retard drug release in the small intestine, and to deliver drug specifically to the colon. Enzymatically controlled delivery systems were developed using karaya gum and Eudragit E100 and Eudragit S100 by spray coating. With the coating of EUD E100, EUD S100, with karaya gum natural polysaccharide as a core tablet polymer was tried in an attempt to optimize drug release in the colon.
MATERIALS AND METHODS
Materials
Budesonide obtained as gift sample from Sun Pharmaceutical IND. LTD-Panoli (batch no. USP PNBDNFL 17007), Karaya gum obtained as gift ample from Yarrow chem. Coating polymers Eudragit E100 and Eudragit S100 obtained from Evonik India Pvt Ltd.
Study of the Flow Properties of the Powder Blends Used in Tablets
The flow properties of the different powder blends used in the core tablets was studied using angle of repose (fixed height cone method), Carr’s compressibility index, and the Hausner ratio methods.
Preparation of Budesonide core tablet
Core tablets containing 9 mg of budesonide were prepared with karaya gum as polymer and lactose monohydrate as the main filler/constituent using direct compression method. The tablets were evaluated for appearance, uniformity of weight, hardness, friability to meet predetermined criteria suitable for coating. Batches were prepared applying Box-behnken Factorial design.
Preparation of Factorial Design
Preparation of Formulation by Using Box-Behnken Factorial Design
Factorial Design
It is well known that traditional experimentation involves great effort and time especially when complex formulations need to be developed. It is desirable to develop an expectable pharmaceutical formulation in shorter period of time using minimum no of man power and raw materials. In the present study batches prepared by 33 factorial design was employed to study the effect of independent variable i.e. concentration of Karaya Gum (X1), %Wt. gain by Eudragit E100 (X2), %Wt. gain by Eudragit S100 on dependent variables of % drug release at 5hrs. (Y5) and % drug release at 12 hrs. (Y12).
Levels and variables of Box Benchen Factoril Design
Table 1 Levels and variables
Concentration of Independent variable
Level Factor 1(Conc. Of Karaya Gum)
Factor 2(% Wt. gain of Eudragit E100)
Factor 3(% Wt. gain of Eudragit S100)
-1 60 1.5 0
0 70 3 5
1 80 4.5 10
Dependent Variable Y5 % Drug release at 5hrs.
Y12 % Drug release at 12hrs.
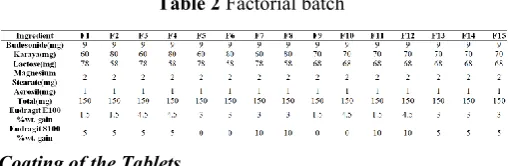
Table 2 Factorial batch
Coating of the Tablets
Spraying dispersions for coating were prepared as described in the previous report for coating with Eudragit E100 as enteric coating and Eudragit S 100 as subsequent coating. Coating was done in different % concentration as per factorial design batches. Eudragit E100 was in range of in different range of 1.5, 3, and 4.5 %wt. again where Eudragit S100 as 0, 5, 10 %wt. gain
Coating solution
Enteric coating solution of Eudragit E 100
Table 3 Enteric coating solution of Eudragit E 100
Ingredients Amount
Eudragit E 100 5gm Talc 1% PEG 5%w/w Color q.s. Acetone 50ml IPA 50ml
Eudragit S 100 coating solution
Table 4 Enteric coating solution of Eudragit S 100
Ingredients Amount
Eudragit S 100 5gm Talc 1% PEG 5%w/w Color q.s. Acetone 50ml IPA 50ml
Method used for coating study
In present study Spray coating method was used for coating of the tablets.
1. Required quantities (100 no.) of tablets were loaded in coating pan.
2. Pan rpm was set to 35-40 rpm and temperature adjusted 50ºC
3. For the proper coating spray gun was adjusted over tablets, than started the spraying pf solution. After spraying coated tablets were collected from the pan.
Various parameters under the coating were as follows.
Table 5 coating parameters
Parameter Value
Inlet Air temperature 50-55ºC Exhaust temperature 30-35ºC Atomization (bar) 2 Spray rate 10 Pan RPM 35-40
Post compression parameters of tablet
Dissolution Test
0.1N HCL (900 ml) as the average gastric emptying time is 2hrs. Then the dissolution medium was replaced with 7.4 ph phosphate buffer solution (900ml) and tested for 3hrs as the average intestinal transits time is 3hrs. And finally the dissolution medium was replaced with 6.8ph Phosphate buffer solution (900ml) containing rat caecal content. At the end of each time interval, 5ml of samples were withdrawn and 5ml fresh media was added and samples were analyzed using UV spectrometer at 243nm.
Stability Study
Post compression parameters of an optimized batch were calculated on 0 day of the study and after 30 day of study. Result are mentioned in the table. Comparison was done between 0 day and 30 day results.
RESULT AND DISCUSSION
Standard Calibration of Budesonide
Standard plot of Budesonide using 0.1N HCL as solvent
Standard calibration curve of drug in 0.1N HCL was depicted as in figure. The data are as shown below. The data is correlated with coefficient (R2) of 0.9969
Table 6 calibration of budesonide in 0.1 N HCL
Concentration (µg/ml)
Absorbance at 244nm ±SD (n = 3)
2 0.268±0.002 4 0.331±0.0016 6 0.404±0.008 8 0.455±0.002 10 0.514±0.0018
Fig 4 Standard calibration curve in 0.1 N HCL
Standard plot of Budesonide using 7.4 Phosphate Buffer
Standard calibration curve of drug in 7.4 pH phosphate buffer was depicted as in figure. The data are as shown below. data is correlated with coefficient (R2) of 0.9977
y = 0.030x + 0.209 R² = 0.996 0
0.1 0.2 0.3 0.4 0.5 0.6
0 2 4 6 8
Calibration Curve in 0.1 NHCL
Table 7 calibration of budesonide in 7.4pH Phosphate buffer
Concentration (µg/ml)
Absorbance at 244nm ±SD (n = 3)
2 0.248±0.0016 4 0.362±0.0021 6 0.453±0.0021 8 0.566±0.0012 10 0.689±0.0015
0.1N HCL (900 ml) as the average gastric emptying time is 2hrs. Then the dissolution medium was replaced with 7.4 ph lution (900ml) and tested for 3hrs as the average intestinal transits time is 3hrs. And finally the dissolution medium was replaced with 6.8ph Phosphate buffer solution (900ml) containing rat caecal content. At the end of were withdrawn and 5ml fresh media was added and samples were analyzed using UV
Post compression parameters of an optimized batch were d after 30 day of study. mentioned in the table. Comparison was done
Standard plot of Budesonide using 0.1N HCL as solvent
Standard calibration curve of drug in 0.1N HCL was depicted in figure. The data are as shown below. The data is
calibration of budesonide in 0.1 N HCL
Absorbance at 244nm ±SD (n = 3)
±0.0016
0.514±0.0018
Standard calibration curve in 0.1 N HCL
Standard plot of Budesonide using 7.4 Phosphate Buffer
Standard calibration curve of drug in 7.4 pH phosphate buffer was depicted as in figure. The data are as shown below. The
) of 0.9977
Fig 5 Standard calibration curve in 7.4 pH Phosphate buffer
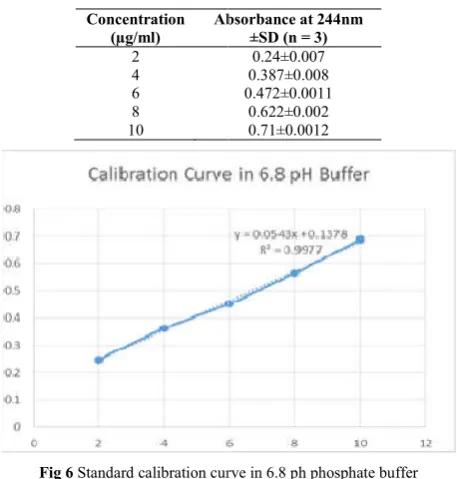
Standard plot of Budesonide using 6.8
Buffer:-Standard calibration curve of drug in 0.1N HCL was depicted as in figure. The data are as shown below the data is correlated with coefficient (R2) of 0.9947
Physical Properties of Drug and Excipients
10 12
Calibration Curve in 0.1 NHCL
y = 0.062x + 0.120 R² = 0.994
0 0.1 0.2 0.3 0.4 0.5 0.6 0.7 0.8
0 2 4
Calibration curve in 7.4 pH Buffer
calibration of budesonide in 7.4pH Phosphate
Absorbance at 244nm
0.0012
Table 8 calibration of budesonide in 7.4pH Phosphate buffer
Concentration (µg/ml)
Absorbance at 244nm
2 4 6 8 10
Fig 6 Standard calibration curve in 6.8 ph phosphate buffer
Table 9 Pre compression parameters
Parameters Bulk
Density (g/cm)3
Tapped Density (g/cm)3
F1 0.67 0.83 F2 0.71 0.89 F3 0.55 0.62 F4 0.64 0.75 F5 0.64 0.88 F6 0.66 0.74 F7 0.59 0.78 F8 0.68 0.84 F9 0.58 0.67 F10 0.67 0.63 F11 0.70 0.74 F12 0.68 0.68 F13 0.67 0.63 F14 0.58 0.61 F15 0.64 0.76
Standard calibration curve in 7.4 pH Phosphate buffer
Standard plot of Budesonide using 6.8 pH Phosphate
Standard calibration curve of drug in 0.1N HCL was depicted as in figure. The data are as shown below the data is
) of 0.9947
Physical Properties of Drug and Excipients
6 8 10 12
Calibration curve in 7.4 pH Buffer
calibration of budesonide in 7.4pH Phosphate buffer
Absorbance at 244nm ±SD (n = 3)
0.24±0.007 0.387±0.008 0.472±0.0011
0.622±0.002 0.71±0.0012
calibration curve in 6.8 ph phosphate buffer
Pre compression parameters
Tapped Density
3
Hausner’s Ratio
Angle of Repose
Carr’s Index
(%)
Formulation And Evaluation of Colon Targeted Drug Delivery of Budesonide Using Modified Codes System
In-vitro Evaluation of Factorial batches F1 to F5
In-vitro Evaluation of Factorial batches F6 to F10
In-vitro Evaluation of Factorial batches F11 to F15
Optimization of batch on the basis of release profile of drug
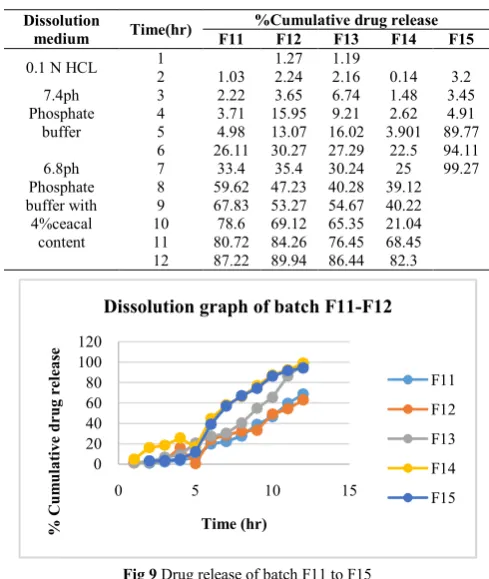
The in-vitro drug release shows 100% drug release in pH
6.8 buffer with caecal content up to 12hrs. Drug release
before completion of lag time was found to be less than
5%. The result obtained in the in-vitro drug release study
tabulated in the table to and also the graphical response
represented in fig to. The drug release profile showed
sigmoid release pattern which is considered to be ideal
for colon drug delivery system.
According to the cumulative drug release, F7 F8 and F12
were optimized because of we compare drug release of
all the batches batch 5 10 and 10 show release 89.77%,
89.84% , 79.44% drug release within 5hrs which is not
proper for the colon targeting. And rest all batches are
also going out of acceptance limit of release of drug
more than 5% within 5hrs.In batch F7 F8 and F12 there
is less than or near to 2% drug release obtained but
considering the Dependent variable Y12 the release of
F12 batch is only 63% at 12hrs which cannot be
accepted. So batch F7 and F8 are optimized one where
further again considering the release of F7 (98.25%)
batch was greater than F8 batch (85%). F8 batch was
considered the Optimized one.
Table 10 Drug release of batch F1 to F5
Dissolution
medium Time(hr)
%Cumulative drug release
F1 F2 F3 F4 F5
0.1 N HCL 1 1.27 1.19
2 1.03 2.24 2.16 0.14 3.2 7.4ph
Phosphate buffer
3 2.22 3.65 6.74 1.48 3.45 4 3.71 15.95 9.21 2.62 4.91 5 4.98 13.07 16.02 3.901 89.77
6.8ph Phosphate buffer with 4%ceacal
content
6 26.11 30.27 27.29 22.5 94.11 7 33.4 35.4 30.24 25 99.27 8 59.62 47.23 40.28 39.12 9 67.83 53.27 54.67 40.22 10 78.6 69.12 65.35 21.04 11 80.72 84.26 76.45 68.45 12 87.22 89.94 86.44 82.3
Fig 7 Drug release of batch F1 to F5 0
20 40 60 80 100 120
1 2 3 4 5 6 7 8 9 10 11 12
C
u
m
u
la
ti
v
e
%
D
r
u
g
r
e
le
a
se
Time(Hr)
Dissolution graph of batch F1-F5
F1 F2 F3 F4 F5
Dissolution medium
Time (hrs.)
%Cumulative drug release
F6 F7 F8 F9 F10
0.1 N HCL 1 1.19 4.7 2 1.03 0.24 2.16 16.14 3.2 7.4ph
Phosphate buffer
3 2.22 0.65 6.74 18.48 3.45 4 3.71 1.5 9.21 25.62 4.91 5 4.98 2.11 16.02 89.94 79.77
6.8ph Phosphate buffer with
4%ceacal content
6 26.11 30.27 27.29 94.6 94.11 7 33.4 43.4 37.24 98.22 98.99 8 59.62 55.23 42.28
9 67.83 69.27 54.67 10 78.6 78.12 65.35 11 80.72 84.26 76.45 12 90.22 98.97 85.3
Fig 8 Drug release of batch F6 to F10
0 20 40 60 80 100 120
0 5 10 15
%
C
u
m
u
la
ti
v
e
d
ru
g
r
el
ea
se
Time (hr)
Dissolution graph of batch F6-F10
F6
F7
F8
F9
F10
Table 11 Drug release of batch F11 to F5
Dissolution
medium Time(hr)
%Cumulative drug release
F11 F12 F13 F14 F15
0.1 N HCL 1 1.27 1.19
2 1.03 2.24 2.16 0.14 3.2 7.4ph
Phosphate buffer
3 2.22 3.65 6.74 1.48 3.45 4 3.71 15.95 9.21 2.62 4.91 5 4.98 13.07 16.02 3.901 89.77 6.8ph
Phosphate buffer with
4%ceacal content
6 26.11 30.27 27.29 22.5 94.11 7 33.4 35.4 30.24 25 99.27 8 59.62 47.23 40.28 39.12 9 67.83 53.27 54.67 40.22 10 78.6 69.12 65.35 21.04 11 80.72 84.26 76.45 68.45 12 87.22 89.94 86.44 82.3
Fig 9 Drug release of batch F11 to F15 0
20 40 60 80 100 120
0 5 10 15
%
C
u
m
u
la
ti
v
e
d
r
u
g
r
e
le
a
se
Time (hr)
Dissolution graph of batch F11-F12
Surface Response curve of X1 X2 and X3 variables at Y5 and Y12 hrs
Surface response curve of dependent variable Y5
Fig 10 Response curve of effect of X1 X2 and X3 on Y5
Surface response curve of dependent variable Y12
Fig 11 Response curve of effect of X1 X2 and X3 on Y12
Equation
Full Model
Y5
=16.47-3.89x1-1.82x2-38.63x3-5.05x1x2+7.10x1x3+1.10x2x3-5.96x12-1.01x22+28.65x32
Y12 = 97.11-3.15x1-2.08x2-9.30x3-2.23x1x2-1.42x1x3-1.02x2x3+0.039x12-11.19x22-3.08x32
Stability Study for an Optimized batch
Post compression parameters of an optimized batch were calculated on 0 day of the study and after 30 day of study. Result are mentioned in the table. Comparison was done between 0 day and 30 day results.
Table 12 Post compression parameters of optimized batch
Parameter At day 0 At day 30
Hardness 6 6 % Friability 0.39 0.40 %drug content 96.52 96.50
Comparison of invitro release profile at day 0 and day 30
Table 13 Comparison of invitro release profile
Time %CDR at
day 0
%CDR at day 30
1 0 0
2 0 0
3 0.65 0.69
4 1.5 1.7 5 2.11 2.14 6 30.27 31.2 7 35.4 36.24 8 47.23 48.1 9 53.27 53.4 10 69.12 70.21 11 84.23 84.25 12 98.97 97.12
Fig 12 Comparison between dissolution profiles of optimized batch
Comparison between dissolution profile of optimized batch at day 0 and day 30
The percentage of drug elease before and after storage was found to be similar. Dissolution profiles before and after storage are nearly overlapping. The change in the drug release pattern i.e. was not that significant difference of the tables tested after 30 daysfrom the dissolution profile of optimized batch tested before a month.
References
1. Yahia S A et al ‘‘Optimization of Budesonide Compression-Coated Tablets for Colonic Delivery” AAPS PharmSciTech, 10(1). 2009
2. Trivedi et al. Colon Targeted Delivery System (Codestm): Propitious Approach In Targeting Colon” World Journal of Pharmacy and Pharmaceutical Sciences Volume 6, Issue 4, 768-789
3. Sinha V. R., Kumria R. Polysaccharides in colon-specific drug Delivery. Int. J. Pharm.[PubMed] [Cross Ref]
4. Seth Amidon,1 Jack E. Brown,1 and Vivek S. Dave1,2AAPS PharmSciTech, Vol. 16, No. 4, August 2015 (# 2015) DOI: 10.1208/s12249-015-0350-9 5. Philip AK, (Colon Targeted Drug Delivery Systems: A
Review on Primary and Novel Approaches)Department of Pharmaceutics, School of Pharmacy, University of Nizwa, Birkat Al Mouz, Nizwa-616, Sultanate of Oman. 6. Anekant Jain (Perspectives of Biodegradable Natural.
Polysaccharides for Site-specific Drug. Delivery to the Colon). J Pharm Pharmaceutical (www. cspsCanada.org) 10 (1): 86-128, 2007
7. Ciftci, K. (Alternative approaches to the treatment of colon cancer). Eur. J. Pharm. Biopharm., 1996, 42,160-170.
8. Macleod, G.S., Fell, J.T., Collett, J.H., Sharma, J.L., Smith, A.M. (Selective drug delivery to the colon using pectin, chitosan, hydroxypropyl methylcellulose film coated tablets). Int. J. Pharm. 1999, 187,251–257. 9. Niranjan GoudKotla et al. (Recent Developments in
Colon Specific Drug Delivery Systems: Approaches Promising in Targeting Colon). International Journal of
Design-Expert® Software Factor Coding: Actual release 5 hr (%)
Design points above predicted value
Design points below predicted value 89.84
0.561
X1 = A: con karaya X2 = C: con s100
Actual Factor B: con e100 = 3
0 2 4 6 8 10
60 65
70 75
80 -20
0 20 40 60 80 100
re
le
a
se
5
h
r
(%
)
A: con karaya (mg) C: con s100 (%)
Design-Expert® Software Factor Coding: Actual release 12 hr (%)
Design points above predicted value Design points below predicted value
100
63.627
X1 = A: con karaya X2 = B: con e100 Actual Factor C: con s100 = 5
1.5 2.1 2.7 3.3 3.9 4.5
60 65
70 75
80 60
70 80 90 100 110 120
re
le
as
e
12
h
r
(%
)
A: con karaya (mg) B: con e100 (%)
0 20 40 60 80 100 120
0 2 4 6 8 10 12 14
Formulation And Evaluation of Colon Targeted Drug Delivery of Budesonide Using Modified Codes System
Pharmaceutical and Clinical Research 2014; 6(1): 101-106
10. S. L. Kosaraju (Colon Targeted Delivery Systems: Review of Polysaccharides for Encapsulation and Delivery). Critical Reviews in Food Science and Nutrition,45:251-258(2005)
11. Libo Yang (Colon-specific drug delivery: new approaches and in vitro/in vivo evaluation) International Journal of Pharmaceutics 235 (2002) 1-15
12. Hemangi Deepak Trivedi. (Colon Targeted Delivery System (CODESTM): Propitious Approach in targeting colon). World Journal of Pharmacy and Pharmaceutical Sciences Volume 6, Issue 4, 768-789 13. R. L. Carr. Classifying flow properties of solids. Chem.
Eng. 72:69-72 (1964).
14. Kulkarni et al. CODES TECHNOLOGY: A novel approach for colon target-a review article WJPR Vol 7, Issue 1, 2018.
*******
How to cite this article:
Krutika A. Kulkarni et al (2018) 'Formulation And Evaluation of Colon Targeted Drug Delivery of Budesonide Using Modified Codes System', International Journal of Current Advanced Research, 07(4), pp. 11387-11392.