Cross Mark Pak. J. Anal. Environ. Chem. Vol. 19, No. 1 (2018) 1 – 27
http://doi.org/10.21743/pjaec/2018.06.01
Photocatalytic Conversion of CO
2Using ZnO
Semiconductor by Hydrothermal Method
Kayode Adesina Adegoke
1,2, Muzaffar Iqbal
3, Hitler Louis
4, Saad Ullah Jan
3,
Anam Mateen
5and Olugbenga Solomon Bello
1*1
Department of Pure and Applied Chemistry, Ladoke Akintola University of Technology, P. M. B. 4000, Ogbomoso. Oyo State, Nigeria.
2Department of Chemistry, University of Pretoria, Pretoria, 0002, South Africa. 3
National Center for Nanoscience and Technology, University of Chinese Academy of Sciences Beijing 100191 China. 4Department of Pure and Applied Chemistry, University of Calabar, P. M. B 1115 Calabar, Cross River State, Nigeria.
5
Department of Chemistry, University of Sargodha, Sub-Campus Bhakkar, Pakistan. *Corresponding Author Email: [email protected]
Received 30 March 2017, Revised 05 March 2018, Accepted 24 May 2018
---Abstract
Photocatalytic conversion of CO2using ZnO semiconductor is an effective, simple, economical
and attractive way of combating energy problems resulting from anthropogenic emissions of CO2
i.e. greenhouse gases to the atmosphere. This article focuses on current advances in CO2
photoreduction by hydrothermal method. The fundamental photocatalytic CO2reduction system
by photocatalysts especially ZnO has been explicated. The synthetic protocol of ZnO and its growth mechanism in alkaline solution is elaborated with specific illustration of defect chemistry and its influence on CO2reduction activity and selectivity. Conclusively, brief challenges of its
current state and future prospects were also discussed.
Keywords: ZnO semiconductor, Metal oxide photocatalysts, Hydrothermal method, Nanostructures.
---Introduction
Global warming has become key challenge for the world; it is mainly due to increasing of greenhouse gases level in the environment. Carbon dioxide (CO2) is the main contributor of this fact; it is
mainly from fossil fuel combustion [1]. The Organization for Economic Cooperation and Development (OECD) Environmental viewpoint to 2050 has projected universal greenhouse gas emission to increase to around 50% from 2012 to 2050, while CO2emissions driven by the utilization
of the conventional energy would reach up to 70 % [2-5]. In addition, by 2030, fossil fuel which is the major carbon resource has been anticipated to raise 20% of energy deliver global instead of the limited yield and high cost presently, enclosed by BP Energy Outlook 2030 [5-6]. The present use of nuclear fuels and fossil in our societies has unlimited unpleasant consequences. Fossil fuel
ignition is the major cause of the changing in global climate. The atmospheric temperature is balanced at an equilibrium level by getting energy and back in to the space. Without earth atmosphere, the temperature of the earth surface would be 18oC. This natural “greenhouse effect” maintains the surface temperature appropriate for existence, around 15oC [7]. The additional greenhouse gases are released to the atmosphere due to the fat growing industrial development. The major supplier to these alarming rates of emissions is CO2 from the fossil fuels combustion.
Researchers estimated that these emissions cause by human has resulted in to an increase in the surface temperature of earth’ sup to 0.6oC [8-9]. In the last centuries the concentration of atmospheric CO2 has been varied between 200 to 300 ppm by
volume [7] However, in 2001 it reached to 370
ppm, and 399.55 ppm in January 2013 [10]. To invalidate this critical trend, alleviation technologies such as carbon consumption and storage have been reported during the last era. One of the most advantageous processes for the consumption of the environmental CO2 is the
photocatalytic reduction into the value added chemicals like conventional fuel CH4, CH3OH, etc.
This implies that photocatalytic CO2reduction, is
of principal significance in economic assistance by using present existing industry facilities [10].
Scientists over the world have been anxious about the issue of environment and energy, due to the less energy sources as well as environmental problems created by their utilization. This has led them in looking for substitute methods to take benefit of the clean and renewable energy resources, for instance sunlight [11]. Consequently, rapid emergence of carbon dioxide emission and the hazard pose to the environment have led us to the result that it is essential to take proper approaches to stop the building up of CO2[11-12]. Some existing ways to
combat the concentration of CO2in the atmosphere
include removal [13] sequestration [14-15] and conversion [15-17]. The promising method is capturing CO2from the atmosphere and converting
it into valuable additive chemical such as CH4and
CH3OH using solar energy [18-19]. By developing
this anthropogenic carbon cycle, simultaneously resolve the problem of the energy storage and global warming. In fact, precombustion or post combustion, CO2capture followed by compression
and geological sequestration is one of those efforts made to reduce CO2 emissions, but is energy
intensive, hence costly. Therefore, preferable way to reduce CO2is recycling it as fuel with energy
input from abundant source [20]. Recently, photo catalysis technology to switch CO2 into fuel has
taken the great attention of numerous scientists. It simply uses visible light or ultraviolet (UV) as source for semiconductor catalysts excitation, and the photo-excited electrons reduce water and carbon dioxide on the catalyst surface and form energy-bearing materials [21-22].
However, serious attention has been focused on the chemistry of nano-materials and reported that the chemical and physical properties
of inorganic materials highly dependent on the structure, particle size and morphology [22-25], control over these factors to efficiently change their properties in an attractive method is a difficult job in the field of material synthetic chemistry [26-27]. Due to tremendous technological applications such as high stability (thermal and chemical), semiconductor nanostructures have stimulated intensive interest.
method for growing ZnO nanorods proved to be a serious challenge to both scientists.
In this review, ZnO semiconductors developed or grown via hydrothermal method is our focal point, even though enormous number of literature has provided general evaluations of ZnO nanostructures [47-55]. However, we have
reported here for the first time the detailed concepts of photocatalytic CO2 reduction by ZnO
semiconductor by hydrothermal method.
Basic concepts of photocatalytic reduction ofCO2
Carbon (IV) oxide (CO2),is one of a good
number thermodynamically stable compounds of carbon that exist as a linear molecule. Reduction of CO2 to useful hydrocarbon fuels through photo
catalytic method require input energy to split the C=O bond, and form the bond C–H, it involves the involvement of corresponding number of protons and multiple electrons [56]. Because of its significant high chemical state (C4+) of Carbon atoms in CO2, the process can only take place with
the aids of the support called reducing agents. Thus, due to its unique nature: non-toxicity, richness and effectiveness, water (H2O) is a
preferable aspirant to act as the agent of reduction (i.e. reducing agents) compared with H2, S2
−
, SO3
2−
and amines counterparts. Photocatalytic reduction of CO2 with H2O is an uphill reaction
with a positive change in Gibbs free energy:
CO2+ 2H2O→ CH3OH +3/2 O2(ΔG° = 702.20 kJ
mol−1) and
CO2+ 2H2O→ CH4+ 2O2(ΔG° = 818.30k Jmol
−1
).
Consequently, to overcome these reaction barriers, there is need to used input energy that is supplied by incident light. As shown in (Fig. 1), the electron gets excited from the low energy level (valence band VB) to high energy level (conduction band CB) leading to simultaneously generation of equal number of holes in the conduction band when aflux of photons is absorbs by semiconductor. The electron–hole pairs resulted from photo generation separated from each other and energetically travel to catalytic active sites in the surface of semiconductor where then it encountered the electron with reducing power and
this convert CO2in the presence of H2O to value
added hydrocarbon fuels such as CH3OH, CO and
CH4 whereas H2O oxidation occurs due to the
oxidation capability of hole [57].
Figure 1. Diagrammatic representation of photo induced production of an electron–hole pair in semiconductor that transfers to the outside surface for CO2photoredox [56]
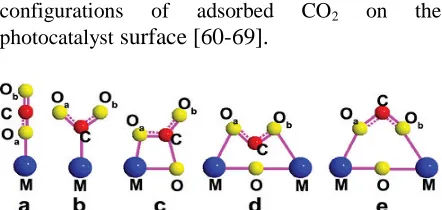
Nevertheless, It is important understand activation mechanism and initial carbon (IV) oxide absorption in such a way that effective photocatalyst could created to encourage absorption of CO2. Fig. 2 gives possible
configurations of adsorbed CO2 on the
photocatalystsurface [60-69].
Figure 2. Possible configurations of adsorbed CO2 on the
photocatalyst surface [60]
The products selectivity is one of problems to be considered in the reduction of CO2 that
involves photocatalytic process, which may be affected by reaction condition, photocatalysts, including the thermodynamic reduction potentials. Figure 3 gives diverse of semiconductor photocatalysts which are relative to the redox potential of various species. Two major reasonable pathways for formation of CH4are proposed:
I) CO2→ HCOOH → HCHO → CH3OH→ CH4
II) CO2→ CO → C •→ CH
However, because of complex multi-electron transfer process involved [61,72-75], the understanding of selectivity and mechanism of photocatalysis still remain a challenges.
Figure 3. Band gap energies of various semiconductor photocatalysts along with conduction band (CB), valence band (VB) potentials [70-71]
The concept of artificial photosynthesis by metal oxide photocatalysts.
Photocatalytic CO2 conversion utilizes
semiconductors to promote reactions under the influence of light irradiation is called artificial photosynthesis. Here, our focus is only on the artificial photosynthesis by metal oxide photocatalysts. The fundamental route can be summarized into three steps:
(a) Generation of charge carriers (electron–hole pairs) upon the absorption of photons with suitable energy from light irradiation.
(b) Separation and transportation of charge carrier.
(c) Reaction of the charge carriers and surface species [76-78].
Photocatalytic conversion of CO2 is seen
to be a complicated combination of photochemical and photophysical processes. This is because the redox reaction is initiated by photo-excitation when the energy of incident photons is equal to or higher than the band gap of a semiconductor is received by a photocatalyst [79]. Then the electrons are excited from the valance band to the conduction band [80]. Fig. 4 reveals the electrons and holes undergo intra-band transitions. They have the ability to travel to the surface, combine at
the trap sites (i.e. recombination process) through radiative or non-radiative pathways. Otherwise, these electrons can travel to the surface of semiconductor and react with surface adsorbed species of CO2 if recombination happens slower
than the reactions during transitions [81]. However, not all the electrons reaching the surface have the ability to reduce CO2 which is a
thermodynamically inert and very stable compound [76]. Compared with most of the reduction methods mentioned above which require high-energy input, either at high temperature and/or under high pressure [82], photosynthesis does not require extra energy except solar irradiation thus making it to have better advantages over its peers. This is because the required energy for conversion process must emerge from a process that does not release additional greenhouse gases directly into the environment. This means that other available technologies for the CO2conversion
are not the best one contained by these criteria.
Figure 4. Schematic diagram of photo excitation and electron transfer process [79]
Moreover, photogenerated electrons at higher reduction potential level can offer driving force (also called over-potential) for the expected chemical reactions. This is due to the fact that reduction potential measures the capability of chemical specie to gain electrons. Species with a lower (more positive) reduction potential will gain electrons (i.e. be reduced) and those with a higher (more negative) reduction potential will lose electrons (i.e. be oxidized) [79, 83]. To facilitate the reduction of CO2into useful chemical (e.g. CO
semiconductor should have more negative chemical potential as well as hole needed to be on more positive potential side for water oxidation. Therefore, (Table 1) illustrates the pathways for the production of renewable fuels especially solar and the associated potentials at pH = 7 [84].
Table 1. Reaction mechanisms for the production of solar fuels and the associated potentials.
Reaction Eo(V vsNHE) Eqn No.
CO2+2e−→•CO2− −1.90 (1)
CO2+2H++2e−→HCOOH −0.61 (2)
CO2+2H++2e−→CO+H2O −0.53 (3)
CO2+4H++4e−→HCHO+H2O −0.48 (4)
CO2+6H++6e−→CH3OH+H2O −0.38 (5)
CO2+8H++8e−→CH4+2H2O −0.24 (6)
2H2O+4h+→O2+4H+ +0.81 (7)
2H++2e−→H
2 −0.4 (8)
From a thermodynamic approach, formation of methane and methanol are more favorable in CO2 reduction, since these reactions
take place at lower potentials. However, the kinetic drawback makes methane and methanol formation more difficult and complex than carbon monoxide, formaldehyde and formic acid because more electrons are required for the former reactions [85]. In addition, the 2–8 electrons and protons reactions to obtain the desired products are extremely difficult and time consuming. As a result of the complicated nature of the inorganic photocatalyst surface, the interaction between photocatalyst and absorbed species may undergo a series of one-electron processes instead of a multi-one-electron, multi-proton process, thus making the actual redox potential required to be dependent on the reaction pathway. For example, if CO2reduction is initiated
by single electron reduction of CO2 to CO2
−
, the potential is around −1.9V vs NHE. With such concern, being able to discharge multiple electrons with protons at a time is important to improve reaction efficiency [79]. Thus, generating sufficient electron–hole pairs, separating charges efficiently and providing active catalytic sides are the paramount factors for CO2photoreduction.
Although, photoreduction of CO2 shows
great potential [86-87], at present one of the greatest drawbacks is the low conversion
efficiency due to some associated major factors which bound the efficiency: (i) mismatching between the absorption ability of semiconductor and the solar spectrum; (ii) poor charge transfer separation efficiency; (iii) low solubility of CO2
molecule in water (approximately 33 mol in 1 ml of water at 100 kPa and room temperature); (iv) reverse reactions during reduction of CO2; and (v)
competition reaction of water reduction to hydrogen [88]. The solar spectrum consists of 4 % of the UV radiations and 43% visible region. To find a photocatalyst which can absorb visible light, enough higher conduction band position is one of the main goals of the research that remains unresolved. Overpotential is necessary as a driving force for charge carrier transport and reactions, thus practical requirement for CO2 conversion is
usually greater than the theoretical energy required to produce the desired products [76, 89]. Even though; the direct matching the band gap of a semiconductor to the solar spectrum is challenging, hence, several strategies have been used to improve the absorption ability of an inorganic photocatalyst. Doping with elements has been a pursuit to sensitize photocatalyst with a wide band gap toward visible light absorption. As a broad and active topic, doping of photocatalysts with metal ions (Fe3+, Zn2+, W6+, etc.) and non-metal ions (C, N, S, B, etc.) have already been widely studied [90–94]. Therefore, a brief and general introduction is mentioned here. Doping does not only retard the fast charge recombination, but also introduce defect states (inter-band states or mid-gap levels) [95]. For instance, Zhang et al [96] reported that the narrowed band gap of a semiconductor after doping with non-metal ions (e.g. N or C) can be ascribed to the mixing of p-states of the dopants with O2p p-states to form a new valance band [96]. However, the function of doping on CO2 conversion is still arguable and
remains understudy.
heterostructures. With the existence of QDs, the visible light response of the photocatalysts can be easily adjusted. In addition, QDs can also make use of hot electrons to create multiple charge carriers when excited by a single high energetic photon thus resulting to a high amount of the charge carriers [98]. Similarly, organic dyes are often used as sensitizers to boost the visible light absorption ability of a semiconductor. Here, under irradiation, dyes can inject photo-excited electrons into the semiconductor conduction band. Hence, the electron transfer efficiency between the dye sensitizer and the semiconductor depends on many factors, which include the LUMO level of the dyes and the conduction band edge of semiconductors [99]. When CO2 is being reduced by the
photogenerated electrons, the utilization of an equal number of photogenerated holes should also be employed. Otherwise, the accumulation of the holes in a photocatalyst can probably increase the charge recombination and thereby shorten the lifetime of electrons.
Consequently, it is believed that holes could play a negative role in the photocatalytic reactions which lead to the photocorrosion of the photocatalyst and make it unstable if they were not used efficiently. This makes application of artificial electron donor to scavenge the holes a most popular solution [100]. However, the process and energy used in synthesizing the artificial electron donor must be taken into consideration since it may cause more CO2emission which result
into more problems instead of solving the problem. Water is considered to be the ideal electron donor, nevertheless, the large water oxidation potential is the main drawback. Over the past decade, only very few photocatalysts that can reduce CO2 and
oxidize water simultaneously have been reported [101-102]. Competition from water reduction process by photogenerated electrons is a challenging area when water is used as a electron source donor.
In comparison to most of the CO2
reduction routes, reducing water is a relative easy process in term of kinetics and thermodynamics. In thermodynamics aspect, the reduction potential of water to hydrogen is 0.0V (pH=0) which is more positive than CO2reduction to CO, formic acid and
formaldehyde, respectively. In kinetics aspect, water reduction has a 2-electrons process which is more facile than most of the CO2reduction which
required 4–8 electrons. While reduction of CO2 is
also limited by its low solubility in water, the water reduction does not suffer from the similar problem, thus the chance for electrons to meet and react with water is much higher than with CO2counterparts.
Although very limited investigation has been reported to address this problem but it is generally agreed that the reaction selectivity can be controlled by modifying photocatalysts morphology, changing the exposed facets or parameters and introducing new reaction sites [103]. Thus viewed that particular atom arrangement on the surface can be more favorable to absorb CO2 molecules than water molecule on
the surface. As a result of this trend, two different morphologies of Cu2O have been reported to have
dramatic difference in products’ selectivity [104]. Additionally, co-catalyst loading has also been claimed to be able to vary the reduction products’ selectivity where Ag and Cu are commonly used as co-catalysts for CO2reduction whereas the loading
of Pt or Au is more favorable for hydrogen production [79].
Synthetic methods of ZnO nanostructure for photocatalytic conversion of CO2
Different methods have been developed to synthesize numbers of semiconductor photocatalysts. These were divided based on their preparation routes and mechanism, approaches either physical or chemical. The physical approach majorly utilizes mechanical force as an efficient means of building the solid interface in the heterostructure [105-108]. For example the pulverization of graphitic carbon nitride (g-C3N4)
to lesser magnitude with the aid of a planetary mill to improve and make contact between g-C3N4and
WO3 for preparation of the g-C3N4/WO3 hybrid
system has been reported to demonstrate a high catalytic activity in the CO2 photoreduction to
CH3OH [109]. Moreover, utilization of
inter-particle electrostatic force is another competent way reported to fabricate heterostructure. The HRTEM results show that g-C3N4 and KNbO3
hetero-junction is of better quality under visible-light illumination compared to pure C3N4 in catalyzing
the photoreduction of CO2to CH4[110].
Though the physical approach is convenient and simple way for controlling the different proportion of materials whereas the chemical approach is a more well-known approach to build the heterostructure due to the fact that the interface produced through this approach is more stable because the chemical bonding connected the materials involved. The chemical approach usually employs one material as support/substrate and another is in-situgrown onto its surface by means of chemical adsorption. To this point, numerous synthetic methods such as deposition– precipitation, [111] hydrothermal [112], calcinations [113-116] and electrode position, [117] were used to build a contact between the nanomaterials, physical vapor deposition metal– organic chemical vapor deposition [118–120], wet chemical technique [121–123], molecular beam epitaxy [124], sputtering [125], pulsed laser deposition [126-127], electrospinning [128-130], flux techniques [131], and also top down techniques via etching [132]. However, these techniques are costly and the selection of substrate is limited and difficult in handing.
Comparatively, among these techniques, physical vapor deposition and flux techniques generally involve an elevated temperature, and the impurities can easily be incorporate in the ZnO nanostructures. For that reason, many flexible organic substrates may seem not to be able to incorporate for future foldable and manageable electronics [133-134]. Whereas, MBE and MOCVD have ability to produce high quality ZnO nanowire array, but more often than not experience the limitation that has to do with less product yield, not uniform, and selection of substrate is limited. Moreover, the price of the experiment is commonly high, this made them to be less broadly adopted. Pulsed laser deposition, sputtering and top down techniques proved to boast of less reproducibility compared with other approaches. Electrospinning produces highly crystalline fibers. The hydrothermal method is a simplistic used method among them, with which the heterostructure can be synthesized by one-step
reaction. The synthesis of ZnO semiconductors was demonstrated by a number of approaches.
Consequently, it is highly desirable to develop a simple stratagem for site-selective synthesis of nanoparticles on the ZnO nanostructure arrays while maintaining the structures for photoelectrochemical application. By comparative speaking, hydrothermal method are preferable for several reasons including low price, less dangerous, and thus capable of simple scaling up [133-134]; the growth occurs at a relatively low temperature, compatible with flexible organic substrates, no need of metal catalysts, and can be incorporated with well-developed silicon technologies [135]. Furthermore, there are different parameters that can be changed to effectively control the geometry and properties of the material [136-137]. These methods have been established as a very powerful technique for synthesizing ZnO nanostructures. For instance, Wang et al. [136] prepared facile and efficient strategy to fabricate Ag nanoparticle tip-grafted ZnO nanowire array heterostructures through the hydrothermal treatment, this produced Ag nanoparticle tip-grafted ZnO nanowire arrays (Scheme 1) both under visible-light and UV irradiation [136].
Scheme 1: Diagrammatic representation of the photochemical reactions resulting to the formation of Ag nanoparticle tip-grafted ZnO nanowire arrays [136]
substrates while using hydrothermal method via optimizing the preparation parameters [113]. The growth process of ZnO nanorods was controlled by optimizing the reaction parameters, such as concentration of precursor, growth temperature and growth time. Due to its low price and ability to coat large surface areas, hydrothermal technique is reported in this review as efficient and simple method to adopt. Verges et al [122] reported the hydrothermal method of synthesizing ZnO nanostructures. But, this could not infuse much intension till when Vayssieres et al [123] successfully used the technique for the controlled synthesis of ZnO nanorods on glass and Si substrates by the thermal decomposition of methylamine and zinc nitrate. To start the growth from the substrate, a very thin layer of ZnO nanoparticles was grown on the substrate. Methenamine, also known as hexamethylen-etetramine (HMT) or hexamine is a highly water soluble, non-ionic tetradentate cyclic tertiary amine. Thermal degradation of HMT releases hydroxyl ions which react with Zn2+ ions to form ZnO [111]. The aqueous solutions of zinc nitrate and HMT have ability to produce the following chemical reactions.
(CH2)6N4+6H2O↔6HCHO+4NH3 NH3+H2O ↔
NH4 +
+ OH−
Zn(NO3)2•6H2O→ Zn 2+
+2(NO3)
-+6H2O 2OH
−
+ Zn2+↔ ZnO+H2O
The general trend is that, the role of HMT was to provide the hydroxyl ions to drive the precipitation reaction [111-113]. The concentration of HMT plays a very important role for the synthesis of ZnO nanostructure since OH- is robustly related to the reaction that produces nanostructures. At the start, due to breakdown of zinc nitrate hexahydrate and HMT at an eminent temperature, OH- was introduced in Zn2+ aqueous solution and their concentrations were enlarged. However, the separated colloidal Zn(OH)2clusters
in solution would act partly as nuclei for the growth of ZnO nanorods. During the hydrothermal growth process, the Zn(OH)2 solubility increases
with increase in temperature. When the concentrations of Zn2+ and OH- reach the critical value of the supersaturation of ZnO, ZnO nuclei
formation start at the same time in the aqueous solution. Subsequently, the combination of ZnO nanoparticles causes reduction of the interfacial free energy. Due to the molecules at the surface are energetically less stable than the ones in the interior portion. So the (001) face has greater symmetry compare to other faces growing along the c-axis direction, which is the typical growth plane. Surface-to-volume ratio of the ZnO nanorod is determined by the nucleation. Then insertion of growth units into crystal lattice of the nanorods by dehydration reaction takes place. It was accomplished that the growth habit is determined by thermodynamic factor and by concentration of OH- as the kinetic factor in aqueous solution growth. During the synthetics process of ZnO, mono Zn–OH is formed during the hydrolysis reaction and Zn–OH aggregation results in the formation of crystalline nuclei. Finally the particles in the film are oxidized and turned into oxide form during calcinations and annealing at elevated temperature thus promoting the creation of Zn–O– Zn bonds. The pre-heating at 70°C after each five times of dip coating direct to formation of high number of nuclei which favors the consequent crystal growth, along with the diffusion of Zinc species towards the nucleated grains causing grain growth and formation of nano crystalline ZnO nanorod.
Wang et al (2013) [149] reported that the uniformly distributed, vertically aligned into well-defined ZnO nanowires arrays have more surface density. Fig. 5A and B show the SEM images of the as-synthesized ZnO nanowires by a modified hydrothermal technique. Here, the cross-sectional SEM image (Fig. 5A) revealed that the as- grown ZnO nanowires have lengths and diameters range of ca. 1 µm and 100–200 nm respectively. But, when ZnO nanowire arrays were dipped into an aqueous AgNO3 solution containing 20% ethyl
site-selective growth of Ag nanoparticles on the tips of ZnO nanowires which is achieved by this very simple and straight photo-reduction method. Many other works were also reviewed [136, 138-149].
Figure 5.Top-view SEM images of the ZnO nanowire arrays (A and B) and Ag nanoparticle tip-grafted ZnO nanowire arrays (C and D); the insets show the cross-sectional images of ZnO nanowire arrays (A) and Ag nanoparticle tip-grafted ZnO nanowire arrays (C), respectively [149]
However, it also interesting to show comparison among difference morphology of ZnO in term of the number of active exposure surface area and dimensional. Therefore, Wang et al. focused their studies on the role of the active site for the photocatalysis. They prepared flower spindle sword and umbrella-like ZnO architecture with the hexagonal phase and investigate the photocatalytic efficiency, the result demonstrated that the flower-like ZnO possessed more irregular Zn sites than that of the spindle and sword-like ZnO with more naked Zn atoms on the defects, promoting the photoreduction reaction. Therefore relatively lower crystallinity and more defect responsible for enhanced photocatalytic activity [150]. Liu, et. al, extensively investigated ZnO nanowires for the photodegradation of organic dyes. A high photocatalytic activity and stability was ascribed to increased defects sites in ZnO nanowires. When the nanowires diameter is less than the critical value (about 50 nm) the ZnO effective band gap will increase as the redox potential there and the photogenerated charge carriers will possess higher reducing /oxidizing capabilities. The recombination of photogenerated charge carriers will be deterred with higher band gap, which will increase the catalytic performances [151].
For high photocatalytic efficiency, it is needed to have both low and high energy facets with suitable ratio in the nanostructure so as to reduce the charge recombination. The photocatalytic activity can also be enhanced by morphology modulation of other catalyst like ZnO. Different morphology of ZnO shows a significant change in stability. The Zn-terminated end has (0001) active facet in which the surface defects can enhance adsorption capability of oxygen and hydroxyl ions, resulting in increased photocatalytic efficiency. The charge separation efficiency is higher in ZnO nanorod as compared to other morphology due to its high aspect ratio. The existence of unsaturated Zinc ion in the (1010) facets is responsible for the observed high photocatalytic activity [152].
The photocatalytic CO2 reduction activity
is not only associated with the exposed facets, but also closely related to the CO2 adsorption
capability on the surface of the photocatalyst [153]. The photocatalyst with large surface area can provide more active sites and reaction centers for the photoreduction of CO2, thus exhibiting a higher
photocatalytic activity. The surface area of one dimensional ZnO nanorod is about two times larger than that of two dimensional ZnO micro flowers, which is beneficial for the photocatalytic reaction. Therefore, it is not surprising that ZnO nanorod has better photoreduction activity than other morphology. It was demonstrated that the ZnO nanorods had superior CO2 photoreduction
performance as compared to other morphology, ascribed to the synergistic effect of their large ratio of exposed (0001) facets and large surface area [153].
ZnO growth in general alkaline solutions
stabilization energy. Zn2+ though depends on the specified temperature and pH [155], have ability to exist in a sequence of intermediates, and therefore, the dehydration of intermediates can form ZnO. In aqueous media, chemical reactions are generally thought to exist in a reversible equilibrium, with the minimization of the free energy of the entire reaction system considered to be the driving force [156]. The grown of ZnO Wurtzite structure occurs along the c-axis, the energy polar surfaces such as ± (0001) (Fig 6A) which exist as O2–terminated or Zn2+is relatively high. Atomic arrangements along the low-index planes in hexagonal prism (Fig. 6(B)) of ZnO,
1010 and
1120 , are stoichiometric with equal numbers of exposed Zn2+ or O2- ions. Whereas the basal planes, (0001) and
0001, andthe pyramidal planes
1011, are strongly polar and consist of sheets of Zn2+ or O2 [157]. The polar zinc-terminated surface is usually designated as (0001) and the polar oxygen-terminated surface as
000 , these polar planes have high surface1 energy. Therefore, on forming the ZnO nucleus, the arriving precursor molecules minimize the surface energy due to its propensity to preferably adsorb on the surface that is polar. Having adsorbed the monolayer of precursor molecules, then the original polar surface would transform unto other polar surface with inverted polarity a O2–-terminated surface would then change to a Zn2+-terminated surface, or reverse is true. The method would then be repeated, resulting to rapid growth along the ± [0001] directions, exposing the non-polar {2110} and {1100} surfaces to the solution. This then explained 1D nanostructure fashion in solutions.Figure 6(a). Hexagonal wurtzite crystal structure of ZnO, (b)
Hexagonal prism of ZnO crystal showing different crystallographic faces [158]
An alkaline solution is necessary for the growth of ZnO nanostructures because normally divalent metal ions do not hydrolyze in acidic media [159-160] and can also be derived in a number of ways: The frequently explored alkali compounds are NaOH and KOH. In general, the ZnO solubility in an alkali solution has been reported to increase with the concentration of alkali and temperature which under a necessary condition of supersaturation, the attainment of growth zone is possible [156]. Due to a larger ion radius of K+, KOH is considered to be favorable to NaOH, and thus a lower probability to incorporate into the ZnO lattice [160-163]. However, it has been revealed that OH-was attracted to Na+around the nanocrystal thus forming a virtual layer, which inhibits the development of nanocrystal [164].
Zn2+ 2OH
-→ Zn(OH)
2 (1)
Zn(OH)2+ 2OH
-→ [Zn(OH) 4]
2-(2)
[Zn(OH)4]
2-→ ZnO 2
2-+ 2H2O (3)
ZnO2
2-+ H2O→ ZnO + 2OH
-(4)
ZnO + OH-→ ZnOOH- (5)
As shown in the Eqns 1-5, the major reactions involved in the synthesis are illustrated [165-166]. According to eqn 2, Zn(OH)4
2–
is not necessarily the product, can also exist as Zn(OH)2
or Zn(OH)+, this thus depend on the operational parameters which include the pH value and concentration of Zn2+ as exposed in Fig. 7(a). These entire intermediate products were in equilibrium, and the products dominated differed under different reaction conditions. To understand this growth reaction, initially, the OH- and Zn2+ ions coordinated with each other, underwent dehydration via proton transfer, formed Zn2+···O2– ···Zn2+ bonds, and this led to an agglomeration in the form of [Znx(OH)y](2x–y)+, that demonstrated an
octahedral geometry [60]. At the beginning, these aggregates typically contained below 50 ions, and the creation of O2– ions imply an impressive change in the aggregate. This results migration of water (H2O) molecules produced by dehydration
150), the domains of wurtzite types ZnO are then nucleated in the central region of the aggregates (given away in Fig. 7(b)). The Zn2+ and O2– ions only are the core, while the aggregate surface still principally comprises of OH-, Zn2+ions. Due to the aggregates above 200 ions exhibit by a core of nanometer sized wurtzite structure that actually grown because of additional association of OH-and Zn2+ions [162]. According to eqns (1-5), the O2–in ZnO did not emerge from the solvent H2O but
from the alkali. This implies that H2O is not
necessarily requiring the solvent for the growth of ZnO [167-170]. The solvents could be organic, (e.g. butanol, methanol, ethanol) [167-169], or ionic liquids [171-172]. Under alkaline conditions, by adjusting the ratio of OH-and Zn2+the reactions can happen at room temperature, resulting ZnO nanowires even below 10 nm size. ZnO nanowires arrays with a range of aspect ratios may simply be prepared by just adjusting reaction time and OH -concentration [168]. Several other reported works were reviewed on growth over ZnO semiconductor for enhancing photocatalytic performances [173-179].
Figure 7(a).Phase stability diagrams for the ZnO(s)–H2O system
at 25 °C as a function of precursor concentration and pH, the dashed lines indicate the thermodynamic equilibrium between the Zn2+ soluble species and the resultant solid phases [161]. (b)
Aggregation of domains of the wurtzite structured ZnO, where the characteristic rings in the aggregate center are highlighted in blue. The two staggered six-rings form a center of stability and give rise to further ordering in favor of the wurtzite structure [162]
Moreover, polar inorganic nanocrystal growth is sensitive to solvents reaction, tuning and controlling their morphologies by the crystal– solvent facial interactions [167] is necessary since ZnO morphology is mainly directed by the saturated vapor pressure and polarity of the
solvents [170]. As reflected in Fig. 8(a-c), the ZnO nanowires ratio is dictated by the relative growth rates of non-polar and polar surfaces and this can be changed by simply vary the polarity of the solvents. Polar solvent have been demonstrated to have strong interactions with the ZnO polar surfaces, and thereby obstructing adsorption of the precursor molecule. While going from the more polar solvent methanol to the less polar solvent 1-butanol; the aspect ratio of the ZnO semiconductors increases. The as-grown ZnO nanowires revealed two well-faceted basal planes along the ±c axis (Fig. 8d) [169]. Whenever the non-polar hexane solvent is used, very thin ZnO nanowires with 2 nm diameters would be prepared from precursor of a simple acetate (Fig. 9a) [174]. These thin nanowires are self-assembled to uniform nanowires aligned parallel to each other [170] which possibly grown by oriented coalescence of quantum dots (Fig. 9b). It was reported by Pacholski et al. [175-176] that performing an oriented attachment of quasi-spherical ZnO nanostructures would be a main reaction mechanism during the single crystalline nanowires synthesis [175-176]. The necks between the attached nanostuctures were later on filled and the Ostwald ripening was further employed to smoothen the nanowire surfaces [175].
Figure 9(a).TEM image of self-assembled ZnO nanowires with diameters of about 2 nm (inset is a higher resolution image showing the oriented stacking; nanowires are dark contrast.) [174]. (b) TEM image of the very thin nanowire grown by orientational aggregation of several quantum dots [175]
The derived alkaline solution could also be obtained from other amine compounds, and weak bases (e. g. NH3·H2O) [177]. For instance, the
kinetics of ZnO nanowires growth in NH3·H2O has
been well studied [178]. Besides providing a basic environment, NH3·H2O has been demonstrated to
mediate heterogeneous nucleation of ZnO nanowires [178–181]. Various researchers have demonstrated that depletion of Zn2+ ions the synthesis of the ZnO nanowires can be overcome [180-187].
ZnO defect chemistry
The associated charge carriers and control of defects is of paramount significance in applications that develop the wide range of properties of doped ZnO. Although, there are numerous works on ZnO, yet the link between defect chemistry, properties and processing, have not been given detail attention. ZnO has a simple chemical formula but possesses high defect chemistry [188]. Huge reports on defect have been reported in the past 40 years in relation to ZnO properties and applications in ZnO varistors: defects significantly change grain boundary properties and also I-V characteristics, yet, there is vital need to revisit it in the context/framework of novel application with the use of nanostructure materials [189-190]. Prior to consideration of ZnO defect structure, it is essential to understand that ZnO has open structure, with a hexagonal close packed lattice. Having all octahedral sites empty.
That is why; there are abundance of sites for ZnO to accommodate intrinsic defects and extrinsic dopants. The electronic energy levels of native imperfections in ZnO are illustrated in Fig. 10 with lot of intrinsic defects with different ionization energies [191-194].
Figure 10. Energy levels of native defects in ZnO. The donor defects , : , : , : , , and the acceptor defects
are: , [188], (where Zn = zinc, i = interstitial site, O =
oxygen, and V = vacancy; : , : , : , : , , are
donor defects while , are acceptor defects respectively)
On the other hand partial pressure of zinc, oxygen, pO2 and pZn are also very important. So,
oxygen vacancies may be predominate under high temperatures and very reducing conditions. Under Zn vapor rich environments Zn interstitials are the major defects. Even at very low temperatures like 500 °C; Zn evaporates readily, in a Zn-poor environment [193]. Annealing is required, in order to keep a Zn interstitial concentration [194]. Solubility from saturated Zn vapor is calculated to be n = 3.4 x10²⁰exp (-0.65e/kT) atoms/cm3[193]. In order to measure the defects in different pZn and pO2 regimes, Brouwer diagrams that plot log
[defect or carrier concentration] versus log pO2or
log pZn are used. For ZnO, the Brouwer diagram is given in (Fig. 11) [194]. It shows that in the low pO2 regime charged oxygen vacancies dominate.
Still, some scientists report that in the low pO2
regime Zn interstitials dominate [195]. This difference is likely to be a result of the influence of pZn, (at low pO2and high pZn). It is probable that
Zn interstitials dominate, whereas at low pO2 and
low pZn and it is probable that oxygen vacancies dominate. There is wide agreement that at higher pO2there is a switch to Zn vacancy domination. In
domination at low pZn to Zn interstitials at higher pZn [192]. Thus, the transition occurs at around pZn ~10-10atm, at 1000 °C [192]. The power dependencies of the slopes in Fig. 11 (-1/6 and ±1/2) arise from the relevant defect equilibria [196]. Across the Brouwer diagram carrier concentrations can vary by several orders of magnitude [197]. Impurities and intentional doping with differently charged ions have high effects on the defect equilibria and this is very essential to consider when nanostructure is synthesized in the existence of other atomic species. Depending on whether the ion has a lower valence (e.g. Li1+ introduces holes) or higher valence (e.g. Al3+ introduces electrons) than the Zn by keeping that in mind carriers are introduced. On the carrier concentration from such substitutions there is no pO2 or pZn dependence, but very small atomic
concentrations (>1016 cm-3) can outweigh the intrinsic defects in the middle pO2 or pZn regions,
leading to a plateau in carrier concentration over several decades of partial pressure.
Figure 11.Schematic Brouwer diagram showing a transition from intrinsic defect control by (range I) to extrinsic defect control
from an unknown charged donor impurity (e.g. an ion of 3+ valence) (range II). [ ] on the left-hand axis indicates concentration of defects. The far right-hand region (unlabeled) corresponds to control [194-197]
In summary, Tam et. al. [198] reported that large defect concentrations in as-grown ZnO nanorods could be considerably enhanced by annealing (Fig.12) by 200 °C because of its ability to demonstrate a significant enhancement in UV to visible emission ratio, but positron annihilation
measurements indicate that a significant quantity of defects are still there in the material. Photoluminescence spectra exhibition were not satisfactory results of sample defect density and quality. Sample emission intensity and defect shape are majorly reliant on the annealing temperature, and they have intricate connection between results obtained from distinct measurements. ZnO nanorods grown by hydrothermal approach shows green emission is due to the presence of surface defects and yellow emission originates from the hydroxyl groups. Due to the defect complexes show both red and green emission (involve VZn), while red emission is
responsible for chemical character of defects and requires further study.
Influence of termination planes on the photocatalytic performance of ZnO
The diversity of ZnO morphologies i.e. nanowires, nanorods, core/shell, nanoflowers and nanobelts etc. are reported in literature [199-212]. The role of morphology beside balancing the light absorption depth and controlling the charge carrier diffusion length is of utmost important as it varies the type and amount of exposed crystal facets. The greater proportion of exposed facets will directly influence the photocatalytic performance. The negatively charged CO2 reduction intermediates will
more preferably bound to the terminal sites that are slightly positively charged and thus will increase the activity and selectivity of CO2reduction reaction. It has been reported that
ZnO with exposed site [0001] has terminal Zn atom that is slightly positively charged and hence has higher photocatalytic activity for water splitting [199]. As such, it was postulated that preferential crystal growth leading to a high degree of exposure of the [0001] facets would enhance its catalytic activity. It was found that ZnO nanostructures with a higher exposure of [0001] facet exhibited stronger absorption in 400–450 nm range [199].
Particularly, for ZnO nanorods crystals a lot of efforts have been invested to change the ratio of oxygen or zinc terminated polar faces to non-polar crystal facets. In general it is claimed that higher polar to non-polar facet ratio plays significant role in photocatalytic performance [200-202]. Clearly, the knowledge of facet determined photocatalytic efficiency is mostly based on indirect evidences gleaned from ensembled average experiments. However, the photocatalytic performance is not solely dependent upon the facet abundance but also on crystal size and nature and affluence of crystal defects. Debroye et al., [203] correlated silver photo-depositions to specific structural features of the ZnO photocatalyst and revealed that ~50% of the silver nanoparticles are deposited at the outlines of structural imperfections at the nonpolar facets, 45% at the edges of the O-terminated polar facets, and the remaining 5% are distributed randomly at
what appear to be defect-free locations. The latter is concluded based on the available structural resolution offered by the recorded scanning electron micrographs. This observation is remarkable because literature mostly suggests that the polar (0001) or (0001̅) crystal facets are the most photo-catalytically active [204-208].
double salt (Zn-HDS) as an intermediate (Fig. 13d).
By carrying out FESEM, high-resolution transmission electron microscopy/ selected- area electron diffraction (HRTEM/SAED), and X-ray diffraction (XRD) analyses on the reaction intermediates [210], it was determined that a fraction of the outer most surface of the Zn-HDS intermediate was transformed into hexagonal ZnO crystallites under hydrothermal conditions at 95°C (the fraction depended on the pH variation of the nutrient solution), after which the surface-formed ZnO crystallites acted as nucleation centers for dumb bell-shaped ZnO microrods (hereafter referred to as DB microrods). Since the in tercalate dacetateanions in the Zn-HDS lattice were stabilized between the Zn (0001) planes through the formation of DB microrods, the Zn (0001) faces were completely masked. In fact, the FESEM image of (Fig. 14 d) revealed that the DB microrods were formed by co-sharing the acetate ligands, giving rise to the hybridization of two individual microrodcrystals. One thing to note here is that both hexagonal microrods and DB microrods turn out to have a broader size distribution than the nanorods and nanoplates [210].
Figure 13. Schematic illustration of the growth models for a) nanorods, b) nanoplates, c) microrods, and d) dumbell-shaped (DB) microrods of zinc oxide [210]
Figure 14. FESEM images of a) nanorods, b) nanoplates, c) microrods, and d) DB microrods of zinc oxide [210]
Influence of some parameter on the photoreduction of CO2over ZnO
The current advances in the photoreduction of CO2over semiconductor
hetero-structures are reviewed in terms of charge transfer, spatial charge separation, photo-stability and visible-light activity. The first factor is the influence of visible-light activity, it should be noted here that many semiconductors wide-band gap only absorb UV light, therefore the valuable approach to improve efficiency of photo-reduction is to utilize a semiconductor with narrow-band gap to sensitize the semiconductor with wide-band gap. Numerous examples of binary sulfides [213-218], tellurides [219], selenides [218], etc have been employed couple with the semiconductors with wide-band gaps for CO2 photoreduction. Another
factor is the photo stability. In this case, the semiconductors with narrow-band gap must demonstrate an efficiency that is higher than the ones with wide-band gap as they are liable to visible light absorption. However, one major limitation here is that in practical applications, they suffer from photo-corrosion, so effort must be made to prevent this by using stable material like p-type GaP,to protect it.
Charge separation and transfer is also one of the determinant factors in photocatalytic conversion of CO2 because semiconductor
recombination thus leading to a prolonged lifetime and an improved photocatalytic activity. Many system have been designed such as p–n junction, non-p–n type II heterostructure, Z-scheme and co-catalyst,. Lastly, the hetero-phase junction, solid-state solution and hetero-facet junction must not be ignored. For more and detail understanding of these factors, readers are encouraged to go through the previous work reported [103].
Moreover, it is difficult to compare the activities of different photocatalysts reported by different groups by only considering the conversion rate or quantum efficiency due to the differences among preparation methods and in particular test conditions. However, it is agreed generally that more than a few aspects needed to be considered to advance the photocatalytic performance of semiconductors. The particle size of photocatalysts has profound consequence on the efficiency of CO2 photoreduction [19]. Decreasing
particle size can often results in the larger surface area of the photocatalysts, which serves as more active reaction sites for CO2 adsorption. The
photocatalysts with smaller particle size also benefit from the shorter transfer pathway for charge carriers to reach its surface. However, the smaller the particle size is, the more the particles’ boundary, which may influence the communication between these particles and thus leads to a lower activity [19].
Furthermore, loading co-catalysts on the surface of photocatalysts is another commonly used procedure to achieve substantial enhancement on both conversion efficiency and products’selectivity. It is generally known that the photoreduction reaction can be improved by loading noble metal nanoparticles. On the other hand, metal oxide nanoparticles are found to favor the oxidation reaction. The choice of co-catalyst is crucial. Some noble metals are particular active toward water reduction while some are more suitable for CO2 reduction. This is due to the
co-catalysts providing active catalytic sites for reduction of different absorbed species [19]. The co-catalysts also extract the photogenerated electrons or holes to prolong the lifetime of the charge carriers. Although metal oxide does not provide reduction catalytic reaction side, loading it
on photocatalyst may still increase the reduction products’yield, since it will extract hole and extend the lifetime of electrons for reduction reaction. In addition, electron accumulation on co-catalyst allows the discharge of more than one electron at a time, facilitating the multi-electron CO2 reduction
processes. The choice of the co-catalysts varies from different photocatalysts for reaching their best photoactivity. Thus far, the co-catalyst application strategy for CO2 reduction is mainly
focused on CO2 reduction co-catalysts. However,
there are other strategies used in photocatalytic or photoelectron catalytic (PEC) water splitting system, such as (1) oxidation co-catalysts for hole removal from photocatalyst and (2) binary co-catalysts system for both reduction and oxidation reactions [19].
Current challenges and future prospect
The main cause of global warming is the CO2 emissions –– the rate at which this is
increasing recently posed a serious concerned globally; the recorded increase in 2011 was 3%. China’s contribute to increase by 9% to 7.2 tonnes CO2average per capita CO2emissions, In 2011. By
considering the uncertainty margin (10%) which is similar to the European Union of 7.5 tonnes per capita emissions in 2011. China is now well within the 6 to 19 tonnes/person range spanned by the major industrialized countries.
The impacts of climate change are already being observed in big as well as small cities, from severe droughts and floods to storms damaging infrastructure, worsening smog, intensified heat waves etc. Due to rate at which urbanization is increasing all over the globe, along with fast and high production of energy- and carbon-intensive building materials to build urban infrastructure [220-222]. Nearly 80 million Chinese, 20 million in the U.S and 30 million in India city dwellers live in coastal zones at risk for sea-level rise [223-225].
According to one report in 2014, China’s urban population, 742 millionis contributing 10% of total world population [226]. In 2007 the countries name list with largest emitter of energy-related CO2, China was on the top the list
rapid urbanization along with the huge energy consumption and great emissions of CO2. In 2010,
Urban residents in China on average were known for causing CO2 energy-related emissions of
approximately 7 tons CO2 emissions per capita
tCO2/capita [229]. Wuhan, rising city increases
from 9.7 tCO2/capita to 15.2 tCO2/capita between
2005 and 2011, while emissions in Shanghai remained stable as compared to other cities, grown slightly from 12.4 tCO2/capita to 13.1 tCO2/capita
between 2005 and 2011 [230]. In 2013, emissions London were 5.7 tCO2/capita and 8.3 tCO2/capita
in Los Angeles [231].
China is a heavy CO2 emitter to the
atmosphere, to about 2/3 from point sources. The most straight forward way of reducing CO2
emission consists in replacing coal fired electricity generation by renewable energy, in particular solar (China has one of the highest solar irradiances, on par with US) and wind. Besides this, recycling CO2
using renewable energy sources offers an ideal way of reducing its climatic consequences. Liquid fuels from recycled CO2 allow for a sustainable
way of maintaining the mobility of our society, and they are easy to transport over large distances using existing infrastructure, i.e. pipelines, trucks and ships [232]. It can also be admixed in high fractions to gasoline and used in combustion engines. Alternatively, hydrogen can be produced on-board of automobiles via photo-reforming of methanol for use in hydrogen fuel cells [233-234], or it can be converted in a straight forward way to dimethylether or to gasoline under doubling of its energy density. Large efforts worldwide indicate the urgent nature of this substantial challenge, as evidenced by the large number of recent reviews [232-241]. These efforts included also detailed quantum-chemical calculations for both, thermal heterogeneous and photo catalysis [242-243]. Nevertheless, the subject is still awaiting a real breakthrough, in particular as regards selectivity to the desired liquid fuel product and its yield. Various products are formed, from H2, CO, CH4,
formate and in smaller amounts methanol, ethane and other hydrocarbons, depending on the choice of the photocatalysts [232]. Therefore, research should be extended to the identification these steps by advanced spectroscopy. In addition, in practical systems, the free energy is influenced by various
additional parameters, i.e. the environment (electrolyte/membrane material, potential, pressure, temperature, concentration of species, contaminations). These parameters can be influenced by the design and operation of the reactor, e.g. membrane reactors, micro-channel reactors, etc. The measurement, modeling and assessment of the effect of these parameters are to be focused through a detailed mechanistic understanding of the catalytic reduction of CO2
into liquid fuels.
Monitoring of spectroscopic techniques using photoluminescence, EXAFS, FTIR, ESR, XANES, diffuse reflectance UV–visible, and NMR, and GC–MS to monitor isotope, electron microscopy to verify events of photocatalytic and the carbon source used for producing the fuels. The mechanism of reaction behind photo catalysis is still far from understanding especially methane formation from CO2+ H2O when ZnO is used need
to explain more clearly. Though, there are progresses on the theoretical approach which based on the band energy and the redox potential comparison but this not enough to explain the product selectivity especially when ZnO is being employed. Moreso, efficiency for the CO2
conversion are highly expected to be further improved by combining different photocatalysts and the utilization of novel reaction systems e.g. sacrificial electron donors need to be recycled and CO2photoconversion to fuels should utilize anode
oxidation and cathode reduction compartments. In particular, the combination of water photo-splitting to produce H2 (or protons and electrons) and
photoreduction of CO2with the produced H2have
the potential of boosting the CO2 conversion
efficiency.
In addition, despite an encouraging progress achieved toward conversion of CO2using
through photo catalytic membranes, in which water vapor and CO2 can enter one side of the nanorod
array membrane with a fuel exiting from the other.
Conclusion
The conversion of CO2 into value added
products is still a challenging task that demands a keen attention of researchers. To simulate the further research on unresolved issues that deserve experimental attention, it is particularly interesting to study the mechanistic aspects of photocatalytic CO2 reduction using hydrothermal method for
energy storage over ZnO semiconductor with well-defined structure and stability. It is observed that all these existing methods and techniques involve some chemicals that are environment unfriendly and hazardous. However, there are no reports available that effectively explain the redox mechanism of CO2 reduction reaction on
ZnO-based photocatalysts. Here we presented that the visible photocatalytic activity, electron-hole separation, photostability, electrode-electrolyte charge transfer and morphological influence in photocatalytic CO2 reduction system. This article
enables the investigations of system design, the choice of catalyst and morphology to facilitate the CO2reduction and also simulate further research in
the field of photocatalysis. We also established clearly here that ZnO semiconductors have a higher population of polar Zn (0001) faces with ability to enhance the photocatalytic activity of CO2 conversion via hydrothermal method.
Moreover, the tuning of the face orientation have ability produce an optimised photocatalytic conversion of CO2 to liquid fuels using ZnO
semiconductor by hydrothermal method. Successful morphology tuning is also of great important in obtaining high polar to non-polar facets ratios so as to increase the percentage of reactive sites. Controlling the shape, size, and preferred ZnO semiconductors orientation to tailor their chemical and physical properties for optimal reactivity and selectivity are very essential.
Acknowledgements
Authors acknowledge the support obtained from The World Academy of Science (TWAS) in form of Research grants; Research Grant number: 11-249 RG/CHE/AF/AC_1_UNESCO FR:
3240262674 (2012), 15-181 RG/CHE/AF/AC_1_: 3240287083 (2015), 2016 TETFund Institution Based Research Intervention and NRF-TWAS for Doctoral Fellowship programme awarded to the first author (UID:105453 & Reference: SFH160618172220) respectively. All figures cited in this review are reproduced with permission from respective publishers.
References
1. C. M. White, B. R. Strazisar, E. J. Granite, J. S. Hoffman and H. W. Pennline, J. Air Waste Manage. Assoc.53 (2003) 645. https://doi.org/10.1080/10473289.2003.1046 620
2. OECD Environmental Outlook to 2050: The Consequences of Inaction, OECD, (2012) 22.
http://dx.doi.org/10.1787/9789264122246-en 3. Y. Izumi, Coord. Chem. Rev., 257 (2013)
171.
https://doi.org/10.1016/j.ccr.2012.04.018 4. N. Ahmed, Y. Shibata, T. Taniguchi and Y.
Izum,J. Catal. 279 (2011) 123.
https://doi.org/10.1016/j.jcat.2011.01.004 5. I. A. Shkrob, T. W. Marin, H. He and P.
Zapol, J. Phys. Chem., (2012) 116, 9450 https://doi.org/10.1021/jp300122v
6. BP Energy Outlook 2030, BP, London, (2013) 21.
https://www.bp.com/content/dam/bp/en/corp
orate/pdf/energy-economics/energy-outlook/bp-energy-outlook-2013.pdf
7. M. Tahir and N. S. Amin, Renew. Sust. Energ. Rev.,25 (2013) 560.
https://doi.org/10.1016/j.rser.2013.05.027 8. B. Godfrey, Renewable Energy Power for a
Sustainable Future. Oxford, UK: Oxford University Press, (2004).
ISBN0199545332, 9780199545339
9. Intergovernmental Panel on Climate Change. (2001).
http://streitcouncil.org/uploads/PDF/Report-
Climate%20Change%202007-%20Impacts,%20Adaptation,%20and%20Vu lnerability.pdf
11. Y. S. Choi, J. W. Kang, D. K. Hwang, S. J. Park, IEEE Trans. Electron Devices, 57 (2010) 26.
https://doi.org/10.1109/TED.2009.2033769 12. M. Mikkelsen, M. Jorgensen and F. C. Krebs
Energy Environ Sci.,3 (2010) 43. https://doi.org/10.1039/B912904A
13. A. C. Yeh and H. Bai, Sci. Total Environ., 228 (1999) 121.
https://doi.org/10.1016/S0048-9697(99)00025-X
14. L. Klaus,Science, 300 (2003) 1677. https://doi.org/10.1126/science.1079033 15. S. Bachu, Energy Convers. Manage., 41
(2000) 953.
https://doi.org/10.1016/S0196-8904(99)00149-1
16. Y. He, Y. Wang, L. Zhang, B. Teng and M. Fan,Appl. Catal. B. Environ., 168 (2015) 1. https://doi.org/10.1016/j.apcatb.2014.12.017 17. R. K. Richter, T. Ming and S. Caillol,Renew
Sust. Energ. Rev., 19 (2013) 82.
https://doi.org/10.1016/j.rser.2012.10.026 18. L. Yuan and Y. J. Xu, Appl. Surf. Sci., 342
(2015) 154.
https://doi.org/10.1016/j.apsusc.2015.03.050 19. X. Li, J. Q. Wen, J. X. Low, Y. P. Fang and
J. G. Yu, Sci. Chin. Mater., 57 (2014) 70. https://doi.org/10.1007/s40843-014-0003-1 20. Y. Li, W. N. Wang, Z. Zhan, M. H. Woo, C.
Y. Wu and P. Biswas, Appl. Catal. B Environ., 100 (2010) 386.
https://doi.org/10.1016/j.apcatb.2010.08.015 21. M. Kitano, M. Matsuoka, M., Ueshima and
M. Anpo,Appl. Catal.A-Gen., 325 (2007)1. https://doi.org/10.1016/j.apcata.2007.03.013 22. A. Wei, L. Pan and W. Huang, Mater. Sci.
Eng.,176 (2011) 1409.
https://doi.org/10.1016/j.mseb.2011.09.005 23. Y. C. Zhu, T. Mei, Y. Wang and Y. T. Qian,
J. Mater. Chem., 21 (2011) 11457. https://doi.org/10.1039/c1jm11079a
24. W. Xiao, D. L. Wang and X. W. Lou, J. Phys. Chem.,114 (2010) 1694.
https://doi.org/10.1021/jp909386d
25. X. Y. Li, Z. J. Si, Y. Q. Lei, X. N. Li, J. K. Tang, S. Y. Song and H. J. Zhang, Cryst. Eng. Comm.,13 (2011) 642.
https://doi.org/10.1039/C0CE00217H
26. H. Dong, X. J. Li, Q. Peng, X. Wang, J. P. Chen and Y. D. Li,Angew. Chem., Int. Ed.,
44 (2005) 2782.
https://doi.org/10.1002/anie.200462551 27. Y. Li, M. H. Cao and L. J. Feng,Langmuir,
25 (2009) 1705.
https://doi.org/10.1021/la803682d
28. J. H. Shin, J. Y. Song and H. M. Park,
Mater. Lett., 63 (2009) 145.
https://doi.org/10.1016/j.matlet.2008.09.047 29. Z. Zhang, H. Yu, Y. Wang and M.Y. Han,
Nanotechnol., 17 (2006) 2994.
https://doi.org/10.1088/0957-4484/17/12/029 30. P. X. Gao, C. S. Lao, Y. Ding and Z. L. Wang, Adv. Funct. Mater., 16 (2006) 53. https://doi.org/10.1002/adfm.200500301 31.S. Chen, Y. Liu, C. Shao, R. Mu, Y. Lu, J.
Zhang, D. Shen and X. Fan, Adv. Mater., 17 (2005) 586.
https://doi.org/10.1002/adma.200401263 32. Q. Li, V. Kumar, Y. Li, H. Zhang, T. J.
Marks and R. P. H. Chang,Chem. Mater., 17 (2005) 1001.
https://doi.org/10.1021/cm048144q
33. J. J. Cole, X. Wang, R. J. Knuesel and H. O. Jacobs,Adv. Mater., 20 (2008) 1474.
https://doi.org/10.1002/adma.200703102 34. T. Gao and T. H. Wang, Appl. Phys. A:
Mater. Sci. Process,80 (2005) 7. doi: 10.1007/s00339-004-3075-2
35. X. Wang, C. J. Summers and Z. L. Wang,
Nano Lett.,4 (2004) 423.
https://doi.org/10.1021/nl035102c
36. H. Hu, K. Yu, J. Zhu and Z. Zhu,Appl. Surf. Sci.,252 (2006) 8410.
https://doi.org/10.1016/j.apsusc.2005.11.060 37. J. B. Baxter, A. M. Walker, K. V. Ommering
and E. Saydil, Nanotechnol., 17 (2006) S304.
https://doi.org/10.1088/0957-4484/17/11/S13
38. T. Y. Liu, H. C. Liao, C. C. Lin, S. H. Hu and S. Y. Chen,Langmuir, 22 (2006) 5804. https://doi.org/10.1021/la052363o
39. K. Kitamura, T. Yatsui, M. Ohtsu and G. C. Yi,Nanotechnol.,19 (2008) 175305.
https://doi.org/10.1088/0957-4484/19/17/175305
Glikman, H. Wulff and M. Quaas, Surf. Coat. Technol., 201 (2006) 2844.
https://doi.org/10.1016/j.surfcoat.2006.05.032 41. Y. W. Sun and Y. Y. Tsui,Opti. Mater., 29
(2006) 1111.
https://doi.org/10.1016/j.optmat.2006.05.011 42. H. Tang, L. Zhu, Z. Ye, H. He, Y. Zhang, M.
Zhi, F. Yang, Z. Yang and B. Zhao,Mater. Lett.,61 (2007) 1170.
https://doi.org/10.1016/j.matlet.2006.06.085 43. Y. H. Hwang, S-J. Seo and B-S. Bae, J.
Mater. Res.,25 (2010) 695.
https://doi.org/10.1557/JMR.2010.0103 44. T. Ghoshal, S. Biswas, S. Kar, A. Dev, S.
Chakrabarti and S. Chaudhuri,Nanotechnol.,
19 (2008) 065606.
https://doi.org/10.1088/0957-4484/19/6/065606
45. Y. Tak, K. Yong and C. Park, J. Cryst. Growth, 285 (2005) 549.
https://doi.org/10.1016/j.jcrysgro.2005.09.052 46. P. Viswanathamurthi, N. Bhattarai, H. Y. Kim and D. R. Lee,Nanotechnol.,15 (2004) 320.
https://doi.org/10.1088/0957-4484/15/3/015 47. U. Ozgur., Y. I. Alivov., C. Liu., A. Teke.,
M. A. Reshchikov., S. Dogan., V. Avrutin., S. J. Cho and H. J. Morkoc,Appl. Phys.,98 (2005) 041301.
https://doi.org/10.1063/1.1992666
48. D. C. Look, Mat. Sci. Eng. B. Adv., 80 (2001) 383.
https://doi.org/10.1016/S0921-5107(00)00604 -8
49. Y. W. Heo, D. P. Norton, L. C. Tien, Y. Kwon, B. S. Kang, F. Ren, S. J. Pearton and J. R. LaRoche,Mat. Sci. Eng. R.,47 (2004)1. https://doi.org/10.1016/j.mser.2004.09.001 50. G. C. Yi., C. R. Wang and W. I. Park,
Semicond. Sci. Technol., 20 (2005) S22. https://doi.org/10.1088/0268-1242/20/4/003 51. Z. L. Wang, J. Nanosci. Nanotechnol., 8
(2008) 27.
https://doi.org/10.1166/jnn.2008.N08
52. N. Kamarulzaman, M. F. Kasim and R. Rusdi, Nanoscale Res. Lett., 10 (2015) 346. https://doi.org/10.1186/s11671-015-1034-9 53. S. J. Pearton, D. P. Norton., K. Ip., Y. W.
Heo and T. Steiner, Prog. Mater. Sci., 50 (2005) 293.
https://doi.org/10.1016/j.pmatsci.2004.04.001 54. C. Klingshirn, Phys. Status Solidi B, 244
(2007) 3027.
https://doi.org/10.1002/pssb.200743072 55. L. Schmidt-Mende and J. L. MacManus,
Driscoll, Mater. Today,40 (2007) 10. https://doi.org/10.1016/S1369-7021(07)70078-0
56. D. G. Nocera, Acc. Chem. Res., 45 (2012) 767 .
https://doi.org/10.1021/ar2003013
57. A. L. Linsebigler, G. Q. Lu and J. T. Yates,
Chem. Rev.,95 (1995) 735.
https://doi.org/10.1021/cr00035a013
58. A. J. Morris, G. J. Meyer and E. Fujita,Acc. Chem. Res., 42 (2009) 1983.
https://doi.org/10.1021/ar9001679
59. K. Tanaka and D. Ooyama, Coord. Chem. Rev.,226 (2002) 211.
https://doi.org/10.1016/S0010-8545(01) 00434-9
60. L. Liu, W. L. Fan, X. Zhao, H. G. Sun, P. Li and L. M. Sun, Langmuir, 28 (2012) 10415. https://doi.org/10.1021/la301679h
61. V. P. Indrakanti, J. D. Kubicki and H. H. Schobert, Energy Environ. Sci., 2 (2009) 745.
https://doi.org/10.1039/b822176f
62. S. Xie, Y. Wang, Q. Zhang, W. Fan, W. Deng and Y. Wang, Chem. Commun., 49 (2013) 2451.
https://doi.org/10.1039/c3cc00107e
63. N. M. Dimitrijevic, B. K. Vijayan, O. G. Poluektov, T. Rajh, K. A. Gray, H. Y. He and P. Zapol,J. Am. Chem. Soc.,133 (2011) 3964.
https://doi.org/10.1021/ja108791u
64. J. Lee, D. C. Sorescu and X. Y. Deng, J. Am. Chem. Soc., 133 (2011) 10066.
https://doi.org/10.1021/ja204077e
65. S. J. Tan, Y. Zhao, J. Zhao, Z. Wang, C. X. Ma, A. D. Zhao, B. Wang, Y. Luo, J. L. Yang and J. G. Hou, Phys. Rev., (2011) 84. https://doi.org/10.1103/PhysRevB.84.155418 66. W. H. Koppenol and J. D. Rush, J. Phys.
Chem., 91 (1987) 4429.
https://doi.org/10.1021/j100300a045
![Figure 4. Schematic diagram of photo excitation and electrontransfer process [79]](https://thumb-us.123doks.com/thumbv2/123dok_us/8403749.1688071/4.595.72.290.175.282/figure-schematic-diagram-photo-excitation-electrontransfer-process.webp)

![Figure 5. Top-view SEM images of the ZnO nanowire arrays (Aand B) and Ag nanoparticle tip-grafted ZnO nanowire arrays (Cand D); the insets show the cross-sectional images of ZnOnanowire arrays (A) and Ag nanoparticle tip-grafted ZnOnanowire arrays (C), respectively [149]](https://thumb-us.123doks.com/thumbv2/123dok_us/8403749.1688071/9.595.71.289.181.318/nanowire-nanoparticle-nanowire-sectional-znonanowire-nanoparticle-znonanowire-respectively.webp)
![Figure 6(a). Hexagonal wurtzite crystal structure of ZnO, (b)HexagonalprismofZnOcrystalshowingdifferentcrystallographic faces [158]](https://thumb-us.123doks.com/thumbv2/123dok_us/8403749.1688071/10.595.74.277.579.701/figure-hexagonal-wurtzite-crystal-structure-zno-hexagonalprismofznocrystalshowingdifferentcrystallographic-faces.webp)
![Figure 7(a). Phase stability diagrams for the ZnO(s)–H2O systemat 25 °C as a function of precursor concentration and pH, thedashed lines indicate the thermodynamic equilibrium between theZn2+ soluble species and the resultant solid phases [161]](https://thumb-us.123doks.com/thumbv2/123dok_us/8403749.1688071/11.595.306.522.467.655/stability-function-precursor-concentration-thedashed-thermodynamic-equilibrium-resultant.webp)
![Figure 9(a). TEM image of self-assembled ZnO nanowires withdiameters of about 2 nm (inset is a higher resolution imageshowing the oriented stacking; nanowires are dark contrast.)[174]](https://thumb-us.123doks.com/thumbv2/123dok_us/8403749.1688071/12.595.73.290.109.264/assembled-nanowires-withdiameters-resolution-imageshowing-stacking-nanowires-contrast.webp)
![Figure 12. Temperature dependence of the UV and defectemission for ZnO nanorods (a and b) no annealing, (c and d)annealed in air, and (e and f) annealed in forming gas [198]](https://thumb-us.123doks.com/thumbv2/123dok_us/8403749.1688071/13.595.305.520.318.692/figure-temperature-dependence-defectemission-nanorods-annealing-annealed-annealed.webp)
![Figure 14. FESEM images of a) nanorods, b) nanoplates, c)microrods, and d) DB microrods of zinc oxide [210]](https://thumb-us.123doks.com/thumbv2/123dok_us/8403749.1688071/15.595.69.291.478.686/figure-fesem-images-nanorods-nanoplates-microrods-microrods-oxide.webp)
