Extraction of Phenol from Industrial Water Using Different Solvents
Sally N. Jabrou
Department of Radiology, Health and Medical Technical College Foundation of Technical Education, Baghdad, IRAQ
Available online at: www.isca.in
(Received 9th January 2012, revised 18th January 2012, accepted 29th February 2012)
Abstract
The analysis and efficiency of phenol extraction from the industrial water using different solvents, were investigated. To our knowledge, the experimental information available in the literature for liquid-liquid equilibria of ternary mixtures containing the pair phenol-water is limited. Therefore the purpose of the present investigation is to generate the data for the water-phenol with different solvents to aid the correlation of liquid-liquid equilibria, including phase diagrams, distribution coefficients of phenol, lines data and selectivity of the solvents for the aqueous phenol system. The ternary equilibrium diagrams and tie-lines data for systems containing Phenol-Benzene, Phenol-Chloroform, Phenol-iso-Butyl Acetate, Water-Phenol-Butanol, Water-Phenol-Ethyl Methyl Keton and Water-Phenol-Toluene, were determined at 303 K and atmospheric pressure. The capacity and selectivity of these organic solvents in each of these systems were determined from the tie-lines data. The capacity of the isobutyle acetate was found to be the highest among the other solvents, and its selectivity was also the highest. Similar results also were obtained for the ethyl methyl keton but gave less capacity and selectivity as compared to the isobutyle acetate. It can be concluded that both isobutyle acetate and ethyl methyl keton are good solvents for extraction of phenol from industrial water. The liquid-liquid equilibrium data of ternary systems were correlated to the NRTL, UNIQUAC and UNIFAC models of activity coefficient to determine their adjustable parameters. The standard deviations from experimental compositions were calculated. Results show that the correlation may be greatly improved by applying the NRTL model with the regression criteria based on minimizing the experimental and calculating distribution coefficients SK to give an average value of the root mean square deviation about 1.436 % and in terms of the average errors in the distribution ratio for all tie-lines about 10.776%.
Keywords: Liquid-liquid equilibria, extraction of phenol, activity coefficient.
Introduction
Phenol is an example of a highly toxic chemical substance. The maximum amount sanctioned by the World Health Organization in drinking water is 0.001 mg/L., Macedo and Soares (1996). This component is found in large quantities in the effluents of different petrochemical factories and is regularly released into the rivers. Therefore there is great need for elimination phenol from the water, on the other hand, phenol constitutes a valuable component in the production of various chemicals and could be reclaimed from the water to great advantage.
The separation process most widely used in the industry is the extraction with solvents. To design new equipment or to simulate the performance of existing units, it is important to have access to liquid-liquid equilibrium data.
Solvent extraction is a major unit operation based entirely on limited liquid miscibility and the distribution of solute between two liquid phases. In the design of a separation process and indeed whenever solvents are used in chemical technology it is unconditionally necessary to know from data or from calculation, the composition of the two phases in equilibrium.
For many types of mixture containing for example strongly polar molecules, it is necessary to use activity coefficient and hence expression for the excess Gibbs function GE for the calculation of liquid phase fugasities, Hull and Kronberg (2006).
The aim of this research is to obtain the necessary liquid-liquid equilibrium data for the extraction of phenol from water. Phase equilibrium data of the ternary systems water-phenol-organic compounds were generated including phase equilibrium diagrams, distribution coefficients of phenol, tie-lines data and selectivity of the solvent. Tie-lines of two phase conjugate layers were determined by use of cross-section method and the accuracy of experimental tie-line data for the ternary was checked for six different solvents.
The NRTL, UNIQUAC and UNIFAC models were used to correlate the experimental data obtained for the ternary systems under study. The results showed whether the above model is fitted or not to the systems under consideration. A computerized procedure for predicting or representing multicomponent liquid-liquid phase equilibrium was developed by using the combination of optimization theory and thermodynamic.
Acetate, Water-Phenol-Butanol, Water-Phenol-Butanone and Water-Phenol-Toluene.
Material and Methods
Chemicals: The chemicals used was supplied from local markets. The selection of the six solvents is based on the available solvents in the local market which is considered to be controlling factor in this study. In spite of that the solubility parameters of the six selected solvents is within the range of 10.4 – 8.9. These chemicals were presented in table 1 with their purities. Physical properties such as density of these materials used in this study were measured experimentally by measure the refractive index and compared with values in the literature.
Refractive Index Measurement: The refractive index was determined by a refractometer of the specification ABBE, the precision of the refractive indices was 0.0002 units. Refractive indices for the samples of liquid were measured and the values presented were the average values of at least three independent readings for each sample. The samples were thermostated by circulating water from a constant temperature bath through the refractometer. The constant temperature at which the measurements were taken was 30 oC and atmospheric pressure.
Experimental Apparatus: The experimental work was carried out using Erlenmeyer flask with a stopper to prevent evaporation with a capillary inserted into the stopper, whilst maintaining a constant agitation by means of a magnetic stirrer. The flask has jacket through which water from a Haake thermostat bath was circulated. Temperature was measured by means of a precision thermometer, with an accuracy of ± 0.1 oC. The apparatus shown diagrammatically in figure 1.
Figure-1
Cloud point Titrator for liquid-liquid equilibria
Experimental Procedure: The procedure involves operating the apparatus at steady state in order to predict the properties of liquid-liquid equilibria for ternary systems.
Determination of the Binodal Curves: The binodal curves of the ternary systems were determined by the method of titration as described by. The solvent 3 was added to the mixture of water 1 and phenol 2 in the sample bottle inside the constant temperature water-jacket. As soon as the cloud point was reached, phenol 2 was then added to make the liquid homogenous again. The procedure was repeated a number of times, and the successive cloud points were connected up to produce the binodal curve. The maximum error of binodal points determination was ± 0.2 %.
Table-1
Physical properties of chemicals used at 303 K
Component M. wt. Density Refractive index Boiling point o
C Purity % Supplier
Exp. Lit. Exp. Lit.
Benzene 78.114 0.8683 0.8685 1.496 1.4962 80.1 99 % BDH
Butanol 74.12 0.8053 0.8057 1.3970 1.3971 117.7 99.5 % BDH
Butanone 72.11 0.7941 0.7941 1.3770 1.3773 79.6 99.5 % BDH
Chloroform 119.38 1.4693 1.4706 1.4400 1.4401 61.2 99 % BDH
Iso-butyl acetate 116.16 0.8621 0.8599 1.3880 1.3880 117.5 99 % BDH
Toluene 92.14 0.8575 0.8577 1.4930 1.4935 110.6 99 % BDH
Water 18.015 0.9951 0.9956 1.3340 1.3342 100.0 99.5 % BDH
Determination of the Tie Lines: The determination was carried out using a double-walled similar to that described by (Novak, 1987). The separating funnels containing heterogeneous mixture of three components were placed in a thermostat bath. Temperature was controlled within an accuracy of ± 0.01 oC by using a temperature regulator as shown in figure 2. The prepared heterogeneous mixtures were shaken for at least 20 min., equilibration of the two phases took place in a thermostatted double-walled separating funnels (250 ml) over a period of 20 hr. After equilibrium had been reached, the refractive index of one of the separated phases was measured. The composition of the tie-lines was calculated numerically from the calibration data by polynomial regression analysis. The third order polynomial was the best approximation (stand. dev. = 1.5*10-4) of the relation between refractive index and composition.
Figure-2
Thermostatted separating funnel for determining tie-lines 1-separating funnel, 2-thermostatting mantle, 3-thermometer
holder, 4-stop cock
To determine the tie-lines of the two conjugate layers, ternary two phase systems were analyzed by the so-called cross-section method reported by. This method consists of plotting the refractive index of a mixture against concentration of one of the components at a constant ratio of the remaining two components.
Results and Discussion
Tie-Line Data: The tie-line data between the two conjugate phases were obtained from the cross-section method. The liquid-liquid equilibrium data (tie-line data) obtained experimentally for the series of the ternary systems water-phenol-benzene, water-phenol-chloroform, water-phenol-isobutyl acetate, water-phenol-butanol, water-phenol-butanone and water-phenol-toluene at 30oC were plotted in figures 3 to 8, the data of (Macedo and Soreas, 1996) for the system water-phenol-benzene was plotted in figure 3 for comparison only.
The tie-lines data were used to determine the selectivity (Ki) and distribution coefficients (Sij) for the systems under investigation according to the following relationships:
e phase n raffinat ion of i i
Concentrat
phase n extract ion of i i
Concentrat
K
i (1)K
K
S
j i ij
(2)
The subscript (i) is referred to phenol component and (j) is referred to water component one.
A simple graph of distribution curve for phenol compound between the two immiscible phases were obtained by plotting the concentration of phenol compound in organic phase against its concentration in the aqueous phase, and presented in figure 9. This type of diagram could be compared to a Y-X plot for the presentation of vapor-liquid equilibrium data, and the deviation of each curve from the Y-X line is a measure of the selectivity of solvent. As the deviation increases the selectivity of the solvent increases.
Figure-3
Experimental liquid-liquid equilibrium of ternary system water-phenol-benzene
Figure-4
Figure-5
Experimental liquid-liquid equilibrium of ternary system water-phenol-Isobutyl acetate
Figure-6
Experimental liquid-liquid equilibrium of ternary system water-phenol-butanol
Figure-7
Experimental liquid-liquid equilibrium of ternary system water-phenol-Butanone
Figure-8
Experimental liquid-liquid equilibrium of ternary system water-phenol-Toluene
Figure-9
Distribution Coefficient of phenol between water layer and solvent layer at 303 K
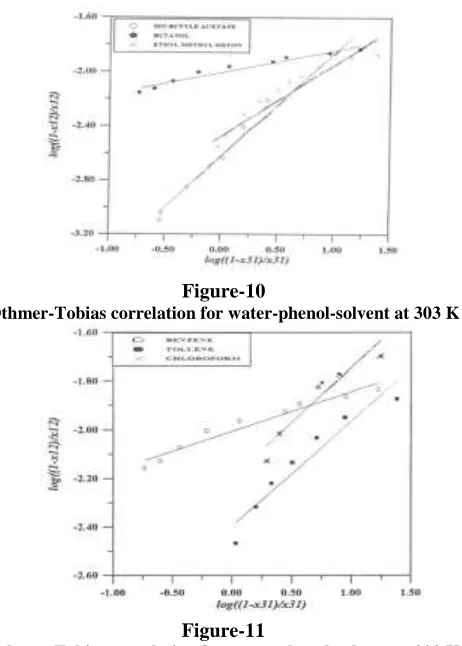
Evaluation of the Consistency of the Experimental Tie-Lines: The accuracy of the experimental data for the six ternary systems at 30 oC was checked by plotting in figures 10 and 11, the Othmer-Tobias correlation (Othmer and Tobias, 1942):
n
X
-X
m
X
-X
SS SS WW
WW
1
log
1
log
(3)Figure-10
Othmer-Tobias correlation for water-phenol-solvent at 303 K
Figure-11
Othmer-Tobias correlation for water-phenol-solvent at 303 K
Figures 3 to 8 show the equilibrium diagrams of the systems water-phenol-organic solvent (benzene, chloroform, isobutyle acetate, butanol, butanone (MEK) and toluene). The six solvents are totally miscible with phenol. For butanol system the two phase area is small. A small area has the disadvantage that the purity of the extract is low and that, more over, only mixtures of limited concentrations can be extracted. Thus it follows for figure 6 that with butanol as extractive solvent at 303 K, no mixtures can be separated that contain more than 40 % of phenol. For benzene the area under the binodal curve is large and for figure 3 it can be seen that mixtures of 70 % phenol can be extracted with benzene. In figures 4, 5, 7 and 8 the same conclusions can be reached for the other solvents. Figure 9 verifies this result. It shows the distribution curves of benzene, chloroform, isobutyle acetate, butanol, butanone and toluene. The distribution coefficient of phenol was higher towards isobutyle acetate and butanone than for the other solvents.
Also, the liquid-liquid equilibrium data presented were plotted in figure 10 in the form of separation factor (S) versus the equilibrium distribution ratio of phenol (K), in the range of concentration under observation. This study showed that, for all the solvents considered, the organic ester and keton emerge as the most indicated for the separation of phenol from water. Although isobutyle acetate and MEK have similar distribution curve. The boiling point and specific gravity of MEK differ
greatly from those of phenol, and so MEK is a more suitable solvent for phenol.
Figure 12
Separation factor versus equilibrium distribution ratio for extraction of phenol from water with solvents at 303 K
Correlation methods: Estimation of parameters: The NRTL equation (Renon and Prausnitz, 1968), the UNIQUAC equation (Anderson and Prausnitz, 1978) and the UNIFAC equation (Fredenslund and Prausnitz, 1982) were used to correlate the experimental phase equilibrium data. Binary parameters were calculated using the maximum likelihood procedure for the minimization of the following objective functions. 2 1 1 ln -ln 1 k M K N i γ γ x x F II i I i I i II i
(4)
M k N i j ijk jk x x F i 1 1 2 1 2 -ˆ 2 (5)The calculation begins using the objective function F1 and when the parameters are near optimum value the calculation continues with the objective function F2. For ternary mixtures nine parameters for the NRTL equation must be fitted, six parameters for the UNIQUAC equation and the predictive method for UNIFAC equation for describing a ternary data set. This procedure gives a set of parameters shown in tables 2 and 3
Calculation of Tie-Lines: The above mentioned procedure for estimated – parameters were employed to calculate the tie-lines. Computation started from the heterogeneous mixture:
2
x
x
Z
II i I i i (6)
Figures 13, 14, 15, 16, 17 and 18 represent NRTL models correlation with two regression criteria for the systems under study.
A good representation was obtained in figures 13, 15, 16, 17 and 18 for the two regression criteria Sa, Sk and the residuals to the experimental data were low but residuals to the distribution coefficients was better for the regression criteria Sk than the regression criteria Sa for all the systems. For chloroform system, the NRTL model represents the correlation with the regression criteria Sk only and give a good residuals for both the experimental data and the distribution coefficients.
Figures 19, 20, 21, 22, 23 and 24 represent the UNIQUAQ modeling to the ternary system under study. For all the systems the residuals were higher for the experimental data and the distribution coefficient, and representation was better for the NRTL model than the UNIQUAC model.
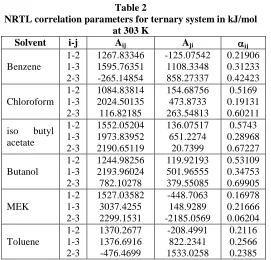
Table 2
NRTL correlation parameters for ternary system in kJ/mol at 303 K
Solvent i-j Aij Aji ij
Benzene 1-2 1-3 2-3 1267.83346 1595.76351 -265.14854 -125.07542 1108.3348 858.27337 0.21906 0.31233 0.42423 Chloroform 1-2 1-3 2-3 1084.83814 2024.50135 116.82185 154.68756 473.8733 263.54813 0.5169 0.19131 0.60211 iso butyl
acetate 1-2 1-3 2-3 1552.05204 1973.83952 2190.65119 136.07517 651.2274 20.7399 0.5743 0.28968 0.67227 Butanol 1-2 1-3 2-3 1244.98256 2193.96024 782.10278 119.92193 501.96555 379.55085 0.53109 0.34753 0.69905 MEK 1-2 1-3 2-3 1527.03582 3037.4255 2299.1531 -448.7063 148.9289 -2185.0569 0.16978 0.21666 0.06204 Toluene 1-2 1-3 2-3 1370.2677 1376.6916 -476.4699 -208.4991 822.2341 1533.0258 0.2116 0.2566 0.2385
For all the systems above it can be seen that, at low concentration of the solute both the NRTL model and UNIQUAC model fit the experimental data. But at high concentrations the deviation from experimental are obvious.
Figures 25, 26, 27, 28, 29 and 30 represent UNIFAC models correlation for the systems under study. In figures 25, 26, 27, 28, 29 and 30 the residuals were higher for the experimental data, and representation was better for both the NRTL model and UNIQUAC model than the UNIFAC model.
For Butanol system, the UNIFAC model gives good residuals for both the experimental data and the distribution coefficients than the UNIQUAC model.
Table-3
UNIQUAC correlation parameters for ternary system in kJ/mol at 303 K
Solvent i-j Bij Bji
Benzene 1-2 1-3 2-3 -7.1734 220.908 -53.1383 164.64 514.0597 91.1305 Chloroform 1-2 1-3 2-3 52.6238 643.2392 81.6293 345.7274 425.8234 78.7847
iso butyl acetate 1-2 1-3 2-3 267.108 158.795 2141.241 322.71 1106.435 -282.265 Butanol 1-2 1-3 2-3 90.3247 2514.7869 827.905 80.0523 473.0648 -270.6094 MEK 1-2 1-3 2-3 93.4385 949.4014 1543.2946 396.148 546.9067 423.9119 Toluene 1-2 1-3 2-3 -103.013 47.108 -246.023 375.872 1139.4387 904.198 Table-4
Classical and statistical regression criteria
M N II ik II ik I ik I ik k iγ
x
γ
x
S
a 1 1 2- (7)
2 1 1
-
M N II ik I ik II ik I ikk i
a
a
a
a
S
a (8) 2 1 1ln
ln
-k k i M N I i II i I i II iγ
γ
x
x
S
k
Figure-13
Representation of the ternary system water-phenol-benzene by NRTL model with parameters obtained from LLE data
at 303 K
Figure-14
Representation of the ternary system water-phenol-chloroform by NRTL model with parameters obtained from
LLE data at 303 K
Figure-15
Representation of the ternary system water-phenol-isobutyle acetate by NRTL model with parameters obtained from
LLE data at 303 K
Figure-16
Representation of the ternary system water-phenol-butanol by NRTL model with parameters obtained from LLE data
at 303 K
Figure-17
Representation of the ternary system water-phenol-MEK by NRTL model with parameters obtained from LLE data at
303 K
Figure-18
Representation of the ternary system water-phenol-toluene by NRTL model with parameters obtained from LLE data
Figure-19
Representation of the ternary system water-phenol-benzene by UNIQUAC model with parameters obtained from LLE
data at 303 K
Figure-20
Representation of the ternary system Water – phenol - chloroform by UNIQUAC model with parameters obtained
from LLE data at 303 K
Figure-21
Representation of the ternary system water-phenol-isobutyle acetate by UNIQUAC model with parameters obtained from
LLE data at 303 K
Figure-22
Representation of the ternary system water-phenol-butanol by UNIQUAC model with parameters obtained from LLE
data at 303 K
Figure-23
Representation of the ternary system water-phenol-MEK by UNIQUAC model with parameters obtained from LLE data
at 303 K
Figure-24
Representation of the ternary system water-phenol-toluene by UNIQUAC model with parameters obtained from LLE
Figure-25
Representation of the ternary system water-phenol-benzene by UNIFAC model with parameters obtained from LLE
data at 303 K
Figure-26
Representation of the ternary system water-phenol-chloroform by UNIFAC model with parameters obtained
from LLE data at 303 K
Figure-27
Representation of the ternary system water-phenol-isobutyle acetate by UNIFAC model with parameters obtained from
LLE data at 303 K
Figure-28
Representation of the ternary system water-phenol-butanol by UNIFAC model with parameters obtained from LLE
data at 303 K
Figure-29
Representation of the ternary system water-phenol-MEK by UNIFAC model with parameters obtained from LLE data at
303 K
Figure-30
Representation of the ternary system water-phenol-toluene by UNIFAC model with parameters obtained from LLE
Correlation: In liquid extraction studies experimental results obtained for low solute concentrations are most important. Table 5 shows the root mean square deviation between the experimental and calculated values for the tie-lines, as calculated from the formula
21
1 1 1
2
6 -ˆ
100 min
k
k N
j I
i
ijk jk x M x
F
RMSD i
(10)
and the average error in the distribution ratio for all tie-lines
2 1
2
-ˆ
100
k
k k
k
β
β
M
β
β
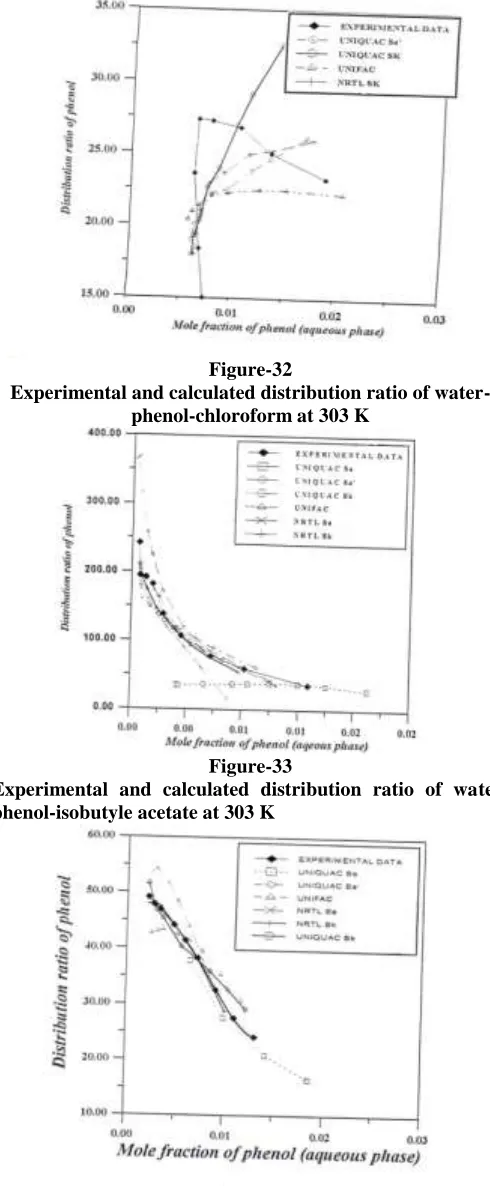
(11)An analysis of table 5, shows that for all data sets the binodal curves are well reproduced by the regression criteria Sa for both models NRTL and UNIQUAC model but give a high residuals of the phenol distribution ratios for almost all the system as indicated by the residual . The overall fit measured by F is worse when both Sa’ and Sk were applied to UNIQUAC model but a large improvement in the values of is obtained as compared with the results of the regression criteria Sa. Using the UNIFAC equation, the correlation residuals does not improve the results. The NRTL models results using the regression criteria Sk can be more accurate than the UNIQUAC equation and give good improvement in F and the values of . Table 5 verifies the results of the above figures. The disagreement between the experimental and calculated results, expressed in terms of solute distribution ratios, is more easily visualized in figures 31, 32, 33, 34, 35 and 36.
Figure 31, shows the experimental phenol distribution ratio at 30 oC together with those calculated by using the NRTL (Sa and Sk, which gave the best NRTL results), UNIQUAC (Sa, Sa’ and Sk) and UNIFAC (Sk). The NRTL results can be seen to be more accurate with the objective function Sk than the other models with the different objective function. The results for the other five systems, figures 32, 33, 34, 35 and 36 are similar to that of figure 31.
Figure-31
Experimental and calculated distribution ratio of water-phenol-benzene at 303 K
Figure-32
Experimental and calculated distribution ratio of water-phenol-chloroform at 303 K
Figure-33
Experimental and calculated distribution ratio of water-phenol-isobutyle acetate at 303 K
Figure-34
Figure-35
Experimental and calculated distribution ratio of water-phenol-MEK at 303 K
Figure-36
Experimental and calculated distribution ratio of water-phenol-toluene at 303 K
Table-5
Residuals for the six ternary Liquid-liquid equilibrium data set correlated by NRTL, UNIQUAC and UNIFAC at 303 K
Data Set
No. Residuals
NRTL UNIQUAC UNIFAC
Sa Sk Sa Sa’ Sk Sk
1 F 0.342 1.4704 1.092 1.73 1.859 1.4996
117.98 15.284 96.84 17.38 16.165 19.318
2 F 0.432 0.7267 1.021 0.405 0.501 0.5649
65.76 12.645 97.787 15.359 15.757 19.106
3 F 0.543 1.788 0.7411 2.697 1.287 2.445
32.944 9.005 68.856 29.725 31.369 21.054
4 F 0.2496 0.9316 0.412 2.729 2.731 2.482
13.975 1.9572 152.02 5.608 5.608 8.803
5 F 1.122 1.867 1.058 2.475 2.058 2.703
73.989 4.75 51.828 14.146 19.201 14.948
6 F 1.234 1.832 1.949 2.308 1.93 2.843
129.28 1.54 172.92 6.173 9.895 46.86
Average F 0.9775 1.436 1.045 2.057 1.727 2.089
73.634 1.13 106.71 14.732 16.332 21.685
Table-6
Fitting Accuracy of Ternary LLE Data
No.
NRTL UNIQUAC UNIFAC
Sa Sk Sa Sa’ Sk Sk
x x x x x x
I II I II I II I II I II I II
1 15.1 16.9 18.8 1.66 13.8 16.3 23.8 2.01 4.8 7.20 28.4 1.98
2 0.76 0.76 9.76 0.64 11.8 6.51 5.28 0.83 22.1 1.25 7.52 0.98
3 6.51 1.06 22.1 0.47 8.93 12.1 35.3 1.01 17.1 1.53 32.6 1.27
4 3.15 0.62 11.7 0.39 3.49 4.28 36.8 0.76 36.8 0.78 32.7 0.48
5 5.55 14.2 24.2 2.11 13.2 5.33 48.3 1.38 27.3 0.72 38.1 2.12
6 7.13 0.56 22.0 0.41 9.63 13.2 33.2 1.54 29.1 1.79 25.6 2.16
Comparison of Fitting Accuracy: The fitting accuracy of six set of ternary LLE data applying NRTL with two regression criteria, UNIQUAC with three regression criteria and UNIFAC with one regression criteria are listed in Table 6, it can be seen from the table that correlation is improved by applying the NRTL model with regression criteria Sk .
Conclusion
Of the six solvents used to extract phenol from an aqueous phenol solution, both iso-butyle acetate and Etyl methyl keton have the highest selectivity and capacity because the iso-butyle acetate hydrogen bonds and ethyl methyl keton hydrogen bond preferentially with phenol. And due to the greatest differences between the boiling point and specific gravity of the ethyl methyl keton and those of phenol. It is therefore considered an excellent solvent for extracting phenol from phenol-water solutions.
The consistency of experimental tie-line data for the ternary system water-phenol-solvent at 30 oC was confirmed for six different solvents, and the data can then be used to calculate the values of the parameters and the tie-lines in the NRTL, UNIQUAC and UNIFAC models.
The NRTL model for the activity coefficients of ternary liquid systems gives a good representation of liquid-liquid equilibria for the systems under study. This fact helps for calculations required in the design of extraction unit to reach the optimum use of the solvent.
The root mean-square deviation F between the calculated and the experimental tie-lines lays within the range of 1.867-0.726 for the NRTL model for the objective function F2 and in terms of the error the range is lays within 15.284-9.005.
The NRTL equation gives F values slightly lower than those of the UNIQUAC equation but the difference is not significant it is 1.2-1.1 times larger than the NRTL model.
The NRTL equation gives the best results, in which case it proves to be more accurate than the UNIQUAC equation at all objective functions, it is 1.5 times larger than the NRTL model.
The UNIFAC equation gives F values slightly lower than those of the UNIQUAC equation for the system containing an alcohol component but the difference is not significant.
Nomenclature: Abbreviations: LLE = Liquid – Liquid Equilibrium, MEK = Methyl Ethyl Keton (Butanone), NRTL = Non-Random Two Liquid activity coefficient model, RMSD = Root mean square deviation, UNIFAC UNIQUAC = Functional Group Activity Coefficients model, UNIQUAC = Universal Quasi-Chemical Activity Coefficient model
Symbols: ai = Activity of component i, F1= Objective function no. 1, F2= Objective function no. 2, GE= Excess Gibbs function, Ki = Selectivity, M = slope of the line, M = No. of experimental points, M.wt. = Molecular weight, N = Intersect of the line, Sa = Classical regression criteria, SK = Statistical regression criteria, Sij = Distribution coefficient,
x
I i
= mole fraction of component i in the I phase,
x
IIi = mole fraction of component i in the II phase, Xss = mole fraction of solvent in the, solvent phase, Xww = mole fraction of water in the water phase, Zi = number of mole of component i in the system, Greek Litters: = Average error, = Activity coefficient
Superscript: E = Excess Property, I = Phase I, II = Phase II,
^
= Experimental valueSubscript: i = component i, j= component j, ss = solvent in the solvent phase, ww = water in the water phase
References
1. Alders L., Liquid-Liquid Extraction, 2nd ed., Elsevier publishing Co., (1959)
2. Anderson T.F. and Prausnitz J.M., Ind. Eng. Process Des. and Dev., 17, (1978)
3. Francis A.W., Liquid-Liquid Equilibrium, Interscience publishers, NewYork, (1963)
4. Fredenslund Aa. and Rasmussen P., vapor-liquid equilibria using UNIFAC a group contribution method, Elsevier, Amsterdam, (1977)
5. Fredenslund Aa. and Rasmussen P., Fluid phase equilibria, 24, 115-150, (1985)
6. Hull A. and Kronberg B., J. Chem. Eng. Data, 51, 202-208, (2006)
7. John A.R., William B. and Theodore K., Organic solvents, (1986)
8. Macedo E.A. and Soares M.E., Fluid Phase equilibria, 26, 36-42, (1996)
9. Novak J.P., Matous J. and Pick J., Liquid-liquid Equilibria, Elsevier, Amsterdam, (1987)
10. Null H.R., Phase equilibrium in process design, (1970) 11. Othmer D.F., Ind. Eng. Chem., 38, 11-19 (1942)
12. Radecki A. and Grzyboski J., J. Chemical and Engineering data, 20, 2, (1975)