Research Article
Effect of different nitrogen levels and
cutting stages on crude protein, crude
fiber, dry matter and green fodder yield
of oat (Avena sativa L.)
Muhammad Zakirullah
1, Numan Ali
1*, Tariq Jan
1, Aka Khil
2,
Hazratullah
2and Muhammad Ikramullah
31. Miscellaneous Crop Section, Agricultural Research Institute Tarnab-Peshawar-Pakistan 2. Department of Agronomy, The University of Agriculture, Peshawar-Pakistan
3. Department of Agronomy, The University of Agriculture Peshawar AMK Mardan-Pakistan
*Corresponding author’s email: numan1@aup.edu.pk Citation
Muhammad Zakirullah, Numan Ali, Tariq Jan, Aka Khil, Hazratullah and Muhammad Ikramullah. Effect of different nitrogen levels and cutting stages on crude protein, crude fiber, dry matter and green fodder yield of oat (Avena sativa L.). Pure and Applied Biology. Vol. 6, Issue 2, pp448-453.
http://dx.doi.org/10.19045/bspab.2017.60044
Received: 01/12/2016 Revised: 20/03/2017 Accepted: 23/03/2017 Online First: 25/03/2017
Abstract
In Pakistan and especially in the Province Khyber Pakhtunkhwa, less attention has been given to the research of fodder and forages, it is therefore animals are generally underfed and under nourished which results in their poor performance. An experiment entitled “effect of different nitrogen levels and cutting stages on crude protein, crude fiber, dry matter and green fodder yield of oat (Avena sativa L.)” was conducted at Agriculture Research Institute Tarnab, under the semi-arid condition of Peshawar valley to investigate an optimum nitrogen level and a proper cutting stage of oat that gives best results in terms of quality and quantity. The experiment was conducted by using factorial split plot randomized complete block design (RCBD) replicated four times. The nitrogen levels (N1 = 30, N2 = 60, N3 = 90 and N4 = 120 kg ha-1 respectively) were assigned to main plots while oat cutting stages i.e (booting and 50 % heading stage) were allocated to sub plot. Maximum crude protein (9.53%), crude fiber (39.27%) and dry matter (21.9%) were obtained with application of N@120 kg ha-1 while higher (39.16 t ha-1) green fodder yield was recorded in plots received N@ 90 kg ha-1. Cutting at pre booting stage resulted in highest crude protein (8.42%) while it gave lowest crude fiber (35.22%) and green fodder yield (31.25 t ha-1) whereas cutting at 50% heading stage yielded minimum crude protein (7.00%) and higher crude fiber (38.23%) and green fodder yield (39.50 t ha-1). Results revealed that nitrogen should be applied @ 90 kg ha-1 and cutting should be taken at pre booting stage of fodder oat to get optimum outcome in term of quality and quantity in the study area.
Keywords: Oat (Avena sativa L.); Nitrogen; Cutting intervals; Crude protein; Crude fiber; Green fodder
Introduction
Fodder crops have great importance in livestock because of the fact that the ample, nutritious regular fodder availability is a basic requirement for livestock production
Oat (Avena sativa L.) locally known as jodar, belongs to the family poaceae. Oat is one of the most important fodder crops grown in rabi season throughout Pakistan both under irrigated and barani conditions. Temperate and cool sub-tropical conditions are pleasant for its growth and development
[2]. It is a fast growing, palatable, succulent and nutritious fodder crop. It provides excellent nutrition when fed in combination with legumes, like berseem, lucerne or alfalfa, shaftal and pea or vetch [3]. Oat is mostly fed as green fodder to animals while the surplus quantity is converted into silage or hay for use during the green fodder shortage periods. It is a favorite feed of all animals and its straw is soft and better to wheat and barley. It is high in TDN, protein, fat, vitamin B1 and minerals as phosphorus and iron [4].
One of several reasons for lower yield of fodder is low fertility status of most cultivated soils; especially nitrogen is deficient in the cultivated soils of the world
[5]. To improve the yield and quality of fodder crops is to determine their fertilizer requirements. The management of plant nutrition not only enhances the fodder production but also improves the quality of fodder [6]. Nitrogen plays a very important role in raising the nutritive level of the fodders. Nitrogen is a major component of amino acids, the building blocks of proteins. Increasing in dose of nitrogen to plant enhance the protein level up to some extant, but nitrogen application to crop beyond a certain limits cannot benefice the crops [7]. The protein and fiber contents in the fodder and forages are not constant, but assorted according to stage of cut and fertilizer application [8]. Meager digestibility and
poorer intake are usually linked with high fiber content and low protein content. As the crops get mature, dry matter and cell wall constituents raise and protein contents drop
[9].
Realizing the fact that Pakistan and especially Khyber Pakhtunkhwa region is lacking of green fodder for its animals both in term of quantity and quality-and keeping in view the above facts an experiment entitled effect of different nitrogen levels and cutting stages on crude protein, crude fiber, dry matter and green fodder yield of oat (Avena sativa L.) was designed to investigate the optimum level of nitrogen and best cutting stage harness a reasonable nutritive green fodder for the animals. Materials and methods
Description of experimental site
To evaluate nitrogen levels and cutting stage effect on quality and yield of fodder oat an experiment was conducted at Agriculture Research Institute Tarnab, Peshawar during rabi season November, 2015. The site is located about 14 km east of Peshawar city, the capital of Khyber Pakhtunkhwa. Peshawar is located about 1600 km of north Indian Ocean and thus has a continental climate. The research institute is located at 34º N and 71.3º E having altitude of 450 m above sea level. The soil of research institute is silty loam (clay and silt 27 and 50% respectively) with pH value of soil 7.7-8.0,and contained 1.06% organic matter with 0.053% , 22.1 and 186.0 mg kg-1 N, P and K respectively. Meteorological data were
collected from the Director SPN
Meteorological Section Agriculture
Table 1. Weather data during the Oat season 2015-2016
Months
Maximum temperature (°C)
Minimum temperature (°C)
Relative humidity (%) At 8:00 am
Relative humidity (%) At 5:00 pm
Rainfall (mm)
Sunshine
Hours Minutes
November (2015) 24.80 6.20 57.10 44.16 Nil 7 00
December (2015) 20.13 0.56 48.10 38.40 Nil 6 10
January (2016) 18.50 1.80 59.60 44.60 44.80 6 33
February (2016) 20.90 7.40 62.17 43.50 58.70 Out of
order
Out of order
March (2016) 26.14 10.20 75.25 49.80 120.00 6 06
April (2016) 29.98 15.50 62.70 49.90 148.20 7 10
Source: Director SPN Meteorological Section Agriculture Research Institute Tarnab Peshawar, Pakistan
Experimental treatments and design The experiment was carried out with factorial randomized complete block design with split plot arrangements. Broadcast sowing method was used in each plot of size 15 m2. Nitrogen was used as urea and all its levels i.e N1 = 30 kg ha-1, N2 = 60 kg ha-1, N3 = 90 kg ha-1 and N4 = 120 kg ha-1 were assigned to main plots while oat cutting stages i.e at booting stage and at 50% heading stage were given to subplot. Nitrogen levels were applied to the crop in second irrigation and all other agronomic practices were kept standard for all the treatments.
Data recording procedure Crude protein %
To 1.0-g of oven dried plant material 30 ml of concentrated H2SO4 and 5 g digestion mixture [K2SO4 : CuSO4 : FeSO4 (20:2:1)] was added and material was digested in the digestion chamber at 400 °C for 2-3 hours. The digested mixture was then cooled down and dilution was made with the help of distilled water in 250 ml volumetric flask. 10 ml of diluted sample was taken from this dilution. Distillation was done in Kjeldahl apparatus and nitrogen evolved as ammonia was collected in a receiver containing 2 % boric acid solution and it was then titrated against standard 0.1 N H2SO4 till golden yellow color appeared and then the volume of acid use was recorded. The reading was multiplied by 5.83 to get crude protein percentage.
Crude fiber %
Took 1.0 g of oven dried plant material in 250 ml beaker, added 1.25 % H2SO4 and distilled water and made the volume upto 200 ml. Then it was placed on flame for 30 minutes, filtered and washed. Again added 1.25 % NaOH and distilled water and made volume up to 200 ml. Heated for 30 minutes and residues were washed and filtered again. The residues were put in a pre-weighed crucible and it was placed in an oven at 105 °C for drying for 24 hours. After recording the dry weight (W1) the samples were placed in muffle furnace at 600 °C till grey or white ash was obtained. Then cooled it and the weight of ash (W2) was recorded and the crude fiber % was calculated using the following formula
Crude fiber (%) = W1 – W2 (g) x 100 Sample weight Dry matter (%)
To discover dry matter determination, aluminum containers were oven dried and its weight was recorded through electric balance. Then 10 g of plant sample was weighed in each container and placed it in oven at 105 °C till constant weight was attained. Dry matter percentage was calculated by the following formula
Dry Matter (%) = Weight of dry sample (g) x 100 Weight of green sample (g)
Quality parameters like crude protein %, crude fiber %, and dry matter % were
determined by using the methods
Green fodder yield (t ha-1)
All the plots in each replication were harvested and tied into bundles and these bundles were weighed separately with spring balance to determine the total biomass per plot and then yield was converted on hectare basis in tones.
The recorded data was statistically analyzed according to Steel and Torrie, (1982) [11]
using RCB design with split plot
arrangements. To determine treatments mean difference, least significant difference (LSD) was used at 5 % level of significance (P ≤ 0.05).
Results and discussion Crude protein %
The data regarding the effect of different
level of N and cutting stage on the protein level is shown in Table 2. The data indicated that protein level in percent is increases with increasing nitrogen levels. This finding is in line with the results of Knettle et al. [8] and Khandaker et al. [6]. This might be due to the fact that nitrogen was involved in the synthesis of amino acid which is the building unit of protein. Similarly protein level at pre booting stage of oat was more than that at 50% heading stage. This is probably due to the verity that as much as crop matured the protein content of the crop decreases as cellulose content increases. This finding is similar to those of Hunt et al.
[9] and [12].
Table 2. Crude Protein percentage of oat as affected by various nitrogen levels and different cutting stages
Cutting Stages Nitrogen levels (Kg ha-1)
30 60 90 120 Mean
At Pre Booting 6.380 7.800 8.467 10.877 8.426a
At 50% heading 5.660 6.667 7.490 8.200 7.004b
Mean 6.020c 7.233b 8.068b 9.538a
LSD value for N levels (P≤0.05) = 1.317, LSD value for cutting stage (P≤0.05) = 1.058
Crude fiber %
The data presented in Table 3, revealed that crude fiber percentage of the oat is gradually increased with increase of nitrogen level. Minimum (34.320%) crude fiber was obtained with the lowest level of N=30 kg ha-1 while maximum crude fiber (39.275%) was observed with the highest level of N=120 kg ha-1. These results are parallel with the discovery of Iqbal et al. [2]. This may be due to the fact that nitrogen plays a
vital role in enhancing the vegetative growth and cellulose content of the crop. As for as cutting stage is concern, pre booting stage resulted the lowest (35.822%) crude fiber than that at 50% heading stage (38.236%). This might be due to the maturity of crop, as the crop attaining the maturity the fiber content also increases due to the increase of cellulose content and dry matter. These results are similar with the results of Iqbal et al. [2] and Hunt et al. [9].
Table 3. Crude fiber percentage of oat as affected by various nitrogen levels and different cutting stages
Cutting Stages Nitrogen levels (Kg ha-1)
30 60 90 120 Mean
At Pre Booting 34.277 35.230 35.647 38.133 35.822a
At 50% heading 34.363 37.337 39.627 40.417 38.236b
Mean 34.320 c 36.637b 37.637ab 39.275a
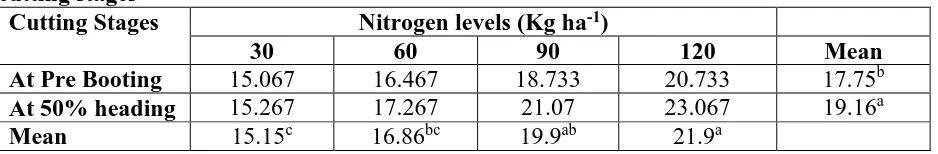
Dry matter (%)
Both nitrogen levels and cutting stages had significantly affected the dry mater % as exposed in Table 4 below. This data show that maximum (21.9%) dry matter was achieved in the plot that received maximum (120 kg ha-1) nitrogen while lowest (15.15%) in the plot that had received minimum (30 kg ha-1) nitrogen. These findings are in matching with the results of
Iqbal et al. [2] and [13]. This was most likely due to the truth that nitrogen boost up the vegetative growth of oat which resulted in the increase in dry matter of oat. Regarding cutting stages highest dry matter percentage at 50% heading stage as compared to pre booting stage. This is in confirmation with the findings of [14] and Hunt et al. [9] who reported that dry matter in crop increase with maturity.
Table 4. Dry matter percentage of oat as affected by various nitrogen levels and different cutting stages
Cutting Stages Nitrogen levels (Kg ha-1)
30 60 90 120 Mean
At Pre Booting 15.067 16.467 18.733 20.733 17.75b
At 50% heading 15.267 17.267 21.07 23.067 19.16a
Mean 15.15c 16.86bc 19.9ab 21.9a
LSD value for N levels (P≤0.05) = 3.8296, LSD value for cutting stage (P≤0.05) = 0.7193
Green fodder yield (t ha-1)
Green fodder yield (t ha-1) had significantly affected by various nitrogen levels and different cutting stages as denoted in Table 5. The data showed that increase in nitrogen level up to a certain level increase the green fodder yield and beyond that limit application of nitrogen did not benefit the crop in term of green fodder yield. As we see from the tabulated data below, highest fodder yield (39.166 t ha-1) was attained with the application of nitrogen @ 90 kg ha -1 while it goes down to (36.500 t ha-1) with
further increase in nitrogen @ 120 kg ha-1. The lowest fodder yield (32.00 t ha-1) was recorded with the lowest nitrogen level (30 kg ha-1). This might be due to the reason
that too much nitrogen fertilization enhances the vegetative growth and caused lodging, which reduced the yield. These outcomes are supported by the findings of Knettle et al. [8] and Hassan et al. [1]. In case of cutting stages highest (39.50 t ha-1) fodder yield was confirmed at 50% heading stage while the lowest (31.25 t ha-1) fodder yield was noted at pre booting stage. This probably due to the fact that dry matter vary continuously with the development of the crop, it is therefore when oat reached to maturity it gained weight by availing extra time in utilizing nutrients, air and light. These results are analogous with the results of Gupta et al. [13] and Hassan et al. [1].
Table 5. Green fodder yield (t ha-1) of oat as affected by various nitrogen levels and
different cutting stages
Cutting Stages Nitrogen levels (Kg ha-1)
30 60 90 120 Mean
At Pre Booting 27.667 29.000 35.333 33.000 31.250b
At 50% heading 36.333 38.667 43.000 40.000 39.500a
Mean 32.000 c 33.833bc 39.166a 36.500ab
Conclusion and recommendation
It is concluded from this experiment that under the semi-arid condition of Peshawar valley nitrogen should be applied @ 90 kg ha-1 to oat and it should be cut at pre booting stage to get a quality fodder for animals. It was also noted during the study that subsequent cut was achieved in short time after cutting oat for fodder at pre booting stage which further contributed in fodder yield than cutting at 50% heading stage. Authors’ contributions
Conceived and designed the experiments: M Zakirullah & N Ali, Performed the experiments: A Khil, Hazratullah & M Ikramullah, Analyzed the data: N Ali, Contributed reagents/ materials/ analysis tools: T Jan, M Zakirullah, Wrote the paper: M Zakirullah & N Ali.
References
1.Hassan B & Shah WA (2000). Biomass, grain production and quality of oat (Avena sativa L.) under different cutting regimes and nitrogen levels. Cereal Research Communications: Islamabad (Pakistan) 28: 203-210.
2. Iqbal MF, Sufyan MA, Aziz MM, Zahid IA, Qamir-ul-Ghani & Aslam S (2009). Efficacy of nitrogen on green fodder yield and quality of oat (Avena sativa
L.) J of Anim & Plant Sci 19(2): pp. 82-84.
3. Thomson EF, Rihawi S & Nersoyan N (1990). Nutritive value and yields of
some forage legumes and barley
harvested as immature herbage, hay and straw in northwest Syria. Experimental Agriculture 26: 49–56.
4. Hussain A, Khan S, Mufti MU & Bakhsh A (2002). Introduction and use of oat cultivars in Pakistan. Proceedings of “5th
TAPAFON (Temperate Asia Pasture and Fodder Network) meeting/conference held at Renewable Natural Resources
Research Center, Bajo
(Wangdue-Bhutan) pp. 159-166.
5. Ulysses SJ (1982). Fertilizers and Soil
Fertility. 2nd Edition. Reston Publishing Co. Reston, Virginia. A prentice-Hall Co.
6. Khandaker ZH & Islam MM (1988). Effect of nitrogen fertilization and stage of maturity on yield and quality of fodder maize. Bangladesh J Anim Sci 7(1-2): 47-53.
7. Don E (1989). Efficient use of fertilizers – nitrogen. Section contents pp. 1-19.
8. Knettle JR, Prine GM, Ruelke OC,
Sollenberger LE & Staples CR (1991). Forage potential of mott dwarf elephant
grass evaluated under intensive
management in Northern Florida. Soil Crop Sci Soc FL Proc 50: 51–4.
9. Hunt CW, Kezar W & Vinande R (1992). Yield, chemical composition and ruminal ferment ability of corn whole plant, ear and stover as affected by hybrid. J Production Agri 5: 286–90.
10. A. O. A. C (1984). Official methods of analysis. Association of official analytical chemists. 14th ed. Arlington, Virginia (USA).
11. Steel RG & Torrie JH (1982). Principles
and Procedures of Statistics: A
biometrical Approach. 2nd Ed., 5th
Printing Publishers, McGraw Hill Book Co Inc (London).
12. Mislevy P, Martin FG & Adjei B (1989).
Changes in elephant grass plant
components with maturity:I Percentage Dry Yield. Proc. Of the XVI Int. Grassl Congress (France) pp: 4–11.
13. Gupta PC, Randhir S & Pradhan K (1976). Availability in protein, cell wall constituents and in vivo nutrient digestibility in some important strains of fodder oat harvested at different stages of growth. Indian J Agri Sci 46: 359–63.
14. Aerts JV, De-Barbander DL, Cottyn BG,