OXI 2018
EUROPEAN OXIDE
Quantitative Description of the Parameters Characterizing Mechanical Failure of Oxides
- The h - c - Concept -
Michael Schütze
DECHEMA-Forschungsinstitut
Frankfurt am Main / Germany
Abstract
Stresses in oxide scales can lead to wanted or unwanted mechanical failure of the scales. In thermo-mechanical processing the removal of oxide scales can based on a “wanted” thermo-mechanical failure situation. For protective oxide scales in plant operation mechanical failure of the scales is usually unwanted. In either case it would be desirable to have a predictive tool for mechanical scale failure. There is a large amount of scattered information on mechanical scale failure in the literature dating back to as far as the 40ies of the last century. However, only recently a comprehensive concept has been proposed for this situation in the form of the h-c-concept. This concept summarizes the mechanical properties of an oxide scale system by introducing the parameter h and uses as a second parameter the effective physical defect size c. Physical defects are pores, cavities, micro cracks, partial delaminations, etc. Once the parameter h has been established by laboratory measurements the critical strains to scale failure of oxide scale systems of the same type can be assessed merely from metallographic investigations on defect sizes without further work-intensive mechanical testing. In the paper the theory of the h-c-concept is derived and examples of measurement data are presented for Fe-oxide, Ni-oxide and Ti-oxide. Furthermore the industrial potential of the concept is discussed briefly.
Personal data:
- PhD in Materials Science from RWTH Aachen University
- 40 years of research work at DECHEMA-Forschungsinstitut in Frankfurt am Main with 20 years as head of the institute
- In parallel professorship at RWTH Aachen University since 1998
- Past President of the European Federation of Corrosion (EFC) and the World Corrosion Organization (WCO)
Experimental determination of the critical strain of fracture of oxide scale in hot
finishing mill conditions using the sigma test
Wanda Melfo1, Edoardo Barabino2
1 Tata Steel. R&D, The Netherlands, 2 Eindhoven University. The Netherlands
1.
Introduction
The surface quality of steel flat products is one of the main properties demanded by the customers. Surface quality defects are in many occasions originated at the hot finishing mill and are related to the behaviour of the oxide scale during rolling. Rolled-in-scale (RIS) is the collective name for these type of defects. More specifically, the fracture of the oxide before the bite will cause the formation of oxide rafts and the extrusion of the steel during the rolling. At the entry to the roll-bite, a tensile strain is exerted on the oxide layer and the oxide scale will fracture if its critical strain of fracture is surpassed [1][2].
The transition from elasto-plastic to brittle behaviour of the oxide layer is dependent on temperature, adhesion of oxides to the substrate, thickness and proportions of the different (iron) oxide types. Crack formation occurs when the critical strain of fracture in the oxide scale is reached. Authors concur that a critical strain of fracture ( c) of the oxide-scale can be defined by:
This critical strain prediction assumes a void size (c), must know the values of a critical stress intensity factor (K) and the elastic modulus (E) of the oxide-scale [3]–[6]. The expression of K is so far derived from experiments done for one type of steel, and the elastic modulus is derived from generic ceramic mechanical properties, both of which are temperature dependent [7] [6] . However, we have previously demonstrated that the iron oxide proportions are variable depending on the substrate composition [8] and it is well known that the properties of each iron oxide have vast differences and high dependency on the deformation temperature [6] . Therefore, it is fair to assume that K and E are not equal for all oxide scales of iron-based materials.
The information available of the scale fracture is not sufficient to define for industrial off-line models that can help on the designing of both the alloys and the processing. A test to determine experimentally the critical strain of fracture at the conditions of finishing mill rolling, the sigma test, has been developed in our labs [2]. In this paper, the results of the tests for different steel compositions and our interpretation of the relation between oxide composition and critical strain of fracture are presented.
2.
Experiment description
The details on the Sigma test design were recently presented in the AISTech 2018 conference [2]. The Sigma test is designed to be able to create a layer of oxide as thin as tertiary scale by resistance heating. Once the oxide is formed, the compression applied is actually a tensile stress on the sample nose, and it is low enough to only fracture the oxide but representative of real strains in the surface of the steel. The moment of the first crack on the oxide is recorded with a high-speed camera and converted to a strain value on the nose. A schematic of the test and shape of the sample is presented in Figure 1.
Four steel compositions, shown in Table 1, were tested . Steel A is a reference low carbon steel and the steels B to D are advanced high strength steels. Strips were taken from cold rolled industrially-processed steels. The nose is deforming at strains below 0.065, which is in the range calculated as the maximum strain in typical HSM conditions
c 1 E 2
K
Figure 1. Schematic of the sigma test and image extracted from the high speed camera with the oxide fracturing while the sample was compressed
Table 1. Steels composition ( wt%)
Samples were heated to three temperatures: 800, 900 and 1000 ºC, and held for sufficient time to allow oxide formation to occur. The heating rate was adjusted to the final test temperature using either 40 ºC/s for T:1000 ºC or 20 ºC/s for 800 ºC (to avoid overshoot). The expected oxide thickness was calculated with existing constants for low carbon oxide growth and the soaking times adjusted accordingly, the longest test was a total of 50 s until the compression. The aim was to have an oxide thickness of max 8 m for a short test and 20 m in a long test. Samples were then deformed at 10 s-1, to a maximum 20 mm (50 %) vertical deformation. Once the sample is compressed, the electrical contact is lost and it starts to cool down, the natural cooling rates were in the order of 12 to 15 ºC/s. The deformed samples were mounted and prepared in cross section to show the centre of the nose. Images were taken with optical microscopy and some with scanning electron microscopy. The thickness and type of oxides were analysed.
3.
Main findings
There were many phenomena occurring during the test, such as formation of blisters on different sizes, delamination, and –the expected- fracture of the oxide (see Figure 2). Blisters were forming due to the heating conditions and their onset was related to the steel composition. The control of the test temperature must be improved. Although the temperature at the moment of the compression was the aimed, some samples reached higher temperatures during the test, while others had a different heating rate. These were the first test and an improvement in the method is in progress.
Figure 2. Phenomena occurring pre and during the compression in the sigma test
3.1 Strain of fracture
Figure 3. Representation of all experiments as a function of measured strain rate vs temperature and oxide thickness at the time of compression.
3.2 Oxide microstructure
When the samples were examined in cross section, the features of the oxides can be more clearly discerned. It was then revealed that for steel C the oxide has cracked in all tests. Probably because the oxide layer was too thin it was not possible to observe the contrast of the crack with the high speed video camera. For steel D it is also the same case, only on few samples the oxide remain with no cracks.
Steel A: Low carbon
Steel C: Mn+Si+Al
Steel D:
Mn
4.
Discussion and Conclusions
The critical strain of fracture was determined using the sigma test that allowed the growth of thin enough oxide layers and to apply high strain rates. For low carbon and steel with Mn+Al there is a clear limit between fracture and not fracture and it is related with the temperature and thickness of the oxide. All AHSS steels gave much thinner oxides than calculated for low carbon and the proportions of magnetite and hematite are higher as well. Steel containing Mn+Si+Al forms particularly thin oxides that tend to blister multiple times, the oxide in the conditions tested was always fracturing. The scatter of the test results makes it hard to draw a trend, but it can serve as an alert for the simulation tool of rolling that indicates if the conditions are given for scale fracture yet.
For an accurate prediction of strain of fracturing the blistering onset must be taken into account, once the blister is formed the more rich oxides of iron are formed and fracture will occur earlier than for oxides with same thickness but attached to the steel. We have found the presence of former liquid oxides decorating the wustite grain boundaries. This must hardly occur in the finishing mill conditions, therefore the heating rate should be more accurately controlled to avoid reaching so high temperatures.
The tests show clearly that the behaviour of the oxide is dependent of the steel type, hence the oxide proportions and the adhesion to the substrate. We suggest that any effort to determine fracture behaviour of oxides is done together with kinetic prediction of growth and blister onset.
5.
References
[1] M. Krzyzanowski, J. H. Beynon, and C. M. Sellars, “Analysis of secondary oxide-scale failure at entry into the roll-gap,” Metall. Mater. Trans. B, vol. 31B, no. 12, pp. 1483–1490, 2000.
[2] W. M. Melfo, J. Wadsworth, and R. Brandon, “Novel Methodology to Determine the Critical Strain of Fracture of Oxide Scale in Hot Finishing Mill Conditions,” RS 172296, 2018.
[3] P. Hancock and J. R. Nicholls, “Application of fracture mechanics to failure of surface oxide scales,” Mater. Sci. Technol., vol. 4, pp. 398–406, 1988.
[4] J. Robertson and M. I. Manning, “Limits to adherence of oxide scales,” Mater. Sci. Technol., vol. 6, pp. 81–91, 1990. [5] M. Schütze, “Mechanical properties of oxide scales,” Oxid. Met., vol. 44, no. 1/2, pp. 29–61, 1995.
[6] Y. Hidaka, T. Anraku, and N. Otsuka, “Deformation of Iron Oxides upon Tensile Tests at 600 – 1250 ° C,” Oxid. Met., vol. 59, no. February, pp. 1–8, 2003.
[7] B. Picque, “Experimental study and numerical simulation of iron oxide scales mechanical behaviour in hot rolling,” Ecole des Mines de Paris, 2004.
New Promising Actuators to Control the Cracking Behaviour of Scale During Hot
Rolling, Including Enhanced Evaluation Technologies
Diana Espinosa
1, Hugo Uijtdebroeks
1, Jurgen Malbrancke
11
CRMGroup, Belgium ([email protected])
Abstract
In order to control the cracking behaviour and deformation of strip surface scale during
rolling a new innovative active actuator is being studied: “micro-dimples indentations”. The
principle is to induce with textured looper rolls micro-dimples in the strip scale just in front of
the roll bite influencing the onset of scale cracks. With the indentations a very fine controlled
cracking of scale is obtained in front of the roll bite limiting the metal extrusion through scale
cracks during deformation. Different dimple patterns have been studied with and without
lubrication. The best result is obtained with 10 µm diameter dimples combined with
lubrication, resulting in a controlled cracking of the scale and also an increase of 10% in
lubrication efficiency.
Keywords:
Scale, Micro-dimples, Hot rolling deformation, Scale cracking
1.
Introduction
One of the main concerns of hot strip rolling
mills is the occurrence of rolled-in-scale.
Even in high performance mills, this defect is
still observed on more than 15% of the coils
and about 0.1% of critical surface steels are
downgraded after pickling due to this defect.
During the last decades several studies
indicated that the rolled-in-scale defect is
linked to an inhomogeneous deformation of
the scale layer during rolling. Surface
stresses in the scale layer at the entry of the
roll bite induce a cracking of the scale layer.
In the rolling pass hot metal extrudes through
these cracks and capsules scale parts. The
severity of rolled-in-scale is related to the
friction in the roll bite (e.g. roll wear), the
reductions, the scale thickness and the
temperature. These rolling parameters are
however inherent to the rolling process to
obtain the required metallurgical properties.
The rolling conditions however can be
changed by different existing actuators
influencing the friction (e.g. lubrication) and
the scale properties (e.g. skin cooling,
interstand sprays). In order to control the
cracking behaviour and to create a cracking
network beneficial for the surface quality at
the end of the process, numerous hot rolling
trials with several configurations of existing
actuators have been performed at CRM. All
the actuators have a different effect on
cracking as visible in Figure 1.
Figure 1 Different crack networks formed by changing external actuators.
It has also been observed that the existence
of a fine crack pattern minimises extrusion at
the interface steel/scale, changes scale
adherence and reduces rolled-in scale defects
[1]. As the existing actuators have however
also a different main objective (e.g. skin
cooling to reduce the heat flux to the work
roll). By this, it is difficult to modify these
operating conditions in industrial mills. For
this reason new external actuators have been
studied at CRM (e.g. nitrogen rolling,
burning of oxygen in air). One of the most
promising actuators was the indentation of
micro-dimples in the scale layer just before
the rolling pass.
Many studies show that well-designed
dimples or grooves can drastically improve
tribological performance of sliding surfaces.
The micro-dimples can act as lubricant
reservoirs capable of feeding lubricant
directly into the contact and initiating micro
elasto-hydrodynamic lubrication. [2-6]
However, no previous studies exist how a
micro-dimple can influence the cracking
behaviour of scale layers when applying a
tension.
To perform this experimental study existing
micro-dimple patterns to enhance lubrication
have been applied.
3.
Inducing micro-dimples
For the hot rolling trials at CRM a pinch roll
has been designed with different patterns.
The objective is to induce the selected
patterns of dimples/grooves on the scale
layer before the roll bite during hot rolling.
To induce the dimples, the pinch roll has
peak texture, so it is possible to transfer to
the scale layer as dimples. At the roll bite
lubrication will be used, so that the dimples
work as lubricant reservoir during the rolling
reduction.
A pinch roll has been machined by laser
texturing with 6 different size and
distribution of peaks pattern. The selected
patterns are shown in Figure 2.
1 H: 20µm 2 H:10µm 3 H:10µm 4 H:10µm 5 H:5µm 6 H:5µm Figure 2 Micro-peak patterns, laser technique
4.
Experimental methods: Hot rolling
trials
The hot rolling line allows the continuous
rolling of a baby-coil with conditions very
close to hot rolling process. Furthermore it
provides the possibility to change parameters
in well controlled conditions. The decoiler
furnace is under inert atmosphere at slightly
higher pressure than atmospheric in order to
avoid oxidation during reheating. The
reheating temperature and the distance
between the decoiler and the stand are kept
constant during the trials. The strip is
deformed in the first stand and it is quenched
right after the exit of the gap so that the scale
evolution is frozen. See Figure 3.
Figure 3 Hot rolling pilot line in CRM Gent
In the trial the pinch roll was installed on the
looper roll, fixed to a structure and a
compression force was applied on the strip
by the piston of the looper, the pressure of
the piston was varied during the trial. Figure
4.
Figure 4 Pinch roll with peaks pattern.
and cooling, to analyse the surface offline
and to see the effect of the dimples on
deformation, scale cracking and interface
steel/scale behaviour. See Figure 5.
Figure 5 Hot rolling trials using pinch rolls to induce micro-dimples on the oxide layer
5.
Results and discussions
5.1
Surface analysis of pinch rolls after hot
rolling trials
The pinch roll was analysed after the hot
rolling trials to check the degradation of the
peaks after contact with strip at high
temperature 950°C. The peaks are intact for
almost all the patterns, only the pattern #5
and #6 (height 5µm) showed a slightly wear.
5.2
Rolling forces during hot rolling trials
The first surface observations indicated that
when lubrication is used, the transference of
the pattern is very clear. The lubrication goes
into the dimples, working as reservoirs [2],
and helps to keep the dimples printed on the
strip creating a layer of lubricant that is able
to protect them from deformation, Figure 5,
giving a smooth surface aspect and reducing
rolling forces up to 10%, see Figure 6. This is
especially visible on samples rolled at 50%
reduction.
Figure 6 Effect on strip surface when dimples and lubrication are used during hot rolling
Figure 7. 10% of force reduction when micro-dimple and lubrication are used.
5.3
Surface analysis of pattern on strip
material
The analyses of the samples under
microscope validate the first observations
during the trials. The strip surface rolled with
micro-dimples without lubrication shows an
arbitrary crack network with large and open
cracks. Some dimples are visible but
disappears during the rolling reduction. In the
other hand the surface rolled with
micro-dimples and lubrication clearly shows that
the crack network follows the dimples
pattern, no deep and large cracks are visible.
The pattern printed on the surface is visible
after the roll bite for all the 6 patterns when
lubrication is ON. In the Figure 7 the
cracking induced by pattern #6 is visible.
Figure 8 Surface after micro-dimples transfer to the strip and with Lubrication ON/OFF
At 50% of rolling reduction the use of
lubrication in combination with
micro-dimples showed an effect on the interface
scale/steel. The roughness at the interface is
much lower when lubrication is used. Low
extrusion of fresh metal and a homogenous
oxide layer is visible. Figure 8.
Figure 9. Cross section of samples after rolling at 50% reduction with and without lubrication – Pattern #2
6
Conclusions
The micro-peaks texture obtained by laser
ablation is symmetric along the surface of the
pinch rolls. The use of the pinch roll with
micro peaks printing micro dimples on the
strip reduces force up to 10% during
deformation in combination with lubrication
compared to lubrication without dimples
application.
The dimples are visible on strip after roll bite
when reduction is applied. This effect is
especially visible when lubrication is used.
The lubrication goes into the dimples,
working as reservoirs, and helps to keep the
dimples printed on the strip creating a layer
of lubricant that is able to protect them from
deformation giving a smooth surface aspect.
The best result is obtained with pattern #6, 10
µm diameter dimples combined with
lubrication, resulting in a controlled cracking
of the scale and also an increase of 10% in
lubrication efficiency.
The surface rolled at 50% with dimples and
lubrication is smoother and homogenous
along the length, the interface compared to
the surface rolled without lubrication which
is opaque and rough.
7
Acknowledgments
Grateful acknowledgements are made to the
CRM members: ArcelorMittal and TataSteel.
8
References
[1]M. Picard, C. Brunon, J.L Borean,
“Rolled-in scale indicator based on
description of scale physics under the roll
bite”. La Revue de Métallurgie - ATS – JSI
2007
[2]L.M. Vilhena, B. Podgornik, J. Vižintin, J.
Možina, “Influence of texturing parameters
and contact conditions on tribological
behaviour of laser textured surfaces”,
Meccanica (2011) 46, pp 567–575
[3]
S. Yuan, W. Huang, X. Wang,
“Orientation effects of micro-grooves on
sliding surfaces”, Tribology International,
Volume 44, Issue 9, August 2011, pp 1047–
1054
[4]
T. Matsumura, S. Takahashi, “Micro
dimple milling on cylinder surfaces”, Journal
of Manufacturing Processes 14 (2012), pp
135–140
[5]
X. Wang, W. Liu, F. Zhou, D. Zhu,
“Preliminary investigation of the effect of
dimple size on friction in line contacts”,
Tribology International 42 (2009), pp 1118–
1123
[6]
W. Huang, L. Jiang, Ch. Zhou, X.
Grain boundary oxidation of highly alloyed carbon steels at coiling temperature
L. Agrizzi Ronqueti1,3, M. Picard1, J.M. Mataigne2, J. Favergeon3, M. Risbet31 ArcelorMittal R&D Maizières Process; 2 ArcelorMittal R&D Maizières Automotive, 3 Université de Technologie de Compiègne
ABSTRACT
We studied the selective oxidation of alloying elements in steels in the temperature range of 530C to 700°C in oxygen lean atmospheres. The oxidation regime evolves from bulk oxidation (BO) at the higher temperature, to grain boundary oxidation for the lower ones (GBO). Basically, the GBO depth observed at low temperature can be described making use of the Wagner’s model when oxygen is the only diffusing element. Such a description allows estimating the value of the GB oxygen diffusion coefficient at that temperature.
Silicon diffusion evolves according to temperature: while negligible at 530°C, it happened in the GB only at 600°C, and in the bulk at higher temperature. The Manganese content of the Fe-Mn binary alloys was always high enough to promote Mn diffusion in all experiments. A Mn depletion zone was so always detected in the vicinity of oxidized GB.
GB oxidation was not homogeneous: oxidation preferentially occurred in high -angle grain boundary misorientations (higher than 15° misorientation).
INTRODUCTION
At the exit of the hot mill, coils cool down for several hours. During cooling, the metal surface inside wraps are no longer exposed to the atmosphere. However, the scale present on the steel surfaces acts as an oxygen reservoir and releases a tiny amount of oxygen into the metal. The local oxygen potential is sufficient to induce selective oxidation of the alloying elements notably carbon, silicon and manganese.
Except for carbon whose oxides are gaseous, the other alloying elements develop selective oxides inside the steel matrix, which may exhibit different shapes. One of them is grain boundary oxidation (GBO) which can be detrimental to fatigue resistance. So, it must be removed during pickling, which is currently one of the major complications to produce new highly alloyed steels.
The aim of this work was to increase the knowledge of internal selective oxidation (mainly GBO) in new steels with complex alloy compositions.
EXPERIMENTAL PROTOCOL
The experiments were carried out in a furnace with controlled temperatures ranging from 450 °C to 700 °C, and atmosphere being 95%N2 - 5%H2 with controlled moisture. The weight changes during oxidation tests were recorded, but not used for this analysis.
Two sets of steels were used in this research. The first set are iron based model alloys. The scale was removed to avoid any effect induced by the movement of the scale/steel interface. The alloying elements were limited to silicon and manganese (and some carbon) to avoid complex behaviors.
The second set consisted in an industrial steel (Dual Phase 600), whose scale was either removed (naked) either kept. The localization of oxides inside the samples was measured by using SEM/EDS, SIMS and NanoSIMS techniques.
Table 1 - Chemical compositions showing silicon, manganese and carbon contents [wt%] of the steels used in this study.
Si Mn C Fe
Fe-0.2%Si 0.209 0.010 0.013 Bal. Fe-0.5%Si 0.496 0.003 0.012 Bal. Fe-1.5%Si 1.55 0.001 0.002 Bal.
Fe-2%Mn 0.028 2.013 0.150 Bal.
Fe-5%Mn 0.036 5.069 0.153 Bal.
Fe- 0.4%Si- 1%Mn 0.398 1.07 0.320 Bal.
DP600 0.237 1.97 0.083
DECARBURIZATION IS DEEPER THAN OXIDATION ALONG GRAIN BOUNDARIES
During the thermogravimetric experiments, a mass loss was first recorded before observing the mass gain. This is due to decarburization occurring in parallel to grain boundary oxidation.
Figure 1 –Optical and SEM micrograph showing decarburization and grain boundary oxidation depths
DP600 at 700°C for 6 h and -5°C dew point.
For all studied samples, both decarburization and grain boundary oxidation occurred simultaneously. However, decarburization depths were always much deeper than grain boundary oxidation (Figure 1).
2
down after about 30 minutes. During that period, the dew point (red line) was modified by the CO evolution (H2O + CO -> H2 + CO2) before reaching its nominal value afterwards.
Figure 2 – CO emissions (blue line) and dew point (red line) during tests (700°C for 1 hour in N2-5%H2) DP600 no mill scale.
Cross section of this sample (etched with nital solution) showed a 200 µm depth decarburization layer while oxidation depth was only 15 µm. As most of the tests lasted more than six hours, the disturbance induced by decarburization remained negligible.
SCALE IS THE OXYGEN SOURCE FOR INTERNAL OXIDATION
We performed tests with either naked samples or scaled ones. For the naked samples, the oxygen potential was imposed by the furnace atmosphere by controlling the moisture content. The PO2 was chosen to match the wüstite-iron equilibrium at the test temperature.
For the scaled samples the oxygen potential was set at wüstite-magnetite equilibrium over 570°C or at the wüstite- magnetite-hematite equilibrium below. This ensured that the furnace atmosphere remained neutral regarding the scale, inducing no unwanted oxidation nor reduction.
For both naked and scaled samples, the grain boundary oxidation depths were similar (Figure 3 at 530°C and Figure 4 at 600°C). This proves that the oxygen potentials at the metal surface was the same for both situations.
Figure 3 –same GBO for DP600 without scale (a) vs; with mill scale (b) for oxidation tests at 530°C
Figure 4 – Internal oxidation depths for DP600 naked samples (a) and with rolled scale (b) for tests at 600°C
MORPHOLOGY OF INTERNAL OXIDATION
According to Harrisons, diffusion inside poly crystal can be classified into three regimes depicted in figure 5.
Figure 5 - A, B, and C diffusion regimes in a polycrystal according to Harrisons [Har-1961].
Figure 6 – The internal oxidation depths increase with temperature. Samples studied: DP600 in the absence of mill scale
after oxidation tests during 6 h at 530, 600 and 700°C.
When oxidizing DP600 and Si model alloys, all the three patterns where found depending on the treatment temperature. At 530°C only scarce pure GBO was observed while both intra and inter granular oxidation occurred at 700°C.
3
Figure 7 – (a) Fe-0.2wt%Si, (b) Fe-0.5wt%Si and (c) Fe-1.5wt%Si, showing the decrease of the internal oxidation depth with an increase of the silicon content; 600°C 26 hours [Agr-2018a]
SILICON DIFFUSION
NanoSIMS analyses were carried out on cross sections in order to detect possible diffusion of silicon.
The results showed three different silicon diffusion behaviors at three coiling temperatures [Agr-2018a].
- At 530°C, no silicon depletion could be detected neither around neither along grain boundary (Figure 8).
- At 600°C, no Si depletion was detected in the bulk, but depletion of Si in the GB, just below the oxidation depth, was detected.
- At 630°C, a silicon depletion was detected in both along the GB and in the bulk near the grain boundary (Figure 10).
As no depletion of Si could be detected at 530°C, the Wagner’s formalism of pure internal oxidation was used to assess the value of the oxygen diffusion coefficient in the GB. The results give: Do in GB = 52±42 µm²/s [Agr-2018a]
Such a value is about 100 times greater than the oxygen bulk diffusion at the same temperature as assessed by Swisher and Turdogan [SWI-1967].
Figure 8 – NanoSIMS cartographies showing no evidence of Si depletion
Fe-0.2wt%Si oxidized at 530°C for 6 h [Agr-2018a].
Figure 9 – NanoSIMS cartographies showing Si depletion along GB
Fe-0.2wt%Si oxidized at 600°C for 6 h [Agr-2018a].
Figure 10 – NanoSIMS cartographies showing Si depletion along and around GB
Fe-0.2wt%Si oxidized at 630°C for 6 h [Agr-2018a].
MANGANESE DIFFUSION
For all the Fe-%Mn alloys studied here, manganese depletion was always observed in the bulk (figure 11). This is probably caused by the high level of the Mn content in all the Fe-Mn samples. Another effect that could play a role in Mn diffusion is the higher solubility product of MnO compared to SiO2, allowing some Mn to diffuse even within the oxidized zone.
Figure 11 – f Fe-5%Mn showing the strong enrichment of Mn and O inside the grain boundary and a Mn depletion around GB.
600°C, 26 hours dew point –5°C.
INFLUENCE OF MISORIENTATION ON GRAIN BOUNDARY OXIDATION
The influence of grain boundary misorientation on GBO was proved by correlating SIMS and EBSD results. Low-angle grain misorientations (< 15°) were almost immune to GBO whereas high-angle grain misorientations (> 15°) usually exhibited GBO [Agr-2018b].
4
Figure 12 –EBSD (left) and SIMS (right) results. GBO is present for high misorientation-angle ( > 15°) while low misorientation
angle (< 15°) seems to be free of GBO.
Fe-0.2wt%Si, at 600°C, 6 h and DP = -5°C [Agr-2018b].
This can be explained mainly in terms of grain boundary energy. High-angle boundaries contain large areas of poor fit and have a relatively open structure [Meh-2007]. Moreover, the greater atoms disorder provides many gaps to facilitate the oxygen and/or alloying elements diffusion, thereby reducing the constraints on oxides precipitation.
GENERAL CONCLUSION
The main conclusions obtained throughout this PhD work are summarized below.
- An experimental setup to study selective oxidation in laboratory was developed well representative of industrial coil cooling.
- During oxidation tests, both decarburization and selective internal oxidation occurred, but decarburization only played a role for a short period of time and did not impair the development of GBO
- Scale acted as an oxygen source, sufficient to induce selec-tive internal oxidation.
- Grain boundary oxidation depths increased with temperature indicating conditions where the counter diffusion of the alloying element did not play a major role compared to in depth diffusion of oxygen. At 530 ° C, on Fe-Si binary alloys, no Si depletion was observed so that it was possible to assess the O GB diffusion coefficient at that temperature; its value was 100 times greater that its value in the bulk; for higher temperatures, nano-sims results revealed the existence of Si depletion
- For Fe-Mn alloys, manganese depletion zones were always observed, probably because of the high Mn content of these samples.
- Grain boundary misorientations play has an important role on GBO development. High-angle grain misorientations (>15°) are preferential oxides precipitation sites. On the contrary, a low-angle grain misorientations (<15°) were found almost free of GBO.
The knowledge developed in this work will help to mitigate the consequences of the selective internal oxidation (mainly GBO) in the production of the new steels with complex alloy compositions.
REFERENCES
[Agr-2018a] Agrizzi-Ronqueti, L., Favergeon, J., Risbet, M., Picard, M., & Mataigne, J.M. (2018). Silicon internal selective oxidation of Fe-x%Si model alloys at high temperatures - Effect of Si content and temperature. Submitted in Oxidation of Metals [Agr-2018b] Agrizzi-Ronqueti, L., Risbet, M., Favergeon, J., Picard, M., Mataigne, J.M. (2018). Effect of grain boundary misorientations on the Si and Mn selective grain boudary oxidation in a -ferrite matrix. Submitted in Oxidation of Metals
[Hui-2005] Huin, D., Flauder, P., & Leblond, J. B. (2005). Numerical simulation of internal oxidation of steels during annealing treatments. Oxidation of metals, 64(1), 131-167. [HuiA-2016] Huin, D., Bertrand, F., (2016). An available tool to
evaluate selective oxidation phenomena: OMEGA - Oxidation Modeling in finite Elements for Galvanizing Annealing lines. ArcelorMittal Global R&D Ref: 2016 23936 RDMA.
[HuiB-2016] Huin, D., Huin, T., (2016). First simulations of
inter-granular oxidation using OMEGA (selective oxidation model in Sysweld environment). ArcelorMittal Global R&D Ref: 2016 24028 RDMA.
[Liu-2011] Liu, H., He, Y., Swaminathan, S., Rohwerder, M., & Li, L. (2011). Effect of dew point on the surface selective oxidation and subsurface microstructure of TRIP-aided steel. Surface and Coatings Technology, 206(6), 1237-1243.
[Meh-2007] Mehrer, H. (2007). Diffusion in solids: fundamentals, methods, materials, diffusion-controlled processes (Vol. 155). Springer Science & Business Media.
[Swi-1967] Swisher, J.H. Turkdogan E.T. (1967) Solubility, permeability and diffusivity of oxygen in solid iron. AIME MET SOC TRANS, 239(4), pp 426-431
[Tan-2013] Tang, B., Jiang, L., Hu, R., & Li, Q. (2013). Correlation between grain boundary misorientation and M 23 C 6 precipitation behaviors in a wrought Ni-based superalloy. Materials Characterization, 78, 144-150.
Influence of the oxide layer on the spray cooling intensity
M. Chabicovsky, O. Resl, M. Raudensky
Brno University of Technology, Heat Transfer and Fluid Flow Laboratory, Brno, Czech Republic
Abstract
Formation of oxide layers on the surface is inherent part of the steel production. The oxide layer primarily affects the surface quality and material losses during the steel processing. The influence of the oxide layer on the cooling intensity is not frequently reported but even thin layers of oxides can significantly modify the cooling intensity. The oxide layer factor is not as important as the water flow rate but it should be also considered for optimal regulation of the cooling process. The influence of the oxide layer on the heat transfer coefficient and Leidenfrost temperature is investigated in this paper. Laboratory measurement compares the spray cooling of oxide-free steel surface and oxidized steel surface. It shows significant change of the Leidenfrost temperature and heat transfer coefficient due to the oxide layer.
Keywords: Scale, oxide layer, heat transfer coefficient, spray cooling, Leidenfrost temperature
INTRODUCTION
Water spray cooling is a common cooling method used in many high temperature industrial applications, such as metal processing or electronics cooling. Continuous casting and hot rolling of the steel includes the formation of oxides on the surface. These oxides form a porous layer. The oxide layer has a very low thermal conductivity compared to the steel and acts as a thermal barrier. This thermal barrier lowers the heat flux from the metal surface to the surroundings when the air cools it. The use of the water can cause a shift of the Leidenfrost temperature and intensify the cooling for a short time period [1]. The oxide layer also affects the cooled surface roughness, which is another factor influencing cooling [2].
The heat transfer coefficient and the Leidenfrost temperature (temperature at which the minimum heat flux occurs) are mainly influenced by the water impingement (spray) density and by the surface temperature [2]. The influence of the oxide layer is not as significant as previous factors, but it should not be neglected in models for better temperature control.
HEAT TRANSFER COEFFICIENT MEASUREMENT
Four test samples with dimensions 155x60x25 mm were prepared from the spring steel 54SiCr6 (1.7102).
Two holes for thermocouples (diameter 1.5 mm, type K) were drilled from the top side in the positions [-30,0] (position T1) and [30, 0] (position T2) to each sample. The position [0, 0] is in the centre of the sample
(Figure 1).
The test bench is shown in Figure 2. It consists of an electric furnace, covering sheet, hot test sample, moveable mechanism with nozzle and nozzle’s deflector. The flat jet nozzle (SS.CO 8006) with spray angle 80° was positioned 300 mm under the test sample. The water pressure was set at 2 bars during the experiment and measured flow rate was 0.0317 l/s.
Figure 2 Test bench
Two samples (A and B) were oxidized in an electric furnace and two samples (C and D) were remained clean (without oxides). Sample A and B were oxidized ata temperature of 900 °C for 60 minutes. Holes for thermocouples were cleaned (the formed oxides were removed) and shielded grounded thermocouples were positioned 2 mm from the bottom (spray cooled) surface before the measurement. Each sample was isolated from the top side and was heated in an electric furnace at a temperature 760 °C in a protective nitrogen atmosphere (avoiding of the oxidation). Then, the sample was removed from the furnace and it was positioned on the test bench. The deflector was opened, and the cooling started.
Samples A (oxidized) and C (clean) were cooled by static nozzle (the centre of the nozzle was positioned under centre of the test sample and samples B (oxidized) and D (clean) were cooled by moveable nozzle. The nozzle passes under the test sample with the velocity 4 m/min. The deflector was opened (the sample was cooled by spray) in one direction and the deflector was closed (no spray cooling) in backwards direction. The oxide layer was unchanged (undestroyed) during the spray cooling. Samples were cut after the experiment and the oxide layer was observed in positions of thermocouples on the optical microscope (Figure 3). The thickness of the oxide layer on the samples A and B was approx. 100 μm with deviation approx. 20 μm.
Figure 3 Example of the oxide layer formed on the sample A – position T1
90 μm
120 μm
steel
oxide
fixing glue
RESULTS
The inverse heat conduction problem was used to compute the time dependent boundary conditions (heat transfer coefficient (HTC), heat flux, and surface temperature from measured temperatures. Beck’s sequential approach, which uses a sequential estimation of the time varying boundary conditions and future time steps, was employed. The dependence of the HTC on the surface temperature was directly obtained from the inverse calculation for static experiments. This dependence is obtained by averaging along the position (interval 10 mm around the thermocouple position) for the measurements with moveable nozzle. Comparison of measured temperatures in thermocouple position T1 is shown in Figure 4
Figure 3
.Figure 4 Comparison of measured temperatures for clean surface and oxidized surface in thermocouple position T1 (solid line – moveable nozzle, dashed – static nozzle)
The comparison of heat transfer coefficients (dependent on the surface temperature) for oxidized samples and clean samples are in Figure 5 (static nozzle) and in Figure 6 (moveable nozzle). It is evident, the Leidenfrost temperature for clean surfaces is lower than for oxidized surfaces. It is around 600 °C for clean surface and 540 °C for oxidized sample for tests with static nozzle. The difference between clean and oxidized sample is significantly higher in a case of moveable nozzle. The Leidenfrost temperature is 450 °C for the clean surface and around 600°C for oxidized surface. The heat transfer coefficient is slightly higher for clean surfaces for high surface temperatures (higher than 600 °C) and it is in average higher for clean surfaces for low surface temperatures (lower than 300 °C).
Figure 6 Comparison of clean surface and oxidized surface for moveable nozzle (solid line – oxidized surface, dashed line– clean surface)
CONCLUSION
Laboratory measurements showed influence of the oxide layer on the heat transfer coefficient and especially on the Leidenfrost temperature. The presence of the oxide layer shifts the Leidenfrost temperature to higher values and slightly decreases the heat transfer coefficient during film and nucleate boiling regime. The influence of the oxide layer on the shift of the Leidenfrost temperature is significantly higher for moveable nozzle than for static nozzle.
ACKNOWLEDGEMENT
The research leading to these results received funding from the MEYS under the National Sustainability Programme I (Project LO1202) and from an internal grant from the Brno University of Technology focused on specific research and development No. FSI-S-17-4346.
REFERENCES
[1] CHABICOVSKY, M., HNIZDIL, M., TSENG, A.A., RAUDENSKY, M. Effects of oxide layer on Leidenfrost temperature during spray cooling of steel at high temperatures. Int. Journal of Heat and Mass Transfer, 2015, vol. 88, pp. 236-246.
Through Process Scale; Influence and Control
John Hinton
1, aand Ian Robinson
1, b1Primetals Technologies Ltd. Sheffield Business Park, Sheffield S9 1XU, UK
a
[email protected],[email protected]
Abstract
Whenever hot steel is exposed to oxygen-bearing gases it reacts to form a surface oxide (scale). During steel production, the development of the scale layer extends from the reheat furnace through to the cooling bed. This can have a direct influence, for example the final surface quality or the work roll friction or an indirect effect such as variations in recording real time temperature measurements. During processing, the dynamic environment creates transient conditions i.e. the plate surface evolves through complex cycles of oxide scale growth, deformation and removal. Steel producers aim to achieve process consistency and a reproducible final surface quality. The realisation of this requires an appreciation of a number of complex through process variables on a microscopic and macroscopic level, including the scale interface metallurgy and the descaling system set up. This paper summarises the challenges associated with these aims.
Keywords:Through Process, Scale Morphology, Metallurgy, Descaling System Parameters
1. Introduction
Although significant progress has been made in steel plate process technology, the occurrence of surface defects in the final rolled product cannot be excluded. Through process detection and identification of defects is challenging and this is before the subjective visual interpretation of the final surface quality is considered. The acceptability of a surface quality depends on the downstream processing and may be defined by a specification. End use steel plate applications have traditionally allowed the intermediate surface quality to be less than critical. State-of-the-art Plate Mill installations now deliver accurate geometric tolerances and process consistency. Recent market forces have challenged steel plate producers to achieve good uniform surface finishes prior to downstream processing.
2. Through Process Scale
The secondary processing of plate steel requires slabs to be reheated to temperatures above 1100°C before being rolled into a semi-finished product. The exposure to oxygen bearing gases at high temperatures causes a surface reaction leading to the build-up of oxide scale over time. On discharge from the reheat furnace (RHF), the slab is transferred from a relatively stable environment, to a transient, locally inhomogeneous one as the slab is hydraulically and mechanically descaled and re-oxidised during rolling.
Plate steel compositions normally include small silicon and nickel additions (a fraction of a percent) that can lead to generous improvements in toughness and strength. It is well-known that these elements also have detrimental effect on the surface quality; decreasing the descalability (the ease with which the scale can be removed during descaling) and potentially leading to striping on the final plate surface [1 – 3]. The through process nature of descaling is highlighted by the fact that the occurrence of black and red stripes has been associated to poor descaling efficiency of primary oxides [1]. Fig. 1a compares top surface of two slabs exiting a Primary Descaler on a plate mill. For a similar high pressure water (HPW) descaling set up, the descaling performance on the second slab is not as efficient. One of the key differences was found to be in the composition, with the second slab containing a larger, but still relatively small amount, of nickel. Since nickel has a lower oxygen affinity than iron, nickel-rich nodules increase the entanglement between the scale and steel, enhancing the surface roughness of the interface and thus making complete removal of the primary scale more difficult [3].
dynamic and transient surface conditions which result in the final plate surface. Other processing effects that create surface temperature inhomogeneity, that will influence the local conditions for scale growth, become more apparent downstream. These include RHF skid marks and roller table oscillation marks. An example is shown in Fig. 1b, taken from the entry and exit scanning pyrometers on the Primetals’ MULPIC® plate cooling machine. On entry deviations in the surface temperature are recorded, which become more apparent on exit after cooling. This example, with two identifiable cooler areas (white boxes), is most likely to be skid marks from the RHF. Determination of the final plate temperature is important for developing the structure properties of the plate and for validation, feedback and tuning of the cooling models. A scaled surface influences the temperature feedback and Primetals Technologies Ltd. has developed several analysis techniques to address this.
Figure 1 a) Comparison of primary descaling performance; illustration of composition effects and b) plate cooling; the downstream influence of scale through the process [4].
3. High Pressure Water (HPW) Descaling
HPW descaling can be described as the process of removing oxide scale by spraying the passing hot steel surface with moderate to high pressure water from stationary flat jet nozzles or rotary systems [5]. The aim is to remove loose to sticky primary, secondary and tertiary scale using the optimum setup of the descaling system. The goal to achieve excellent and uniform surface finish on the cooling bed relies on the consideration and integration of the following key areas:
1) Descaling Setup
· Process optimisation through header geometry (design of spray angle, pitch, stand-off etc.) and usage within the limits of the hydraulic system.
2) Metallurgy
· Appreciation of the influence of composition and atmosphere on the scale morphology, particularly at the interface of the scale and the slab. This directly impacts local dynamic conditions for secondary/tertiary growth layer during processing.
3) Evolution
· Through process interaction between the descaling strategy and rolling schedule on the local dynamic conditions for secondary/tertiary growth.
4) Characterisation
· Understanding the influence of the descaling strategy on the final plate surface quality through determination of acceptable quality control standards.
It is generally accepted that HPW descalability is linked to four concepts [5]. These are summarised in Table 1. Each concept is briefly described and linked to geometry, system or process variables. Results of extensive laboratory tests [6] demonstrated that both Specific Impingement Rate (SIR; how much water) and Impact Pressure (IP; how hard the water contacts the surface) are key to ensure efficient descaling.
0.01 wt. % Ni
0.15 wt. % Ni Exit
Entry
Over a range of conditions, comparing SIR and IP with descaling efficiency, will identify limits above which descaling performance will be acceptable. The descaling limits are different for different steel grades and also depend on the RHF conditions and furnace atmosphere i.e. the influence of scale metallurgy at the interface on the adherence, ‘stickiness’ and descalability of a product.
Since both SIR and IP are important, further assessment proposed that this combination was best defined by Descaling Energy (DE), a product of SIR and IP [7]. This concept proposes that a limiting level of DE should be exceeded to ensure efficient removal of the scale layer. Given the complex scale metallurgy at the interface, this seems reasonable. Therefore providing that the chosen DE is exceeded, any combination of SIR and IP may be used. As described in section 2, composition influences descalability and can be used as an input to define a required DE. Previous work has suggested that for a base CMn grade, a DE of approx. 20kJ/m2 should be targeted. Conversely, to descale high alloyed grades
that include small be significant levels of Si and Ni then a DE 2 to 2.5 times greater should be targeted [5, 7].
Table 1 HPW Descaling Concepts
4 Descaling Energy basis for a Primary Descaling Process Window
As the basis for a Primary Descaling upgrade, a steel producer might specify a target static IP for a new Primary Descaler, achieved by the right combination of header geometry and hydraulic system parameters. HPW descaling concepts can be used to assess this static IP requirement in terms of the expected dynamic descaling performance. Water usage considerations have seen a demand to increase the IP whilst maintaining the consumption. This has generally seen system pressures increase to around 250bar whilst the header stand-off has generally decreased towards 100mm.
As shown in Table 1, the slab speed is an important process parameter in dynamic descaling. The DE concept can be used to estimate a performance range for a given header setup by considering a variety of descaling speeds. An example is shown in Fig. 2a, where for a given static IP, a reduction in the slab speed increases the SIR and therefore increases the DE. At very slow slab speeds, the dashed line in Fig. 2a indicates the conditions under which surface saturation should be considered i.e. the point at which a further speed reduction does not realise an increase in DE. In this example, surface saturation has been assumed when the SIR is > 40l/m2 [5]. During production descaling speeds are typically between 0.50 to
1.50m/s but saturation is a consideration where the header water consumption is large.
As described in section 3, the DE concept may be used to define a limit level to efficiently descale certain grades or classes of steels. For example in Fig. 2a, if a minimum DE of 40kJ/m2 is required for
steels containing > 0.5wt. % Si + Ni, then the maximum speed through the Primary Descaler is approx. 1.0m/s. Equally, for lower alloy compositions, more typical of base CMn steel grades, a lower DE may be acceptable. In this scenario, the slab speed may be increased or, preferably, the header pressure decreased to reduce the SIR and IP. This option could also potentially offer energy savings by using the descaling system more efficiently. Using Fig. 2a as a basis, a more comprehensive assessment can be completed for different descaling speeds and header pressures. This enables a Primary Descaling Process Window to be defined. An example is shown in Fig. 2b. The limits of the window are given as follows:
· A min. DE of 20kJ/m2; i.e. that required for low CMn grades.
· A descaling speed that ranges from 0.50 to 1.50 m/s.
Figure 2 a) For a given IP, the estimated DE range for a variety of slab speeds and b) Process Window for Primary Descaling, targeting a min. DE of 20kJ/m2, and descaling speed ranging from 0.50 and 1.50m/s.
In Fig. 2b, DEs achieved at constant intermediate descaling speeds for a range of header pressure are indicated by the dashed lines. The two shaded areas show example DE target ranges for standard and more difficult to descale grades. For comparison the red outline is the estimated Process Window for a current Primary Descaler. This shows that the proposed system pressure upgrade and new header geometry combine to deliver a large Primary Descaling Process Window that offers a wide range of DEs. For future grade development, this proposal also has the capacity to increase the DE further, to > 50kJ/m2 when a
high header pressure and slow descaling speed are selected.
Fig. 2b also suggests a possible Primary Descaling strategy to reduce energy consumption. Using a constant descaling speed, the header pressure can be adjusted to establish the required DE to achieve efficient descaling. This will develop steel grade groupings (based on composition) that can be used in the future set up of the Primary Descaler, thereby only requesting as much pressure as required. This optimises the energy consumption of the Descaling System. For this proposal, Fig. 2b suggests that a descaling speed around 0.75 to 1.0m/s offers a good range of DE, but also spare capacity where greater DE can be achieve if the speed is reduced further.
5. Conclusions
Final plate surface quality is inherently linked to the local environmental conditions during processing; controlled by temperature, composition and setup of the complete mill descaling system, with through process effects visible. Standalone Primary Descaling has the potential to offer process optimisation by selecting appropriate setup parameters based on the steel composition and RHF practice.
6. References
[1] T. Fukagawa, H. Okada and Y. Maehara; Mechanism of Red Scale Defect Formation in Si-added Hot Rolled Steel Sheets, ISIJ International 34(1994) no. 11 p906.
[2] T. Asai, T. Soshiroda and M. Miyahara; Influence of Ni Impurity in Steel on the Removability of Primary Scale in Hydraulic Descaling, ISIJ International 37(1997) no. 3 p272.
[3] W. Melfo et al.; Experimental Study on Primary Scale Formation and Descalability on Steels containing Ni and Ni + Si, ISIJ International, 53(2013), No. 5 p866.
[4] J. Hinton, I. Robinson and M. Clark; Scale Formation During Reheat and Descaler Practices; European Oxide Scale Conference 2014 (Oxi 2014), 12th – 13th Feb, IOM3, London.
[5] D. Farrugia et al.; Innovative High Temperature and Mechanical Descaling for long products (HIDES), RFCS Project Reference No. RFSR-CT-2009-00009 (2009-2012).
[6] A.T. Sheridan and P. Simon; Descaling of Steels in Rolling Mills, Proc. Of the Forum on European Steelmaking Developments and Perspectives, p233, Luxembourg, February 1995.
[7] N.J. Silk; The Impact Energy Concept for Primary Descaling, Steel Times, 1999 No. 5, p184.
0.50 m/s
0.75 m/s 1.00 m/s 1.50 m/s Difficult grades
DE 40 to 50 kJ/m2
New trends and developments in linear high pressure descaling
Jochen Munz
Co-author: Jürgen Frick
Lechler GmbH
Abstract
During the process of hot rolling of steel, descaling has a decisive influence to the final product and surface quality. New steel grades, higher quality standards and demand-adapted descaling require more detailed investigations on the nozzle installation parameters.
The overlap area of two adjacent nozzle sprays is considered as one of the most important factors for a uniform descaling result over the entire strip or slab width. Enabled by the new Lechler High Pressure Spray Lab it’s now possible to investigate the effects in the overlap area more accurately than ever before. An offset angle of 15° has been established almost as an industrial standard during the last decades. This paper focuses on different settings for the offset angle and shows different testing methods for evaluation. An impact measurement with embedded sensor is a fundamental tool and basis for all further steps to elaborate the most effective and efficient nozzle arrangement for the specific boundary conditions.
Innovative approaches could initiate the future direction leading to a modern descaling concept.
Keywords
Descaling, hot rolling, nozzle arrangement, overlap area, offset angle
Introduction
Modern hot rolling mills have to be extremely flexible regarding a wide range of different steel grades, product geometries and rolling speeds. Hence, descaling must be adaptable to fulfill all requirements and ideally to be most efficient at the same.
A well-adjusted descaling is essential for all subsequent process steps in the production chain of rolled steel products. In order to find appropriate installation parameters, it's indispensable to examine the specific situation in detail by initially defining the required main parameters, such as the desired impact pressure and specific water impingement. Additionally the impact distribution over the entire product width is also crucial for a good and uniform descaling result. Especially the overlap area of two adjacent nozzle sprays has to be carefully investigated at the designated operation conditions in order to elaborate the most suitable solution.
Investigation methods
surface. The measurement parameters, or variables, such as the water pressure, spray height, nozzle pitch (nozzle spacing), inclination (lead) and offset (twist) angle can be freely set (see figure 2). This method enables realistic measurements of the impact distribution, especially in the important overlap area (see figure 3 and 4), because the water layer on the plate surface is formed like on a strip or slab surface in a rolling mill. These investigations can be carried out on the Lechler High Pressure Spray Lab prior to the detailed engineering of the industrial system and are very helpful to determine the nozzle setting.
Figure 1: Lechler High Pressure Spray Lab Figure 2: nozzle adjustment
Figure 3: Plate with embedded sensor Figure 4: impact measurement protocol
A more common method of investigating the descaling effectiveness, especially the interference of two adjacent nozzle sprays is the Aluminum erosion test (see figure 5). The nozzles are spraying onto the flat surface of an Aluminum plate for a certain amount of time. The crater eroded into the surface by the sprays can be investigated optically and by the weight loss.
First results
Below the inclination (lead) angle is maintained 15° against the moving (rolling) direction of the product.
A typical nozzle arrangement at a spray height of 120 mm, a water pressure of 250 bar and a nozzle offset angle of 15° results in an impact distribution as shown in figure 4. Using these parameters the new measurement method reveals an impact ditch in the overlap area. This phenomena can be described as the well-known “wash-out effect” in this zone which is indicated in figure 6.
In order to verify this result by an additional method, an Aluminum erosion test at the identical conditions has been performed and with a similar result as shown in figure 5. Also here a clear band with almost no erosion can be observed at the wash-out area.
Figure 5: erosion test Figure 6: sketch of two adjacent sprays
Having these observations in mind, the new logic approach was to repeat these tests at identical conditions except for the offset angle. The offset angle was modified from 15° to 5° with the intention to reduce the width of the wash-out area. The corresponding measurement is shown in figure 7 and proofs that this reduction of the offset angle helps to reduce both, the depth and the width of the impact ditch. Also the erosion test presents the advantageous behavior when applying smaller offset angles (see figure 8).
Besides the offset angle also the size of the overlap influences the impact distribution in the overlap and wash-out area. Theoretical studies supported by impact measurements show a smaller and narrower ditch while increasing the overlapping.
In reality the increase in overlap has to be carefully balanced as there are also good reasons for limiting the overlap. One is that at an excessive overlap could lead to an overcooling of the surface in this area. Depending on steel grade and product thickness, an overcooling could be a potential cause for striping. Another reason is that using excessive overlap requires more total water flow to cover the entire product width as the overlap is creating a double spray. As this has consequences for the sizing of the pump and eventually for the energy consumption, all aspects must be considered for finding the best compromise. On the other hand, an overlap being too short will result in un-descaled stripes on the surface. A reasonable safety margin should also be considered in case of wavy strips or uneven slabs so that enough spray height providing sufficient overlap is always secured.
Summary and outlook
The combination of offset and inclination angle, overlap, single nozzle impact distribution and the specific operation conditions (spray height, water pressure, etc.) are important parameters for an even overall impact distribution.
In reality the best possible compromise has to be determined.
Maximizing Impact Force from Descale Headers using CFD Analysis
Lesli Peterson1 1Spraying Systems Co.
PO Box 7900 Wheaton, IL, USA, 60187 Phone: 630-517-1380
Email: [email protected]
Keywords: descale, impact, oxidation, CFD, spray nozzle
INTRODUCTION
Descaling is an important step in the rolling process. Oxide is removed from the surface of the product to improve surface quality and maintain the rolls. Nozzle selection and header design are important parts of an effective descaling system. The nozzles need to be sized and placed so they provide sufficient impact force to remove the oxide with minimal amount of water possible. Headers need to be sized to maximize the impact performance of the nozzles. Impact testing along with CFD (Computational Fluid Dynamics) analysis can help to determine if a header has been properly designed to provide maximum impact force. CFD analysis can determine the fluid approach velocity along with the turbulence level in the header. The spray pattern of the nozzle can then be measured for impact force and distribution under different approach velocities and turbulence levels. Comparing these to a nozzle tested under an ideal no turbulence condition can determine minimum header size requirements based on nozzle capacity and pressure. Optimizing the header can help to improve performance and minimize energy costs.
DISCUSSION
Background
Hot strip mills use high pressure hydraulic nozzles in the descaling process to remove scale from the steel surface. It is important to remove the scale to prevent defects in the material and to increase the life of the rolls. Scale is formed by a direct reaction of metal with oxygen, water and other elements. The type of scale formed will depend on a number of factors including base material, temperature, time in the furnace and type of furnace. In theory the spray cools the outer scale layer causing a temperature difference between the base material and the scale. This causes the scale to create cracks and allow the spray to penetrate through the scale. The water then turns to steam and helps to lift the scale from the base material. Lastly the sprays push the loose scale off of the surface of the steel.
The impact of the nozzles is determined based on the type of scale being removed and the amount of force needed to remove the scale. The maximum impact force can be determined by calculating the reaction force for the nozzle, Eq. 1. The reaction force is then divided by the area of the spray to determine the impact force, Eq. 2.
(1)
Total Impact Force
Density
Q= Flow Rate
V= Velocity
(2)
Im = Impact Force
w = Spray width
t = Spray Thickness
Testing
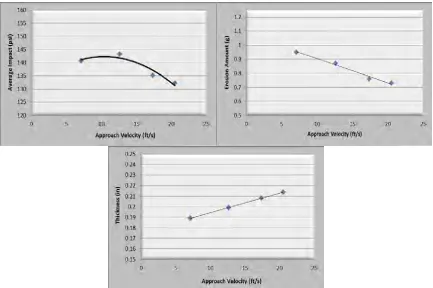
The previous equations are theoretical only. Experimental testing has been used to determine how the nozzles function in more realistic conditions. Turbulence levels have been divided into three categories and as the approach velocity increases the impact and spray pattern become compromised. Based on experimental testing we know both impact and spray pattern are
compromised when the approach velocity meets or exceeds the severe level. As figure 2 shows the pattern shifts from a straight uniform spray to a curved spray and eventually takes on an “S” shape as the approach velocity increases.
Turbulence Level Approach Velocity
Low Less than 5 ft/s or 1.5 m/s
Moderate 5-15 ft/s or 1.5 to 4.6 m/s
Severe Greater than 15 ft/s or 4.6 m/s
Table 1. Turbulence level categories
Figure 2. Spray pattern shape based on turbulence category
Impact testing, where a load cell is moved under the spray in a grid pattern to collect force data, has been used to determine the average impact at various approach velocities. Approach velocities are varied in the header using a set-up similar to figure 3.
QV
F
T=
r
=
T
F
=
r
)
*
/(
w
t
F
Figure 3. Header manifold for experimental testing
The control nozzle is closest to the inlet and is kept constant while the nozzle furthest from the inlet is varied. The effect is increasing or decreasing the approach velocity through the control nozzle. In the low to moderate range the average impact is relatively flat. As the approach velocity approaches the severe level the average impact begins to drop off significantly.
Figure 4. Results of impact and erosion testing
Figure 5. Erosion test set-up
By doing erosion testing at different approach velocities we noticed a reduction in the amount of material removed and an increase in the thickness as the approach velocity increased. In addition the uniformity of the pattern began to change. At the lower approach velocities the pattern was straight and uniform. As the approach velocity increased the pattern began to take on a more “S” shaped or curved pattern.
Figure 6. Spray pattern as seen on aluminum plates at various approach velocities
Results
Impact and erosion testing has determined the limits the spray nozzles can handle. CFD analysis can then be used to analyze the header based on the performance limits determined during experimental testing. The following examines three cases. Case 1 is the current mill condition and cases 2 and 3 are two ways of optimizing the header design based on CFD results from case 1. All three cases are based on the same header design in figure 7 using 14 nozzles and an end feed.
Pressure Total Flow Header Size
psi gpm
Case 1 2300 743.1 4” sch. 160
Case 2 2300 530.8 4” sch. 160
Case 3 2300 743.1 6” sch. 160
Figure 7. Header schematic showing the location of the inlet and number of nozzles
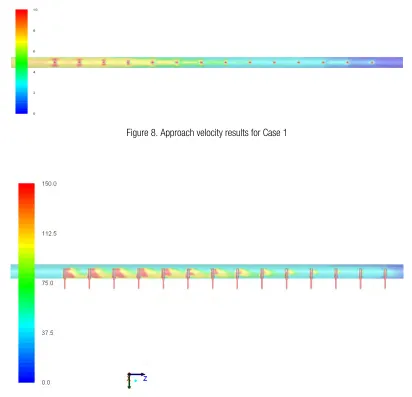
The results from case 1 show velocities on the inlet side of the header in the severe to moderate range. In total six nozzles have approach velocities in the severe range. It would be expected to see spray patterns that have an “S” or curved shape. These non-uniform patterns were observed when board tests were done. Patterns for nozzles further from the inlet were more straight and uniform. This causes uneven descaling on the product surface and is not desired. As the flow moves away from the header inlet the turbulence and the approach velocities are reduced. The turbulence levels on the inlet side of the header are also on the high side and decrease in value further from the inlet of the header. In this case the highest level of turbulence is seen in nozzle #3.
Figure 8. Approach velocity results for Case 1
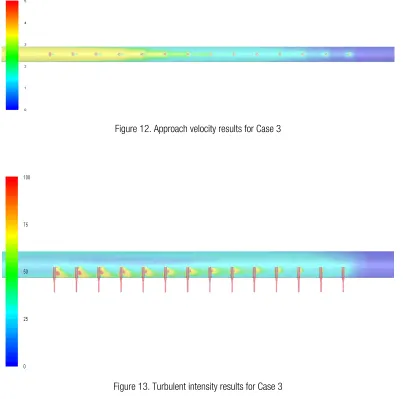
Using CFD two additional options were examined. Case 2 used the same size header but reduced the flow rate by 28%. Case 3 kept the flow rate the same but increase the header size from a 4” sch 160 pipe to a 6” sch 160 pipe.
In case 2 the first two nozzles of the header had approach velocities above the severe level but the turbulence levels were drastically reduced. The number of nozzles above the severe level was reduced by 4 nozzles from case 1. The turbulence intensity was also reduced indicating a smoother approach to each individual nozzle. Case 2 would be the recommended maximum flow for this pipe size and inlet configuration and while the flow rate has been reduced the impact level would be expected to be near the same level as in case 1 because of the lower turbulence level. A change to this option would be a minimal investment for the mill as only a nozzle change is required.
Figure 10. Approach velocity results for Case 2
Figure 11. Turbulent intensity results for Case 2
Figure 1