Experiment and Simulation of Ferrous Ions Diffusion at the Dead-end
Branch Pipes of Water Distribution System
Jinliang Gao1, Shiyuan Hu2, Wenyan Wu3, Yuanzhe Li4, Cai Jian5, Jiaxu Li6, Jianwei Ding7,
Ming Cui8, Shuhe Zou9
1,2,4,5,6Harbin Institute of Technology, Harbin Institute of Technology, Harbin, Heilongjiang, P.R. China 3School of Engineering and the Built Environment, Birmingham City University, Birmingham, UK
7,8Ji Xi Chenergy Water Co. Ltd., Jixi, Heilongjiang, P.R. China.
9Harbin GONGDA water & waste water technology Co. Ltd., Harbin, Heilongjiang, P.R. China.
ABSTRACT
With increasing urban development, improving the water quality has becoming a major challenge. The deterioration of drinking water quality is usually caused by long-distance water delivery and secondary water supply, as chlorinated water reaches standard. In order to improve the water quality, studying the change of water quality in the water distribution network (WDN) is essential. Besides water deteriorates during the flow, the stagnant water in the dead-end branch pipes also diffuses contaminant into the main pipes.
This paper considered the ferrous ions, which accumulated at the dead-end branch pipes of WDN, as pollution sources, and studied the concentration of ferrous ions in the main pipes caused by the ferrous ions in dead-end branch pipes using numerical simulation analysis. Results indicated that the correlation between the concentration of ferrous ions in the main pipes and the length of the dead-end branch pipes, the concentration of ferrous ions in the dead-dead-end branch pipes, the flow velocity of the main pipes, the diameter of the main pipes as well as the diameter of the dead-end branch pipes. The experiment was conducted to verify the numerical model. In addition, the correlation has been used to improve the water quality model of EPANET software and was applied in an actual WDN to evaluate the differences. The results shown that the improved software has resulted in good performance.
Keywords: water quality model; dead-end branch pipes pollution; ferrous ions diffusion
1
Background
Water distribution network (WDN) is an essential part of the infrastructure. These networks are pivotal for public health [1]. However, dead-end branch pipes of WDN are known as problematic zones in terms of water quality degradation. Dead-end branch pipes are usually used for firefighting in WDN. The water in it remains stagnant for a long time, unless it is flushed regularly as required. In stagnation conditions, corrosion potential will notably decrease at first, and it would decline more slowly with time, which would means the iron release and the bacterial growth increases [2,3,4]. It is easier for iron to accumulating in the dead-end branch pipes. The concentration of iron in dead-end
progenitor cells as well as the microenvironment for hematopoiesis. If iron overload is left untreated, it may lead to hemochromatosis, which damages different organs of the body [8]. Bad odor, unpleasant taste, red color of water and stains on laundry and plumbing fixtures are also some of the issues related with high iron content in water. Therefore, it is very important to investigate the diffused ferrous ions caused by the ferrous ions accumulating in the dead-end branch pipe.
2
Methods
Diffusion model in dead-end branch pipes can be achieved by using experiments or via the utilization of Computational Dynamics (CFD) techniques. CFD can provide significant cost benefits for assessing and optimizing engineering design solutions related to environmental concerns and appear attractive as a potential alternative tool.
In this paper, the computational fluid dynamics software COMSOL was used to simulate the diffusion of the dead-end branch pipes. We used 2D models to build the geometry of the dead-end branch pipe and the main pipe. The most important thing was to correctly reproduce the characteristics of diffusion near the joint of two pipes. Therefore, a fine grid arrangement was required to resolve the flows near the joint for the high precision of the model as shown in Figure 1. The horizontal pipe is the dead-end branch pipe, and the vertical one is main pipe. The material was set to water, and it filled the entire pipe. The 2D steady RANS equations were solve with k-ε turbulence model. The k-ε model solved for two variables: k: the turbulent kinetic energy, and ε: the rate of dissipation of kinetic energy.
Figure 1.The grid arrangement of the diffusion model.
Set the concentration of ferrous ions in the dead-end branch pipe to parameter (C0) and set the wall
of the dead-end branch pipe to the same concentration to simulate the actual situation in which the water continuously reacts with the pipe wall and releases ferrous ions.
According to the average concentration of ferrous ions at the outlet of the main pipe, the amount of ferrous ions diffused from the dead-end branch pipe was represented.
The basic condition was as follows. The length of the dead-end branch pipe (L) was 5m. The diameter of the dead-end branch pipe (D0) and the diameter of the main pipe (D1) were both 100mm. The
concentration of ferrous ions in the dead-end branch pipe (C0) was 10mol/m3, and the flow velocity
of the main pipe (V1) was 0.1m/s. By changing the values of the length of the dead-end branch pipe,
Figure 2. Experimental setup used to verify the numerical model.
Due to space limitations, six of the parameter settings of the verification experiments are shown in Table 1.
Table 1. The parameter setting of the verification experiments. Operating
condition
Temperature (K)
𝐶0
(mol/𝑚3) 𝑉1
(m/s) L (m)
𝐷0
(mm)
𝐷1
(mm) 1 288.15 0.057 0.043 0.36 40 40 2 288.15 0.101 0.069 0.62 40 40 3 293.15 0.094 0.056 0.36 40 40 4 293.15 0.047 0.07 0.62 40 40 5 298.15 0.052 0.059 0.36 40 40 6 298.15 0.095 0.069 0.62 40 40
3
Results and discussion
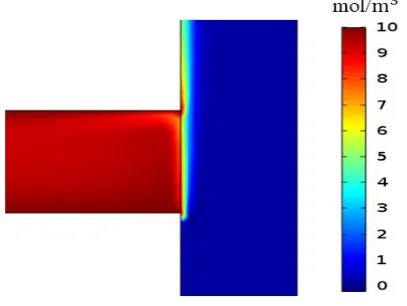
After numerical calculation and modeling analysis, the distribution of ferrous ions was obtained. To simplify, we only shown the ferrous ions distribution by modeling analysis at the basic condition in Figure 3.
Figure 3. The distribution of ferrous ions at the basic condition.
To further research the influence factor of diffused ferrous ions in the dead-end branch pipe, the method of control variables was carried out. Firstly, the concentration of ferrous ions in the dead-end
branch pipe, velocity, and pipe diameter was constant, to study the correlation of the diffusion amount and the length of the dead-end branch pipe. The result is shown in Figure 4.
Figure 4. The simulation results of ferrous ions diffusion at 288.15K, 293.15K and 298.15K under the influence of the length of the dead-end branch pipe (in left), and the distribution of ferrous ions
at 288.15K (in right).
From the Figure 4, the C0 was significantly influenced by the length. When the length of the
dead-end branch pipe increased from 1 to 5m, the C0 increased from 0.15 to 0.26mol/m3, and even increased
to 0.41mol/m3 at the condition of 9m for 288.15K. While, the C0 almost held steady if the length
exceeded 9m which the C0 only increased to 0.41mol/m3 at 9m. Interestingly, the temperature nearly
can not affect the C0 at the same length, which the simulation results was similar at the range of
0-9m, and had a little change when the length exceeded 9m. In conclusion, the C0 had positive
correlation at the short length (i.e. 0-9m) and it will be stable if length exceeded this value.
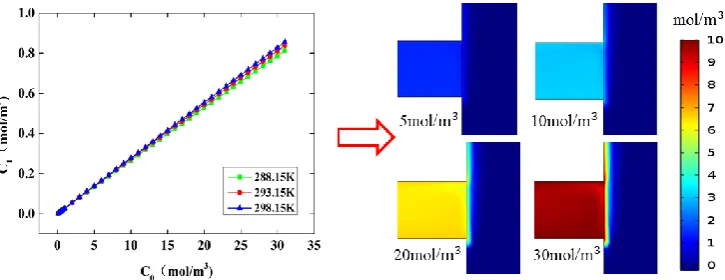
Figure 5. The simulation results of ferrous ions diffusion at 288.15K, 293.15K and 298.15K under the influence of the concentration in the dead-end branch pipe (in left), and the distribution of
ferrous ions at 288.15K (in right).
There was a positive linear correlation between the concentration of the ferrous ions diffused from main pipe and the concentration of it in the dead-end branch pipe as shown in Figure 5. The concentration of diffused ferrous ions in the main pipe increased from 0.013mol/m3 to 0.026mol/𝑚3, as the concentration of that in the dead-end branch pipe varied from 5mol/m3 to 10 mol/m3. Temperature had a slight effect on diffusion amount. There was no limit to the effect of concentration of dead-end branch pipe on the concentration of diffused ferrous ions, unlike the length of dead-end
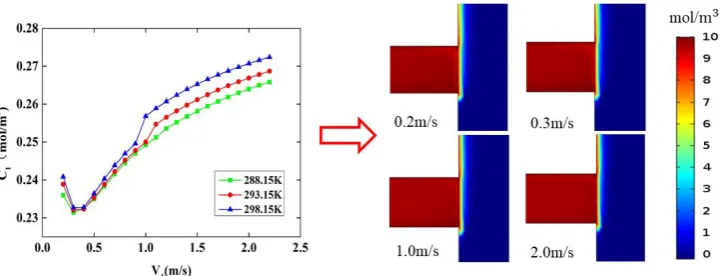
Figure 6. The simulation results of ferrous ions diffusion at 288.15K, 293.15K and 298.15K under the influence of the velocity of the main pipe (in left), and the distribution of ferrous ions at 288.15K
(in right).
It can be inferred in the Figure 6 that there was a positive correlation between the flow velocity of the main pipe and the concentration of the ferrous ions in it, when the flow rate was over 0.3m/s. However, the concentration declined with the velocity increases, when the velocity was below 0.3m/s. The concentration in the main pipe was the lowest at 0.3m/s. It may be due to the significant diffusion effect at low flow velocity, and the increased turbulence effect at high flow velocity. This was owing to the change of hydraulic condition and the time of diffusion, however the above two conditions (Figure 4 and Figure 5) may be caused by the change of the amount of ferrous ions in the main pipe, essentially.
Figure 7. The simulation results of ferrous ions diffusion at 288.15K, 293.15K and 298.15K under the influence of the diameter of the dead-end branch pipe (in left), and the distribution of ferrous
ions at 288.15K (in right).
Figure 7 shown the correlation of diffusion ferrous ions and the diameter of the dead-end branch pipe. In general, the concentration of diffused ferrous ions increased with the diameter of the dead-end
Figure 8. The simulation results of ferrous ions diffusion at 288.15K, 293.15K and 298.15K under the influence of the diameter of the main pipe (in left), and the distribution of ferrous ions at
288.15K (in right).
Besides the diameter of the dead-end branch pipe had obvious effect on the ferrous ions diffusion, the diameter of the main pipe also affected it (shown in Figure 8). From the results, the content of diffused ferrous ions decreased when the diameter of the main pipe increased. It might be ascribed to the large-diameter flux is greater than small-diameter flux and dilute the concentration of ferrous ions. Meanwhile, the temperature was not enough to affect the correlation between the ferrous ions diffusion and the diameter of the main pipe.
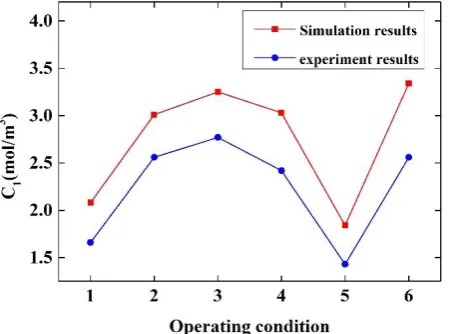
Figure 9. The results of numerical model and experiment.
According to Figure 9, the results of numerical model had the same tendency as experiments. The concentration of the experiment was lower than numerical calculation. That may be because the experiment cannot simulate the situation where the pipe wall is supplemented with ferrous ions in water.
4
Application
The results presented in this article was implemented in the WDN of CP, which is found in the south of China. The WDN provides water to 8,043 nodes which correspond to a population of about 500,000 habitants. The WDN has supplied by two water plants, which contribute an average of 280000 m3/d. The entire network is composed of 8043 nodes and 8149 pipes, including 16 nodes for water pump, 541 node for fire hydrant. The two water plants are located in the east and the central of the city respectively. Based on the WDN data of CP, the hydraulic model has been built.
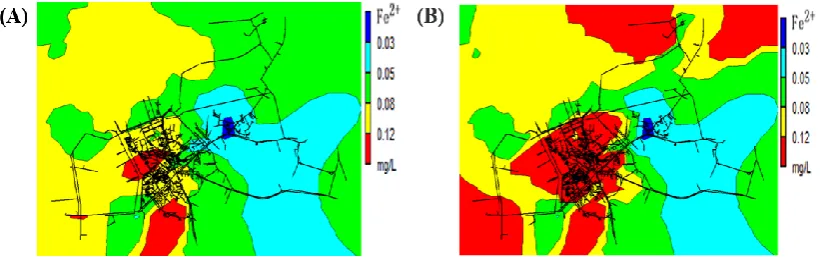
and the improved EPANET, respectively. The data at 13:00 was used as an example to draw a contour map of the ferrous ions concentration shown in Figure.2.
Figure 10. Contour map of the ferrous ions concentration of the EPANET (A) and the improved EPANET (B)
From the contour map, it can be seen that the calculation results had a significant difference between the EPANET and the improved EPANET, and the area of the ferrous ions concentration exceed 0.12mg/L had increased by about 5 times. Therefore, the improved model of water quality can reflect the impact of the ferrous ions in the dead-end branch pipes in the WDN more accurate.
5
Conclusion
After numerical calculation and experiment and analysis, the results suggested that the length of the
dead-end branch pipes, the concentration of ferrous ions in the dead-end branch pipes, the flow velocity of the main pipes, the diameter of the main pipes and the diameter of the dead-end branch pipes had significant effect on the concentration of ferrous ions in the main pipes. In this paper, the proposed method of improving water quality model was benefited for the water company on the management of water quality in the whole water distribution system.In conclusion, this research has proposed a new way to consider the dead-end contaminant as pollution sources and significantly improved the water quality model in WDN.
6. Acknowledgement
7.
References
[1] Zhang, Yan and M. Edwards, “Accelerated chloramine decay and microbial growth by nitrification in premise plumbing,” Journal. vol. 101, pp.51-62, 2009.
[2] Fabbricino, M and G. V. Korshin, “Changes of the corrosion potential of iron in stagnation and flow conditions and their relationship with metal release,” Water Research. vol.62, no. 10, pp. 136-146, 2014. [3] D.A. Lytle and M.R. Schock, “Impact of stagnation time on metal dissolution from plumbing materials in drinking water,” Journal of Water Supply: Research and Technology – AQUA. vol. 49, no. 5, pp. 243-257, 2000
[4] Shi, B. and J.S. Taylor, “Iron and copper release in drinking-water distribution systems,” Journal of Environmental Health. vol. 70, no. 2, pp. 29-36, 44, 46, 2007.
[5] Zhang, Xiaojian, et al., “A red water occurrence in drinking water distribution systems causedby changes in water source in Beijing, China: mechanism analysis and control measures,” Frontiers of Environmental Science & Engineering in China. vol. 8, no. 3, pp. 417-426, 2014.
[6] International, Cab. “Guidelines for drinking-water quality. Vol. 2. Health criteria and other supporting information,”1996.
[7] Zheng, Q. Q., et al., “Iron overload promotes erythroid apoptosis through regulating HIF-1a/ROS signaling pathway in patients with myelodysplastic syndrome,”Leukemia Research. vol. 58, pp. 55, 2017. [8] Hartmann, J, et al., “Iron overload impairs proliferation of erythroid progenitors cells (BFU-E) from