O R I G I N A L P A P E R
Open Access
Preventing the risks of monotony related
fatigue while driving through gamification
Lukas Bier, Michael Emele, Kaja Gut, Jasna Kulenovic, David Rzany, Max Peter and Bettina Abendroth
*Abstract
Background:Driving fatigue can have serious consequences. Too often fatal accidents are caused by fatigue. However, it is not uncommon for fatigue to occur while driving when the driver is under-challenged. Due to the increasing automation of vehicles, it is foreseeable that the number of accidents caused by monotony will increase. Interactions between driver and vehicle through gamification can remedy the situation and provide the driver with new stimuli during an otherwise monotonous journey.
Methods:In order to test the effectiveness of such interactions, we conducted a driving simulator study with 31 test persons to investigate driving performance and psycho-physiological parameters. Each subject ran through the experiment three times in randomized order to test the interaction system in comparison to a ride in which the driver was alone and a ride in which the driver had a co-driver.
Results:The results provide clear indications of safer driving of the test subjects when driving with gamification and with a passenger. The tested interaction system prevents upcoming fatigue in a similar way to communication with a passenger. The experiments also provide insights into the effects of monotony in vehicle driving.
Keywords:Monotony, Fatigue, Gamification, Human-computer interaction, Driving, Simulator
1 Introduction
As today’s automobiles become increasingly automated, more and more tasks are taken from the driver. Exam-ples of this are assistance systems such as cruise control, lane keeping as well as automatic braking and parking systems. On this basis, the actual driving task continu-ously changes into autonomous driving over time. Con-sequently, more and more road users rely on the systems implemented in the vehicle, which in turn leads to a lower focus on the actual driving task [105]. As a sult of reduced mental activity, under-utilisation can re-sult in passive task-related fatigue [59]. As the journey progresses, drivers initially become more inattentive and ultimately more tired [50,69,70,73,74,93,95]. This fa-tigue can lead to accidents. Every year more than one million people die in car accidents worldwide [103]. Various studies assume that 10–20% of all accidents are fatigue-related and that they account for an even larger proportion of fatal accidents [69, 83, 95]. It is particu-larly important for professional drivers and other
persons who drive long distances to remain alert for the duration of their journey [74]. The under-utilisation that leads to fatigue results from driving through familiar or particularly monotonous driving scenarios. Monotony driving is defined as long motorway journeys, journeys at night [52], in low traffic, with few curves, constant noise levels and monotonous surroundings, such as roads surrounded by noise barriers and deserts [59]. Ul-timately, the under-utilisation can be attributed to the persistent lack of new stimuli.
The declared aim of this study is to enrich the driving task with new stimuli in order to prevent the driver’s performance from constantly declining and ultimately preventing the driver from losing sight of the driving task altogether. It has been proven that new stimuli or an increase in mental strain [101], such as those offered by co-drivers [20,99], increase driving performance. Ac-cording to the studies by Markey et al. [58], four aspects have to be considered to continuously engage drivers. The challenge has to be increased, performance feedback has to be given, social recognition has to be offered and finally an incentive system for the driver has to be cre-ated. The implementation of these aspects takes place
© The Author(s). 2019Open AccessThis article is distributed under the terms of the Creative Commons Attribution 4.0 International License (http://creativecommons.org/licenses/by/4.0/), which permits unrestricted use, distribution, and reproduction in any medium, provided you give appropriate credit to the original author(s) and the source, provide a link to the Creative Commons license, and indicate if changes were made.
* Correspondence:[email protected]
through the gamification of the driving task. Gamifica-tion refers to the integraGamifica-tion of playful elements into a non-playful context [17].
Gamification has already contributed to a general im-provement in performance in other contexts, for ex-ample in the education and health sector [34,86].
In detail, an interaction system was developed that ac-tively influences the driving task by giving real-time challenges for the driver with regard to lane keeping, speed keeping and distance keeping, as well as rewarding increased attention to the vehicle environment by quiz questions about the vehicle environment. The new stim-uli are not only visual, but also auditory and verbal, since a voice control was implemented.
The goal of this research was to investigate the effects of the system on the driver’s monotonous fatigue and thus also on his driving performance and safety.
In order to better understand the course of monoton-ous fatigue and its effects, a comparison was made with a solo ride.
In the further course of this article, the methodology of how monotony was induced and how fatigue was measured is presented on the one hand and the results are presented and discussed on the other hand. The con-tribution thus provides insights into how monotonic fa-tigue can be prevented without distracting the driver from the actual driving task by a secondary task.
2 Related work
2.1 Causes and effects of fatigue
Fatigue results from a task-related continuous strain. It is irrelevant whether the strain is too low or too high, since the effects are equal [46].
Fatigue as such can depend on various causes, which can occur individually or collectively. The degree of fa-tigue depends mainly on the duration of the existing causes. The symptoms on a physical and psychological level can be represented as follows. Physically, fatigue leads to disorders of motor and sensorimotor coordin-ation, such as a decrease in the precision of cyclically re-curring movements, a flattening of breathing and a change in cardiovascular activity, such as a pulse acceler-ation or deceleracceler-ation. Psychologically, there are recep-tion, perception and coordination disorders as well as a decrease in concentration, attention and thinking skills, unwillingness to work, irritability and the subjective feel-ing of tiredness ([8, 46]). Fatigue should not be equated with sleepiness, as the latter is due to a lack of sleep and is reversible only through sleep. Fatigue, on the other hand, can be countered by changing the over- or under-challenging task [59].
Fatigue is measured either through the activity itself (reduction in performance, more mistakes) or through reactions before/during/after the activity [8].
2.2 Intervention against fatigue
Measures against fatigue have not yet been technically intro-duced in the automotive industry; currently implemented warning systems only indicate increased fatigue. Neverthe-less, there are various studies that have devoted themselves to reducing fatigue and have investigated the influence of various countermeasures. In the literature, a fundamental distinction has been made in this context between behav-ioural and relational prevention measures [16,102].
Relational prevention against fatigue requires measures of a technical or organisational nature. These change the conditions for the driver in a way that reduces or elimi-nates the fatiguing effect of the driving situation. Behav-ioural prevention, on the other hand, refers to measures taken by the driver personally to prevent fatigue.
Studies on behavioural prevention investigated the ef-fects of short breaks [32], caffeine consumption [57], food intake [32] and exercise [39, 41]. A positive effect on the state of fatigue could be proven for all measures. However, for the implementation of the measures it is either necessary to interrupt the driving task or the dur-ation of the effect is very short (10–20 min) (cf. [32]).
Studies prove that relational prevention can also lead to a reduction of the measurable fatigue effects by cer-tain light settings [76], temperature settings [84,92], but also by ventilation [32] and acoustic irradiation [4, 32]. Here it can also be seen, however, that the reduction in temperature, for example, could lead to more alerted test persons for a short time, but that the fatigue effects re-appear quickly. This can be attributed to the fact that the actual task of the test person remains monotonous and the adaptation of the environment only provides new stimuli for a short time.
Finally, there is the option to adjust the driver’s task so that new stimuli are set. This can be done by a second-ary task or by adjusting the driving task itself.
Verwey and Zaidel [98] let test persons interact with a gamebox, which combined trivia quiz questions and a Tetris game. In a monotonous test ride, significant im-provements in driving performance were observed. However, the gamebox bears the danger of completely turning the driver away from the driving task and thus poses a new safety risk.
Steinberger et al. [89] used a reward game in short driving tests of 20 min to influence the driver’s speed at-titude. A particularly precise adherence to the speed was rewarded and presented playfully on a Head-Up-Display (HUD). The results obtained in this experiment suggest that gamification reduces boredom significantly.
3 Method 3.1 Apparatus
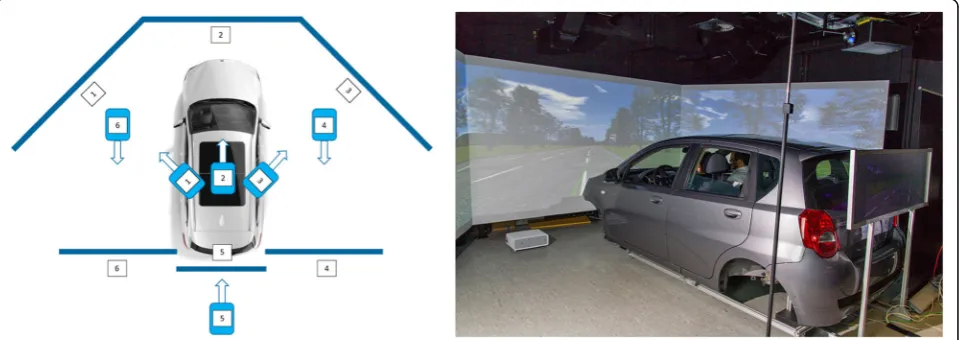
The institute’s own static driving simulator was used for the test series. The simulation environment is generated with the driving simulation program SILAB 5.1 and is realized by a simultaneous projection of six beamers onto six associated screens (see Fig. 1). This setup en-sures a realistic 360° panoramic view.
The vehicle used is an original Chevrolet Aveo body with a fully-fledged interior and full range of functions. All mirrors and the seat position are freely adjustable and can be adapted to the respective needs of the vari-ous test participants. The vehicle is designed as an auto-matic system and controlled via brake pedal, accelerator pedal and steering wheel. The driving noises are simu-lated using speakers mounted in the vehicle. The data recording rate is 60 Hz.
3.2 Driving scenario and boredom induction
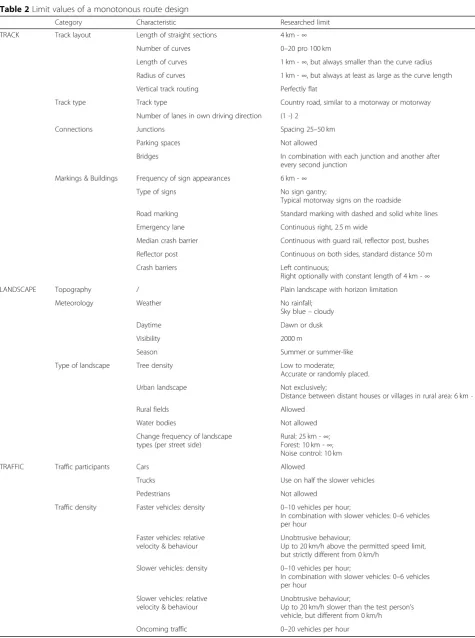
There is no general definition of a monotonous driving situation in the literature. Driving test routes are often designed without any traffic or curves. However, since this route design leads to extremely unrealistic driving scenarios, limit values of a monotonous route design were first identified by a literature search. In order to de-fine the characteristics of a monotonous driving situ-ation, a detailed literature search of studies on driver fatigue was carried out and the core information on their route design was collected according to a specially cre-ated categorisation for route modelling (see Table 1). For the three main influencing groups of route, land-scape and traffic, all integrated influencing factors were quantitatively analysed and thus intervals and limit values were defined which, if adhered to, would be highly likely to lead to a fatigue-promoting driving situ-ation (Table2). In total, the route designs of 32 studies
in which monotonous fatigue could be detected were analysed and summarised.
The design of the simulation route follows the principle“as monotonous as necessary, as varied as pos-sible”in order to guarantee the primary goal of generat-ing fatigue durgenerat-ing the drivgenerat-ing task while ensurgenerat-ing a realistic driving experience as well as sufficient possibil-ities for environment-dependent driving games and measuring methods. Finally, a 240 km long motorway section of the German motorway A5 was selected and simulated as a route, which fulfils the researched criteria from Table2. This procedure ensures that the simulated route satisfies the requirement of depicting a real driving scenario. An illustration of the simulated route can be seen in Fig.2for three route sections.
3.3 Monotony intervention
The interaction system developed [9] consists of a head-up display (5-in.) and a centre console display (12-in.). The HUD is visible to the test person on the windscreen as a reflection of a smartphone screen and is only active during interactions.
The game contains a total of 3 types of driving games in which the test person is instructed to: maintain the lane as precisely as possible on straight stretches of the road; maintain the legal minimum distance to the ve-hicle in front as accurately as possible or maintain the current maximum speed as accurately as possible. All games are active for 1 min at a time and reward a par-ticularly good goal achievement with points, which are summed up in a high score.
Thus, the driver is presented with a new challenge, which consists of the precise fulfilment of his general driving task. For the course of the driving game, the drive receives feedback on how well he is currently ful-filling his driving task (see Fig. 3on the left). Social rec-ognition is provided by the scoring system, which
simultaneously rewards the driver (Fig. 3 right) and al-lows him to compare his performance with other drivers (Fig. 4 right). As a special incentive, the driver is prom-ised a 50€ amazon shopping voucher at the start of the system in case he achieves the best performance among all participants. Therefore, all 4 requirements (challenge,
performance feedback, social recognition and incentive) for a successful gamification by Markey et al. [58] are fulfilled.
Each driving game is followed by 3 quiz questions from a catalogue of 11 quiz questions, which animate the test person to verbal activity and encourage him to Table 1Information in researched studies on route design by category
Author Track
layout Track type
Connections Markings & Buildings
Type of landscape
Topography Meteorology Traffic density
Traffic participants
Åkerstedt, Peters, Anund, & Kecklund, 2005 [2]
x x x
Arnedt, Wilde, Munt, & MacLean, 2001 [5] x x x x
Atchley, Chan, & Gregersen, 2014 [6] x x x x
Boyle, Tippin, Paul, & Rizzo, 2008 [12] x x x
Eoh, Chung, & Kim, 2005 [22] x x x x
Fletcher, Petersson, & Zelinsky, 2005 [25] x x x
Forsman, Vila, Short, Mott, & van Dongen, 2013 [26]
x x x x x x
Gastaldi, Rossi, & Gecchele, 2014 [28] x x x
Gershon, Shinar, & Ronen, 2009 [29] x x x
Greschner, 2011 [32] x x x x
Hayami, Matsunaga, Shidoji, & Matsuki, 2002 [37]
x x x
Horne & Baulk, 2004 [40] x x x x x
Horne, J. & Reyner, L., 2001 [39,41] x x x x
Ingre, Akerstedt, Peters, Anund, & Kecklund, 2006 [43]
x x x
Katja Karrer-Gauß, 2011 [46] x x x x x x x
Körber, Cingel, Zimmermann, & Bengler, 2015 [48]
x x
Larue et al., 2011 [52] x x x x x x x x
Lenné, Triggs, & Redman, 1997 [53] x x x x x
Liu, 2015 [55] x x x x x x x
Merat & Jamson, 2013 [62] x x x x
Mets et al., 2011 [63] x x x x x x
Moller, Kayumov, Bulmash, Nhan, & Shapiro, 2006 [64]
x x x
Neubauer, Matthews, & Saxby, 2014 [66] x x x x
Otmani, Pebayle, Roge, & Muzet, 2005 [67] x x x x x x x
Paul, Boyle, Tippin, & Rizzo, 2005 [71] x x x
Rimini-Doering, Manstetten, Altmueller, Ladstaetter, & Mahler, 2001 [79]
x x x x
Rossi, Gastaldi, & Gecchele, 2011 [80] x x x x x
Saxby, Matthews, Hitchcock, & Warm, 2007 [82]
x x x x x x x
Thiffault & Bergeron, 2003 [93] x x x x x x x
Ting, Hwang, Doong, & Jeng, 2008 [94] x x x x x x
Valck & Cluydts, 2001 [96] x x x x
Table 2Limit values of a monotonous route design
Category Characteristic Researched limit
TRACK Track layout Length of straight sections 4 km -∞
Number of curves 0–20 pro 100 km
Length of curves 1 km -∞, but always smaller than the curve radius
Radius of curves 1 km -∞, but always at least as large as the curve length
Vertical track routing Perfectly flat
Track type Track type Country road, similar to a motorway or motorway
Number of lanes in own driving direction (1 -) 2
Connections Junctions Spacing 25–50 km
Parking spaces Not allowed
Bridges In combination with each junction and another after every second junction
Markings & Buildings Frequency of sign appearances 6 km -∞
Type of signs No sign gantry;
Typical motorway signs on the roadside
Road marking Standard marking with dashed and solid white lines
Emergency lane Continuous right, 2.5 m wide
Median crash barrier Continuous with guard rail, reflector post, bushes
Reflector post Continuous on both sides, standard distance 50 m
Crash barriers Left continuous;
Right optionally with constant length of 4 km -∞
LANDSCAPE Topography / Plain landscape with horizon limitation
Meteorology Weather No rainfall;
Sky blue–cloudy
Daytime Dawn or dusk
Visibility 2000 m
Season Summer or summer-like
Type of landscape Tree density Low to moderate;
Accurate or randomly placed.
Urban landscape Not exclusively;
Distance between distant houses or villages in rural area: 6 km -∞
Rural fields Allowed
Water bodies Not allowed
Change frequency of landscape types (per street side)
Rural: 25 km -∞; Forest: 10 km -∞; Noise control: 10 km
TRAFFIC Traffic participants Cars Allowed
Trucks Use on half the slower vehicles
Pedestrians Not allowed
Traffic density Faster vehicles: density 0–10 vehicles per hour;
In combination with slower vehicles: 0–6 vehicles per hour
Faster vehicles: relative velocity & behaviour
Unobtrusive behaviour;
Up to 20 km/h above the permitted speed limit, but strictly different from 0 km/h
Slower vehicles: density 0–10 vehicles per hour;
In combination with slower vehicles: 0–6 vehicles per hour
Slower vehicles: relative velocity & behaviour
Unobtrusive behaviour;
Up to 20 km/h slower than the test person’s vehicle, but different from 0 km/h
concentrate on the driving route in the future. The fol-lowing task serves as an example for such a question:
"Please guess the distance to the car ahead of you".
The question is presented to the driver via voice output, giving him a new auditory stimulus. He answers the ques-tion verbally to avoid turning his attenques-tion off the road on the one hand and to become mentally and physically ac-tive on the other. The dialogue between the driver and the interaction system ends the previously monotonous driv-ing situation for the driver. The driver receives the feed-back via the HUD, so that he does not have to turn his gaze away from the road. The points are given via voice output. The driver will quickly notice that the quiz ques-tions are repeated and will therefore be motivated to pay more attention to the details in the vehicle environment that are all relevant for fulfilling the driving task. With this approach, the concept of Steinberger et al. [89], which only referred to speed and did not generate any verbal ac-tivity by the driver, was extended.
3.4 Study design
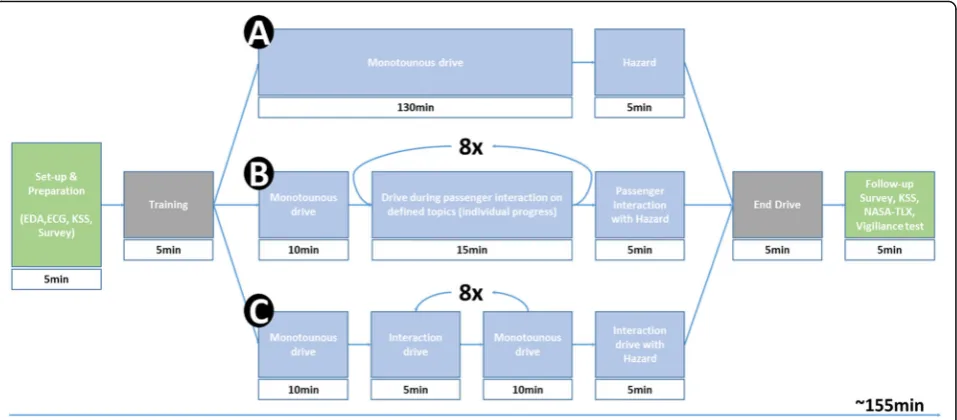
The study was designed as a within-sample in which the same subjects had to complete three runs. The resulting
data sets were then compared with each other. Each test person drove one ride on his own as a baseline measure-ment, one ride with the interaction system and one ride with a human co-driver. The co-driver ride serves for comparison, as it is proven that a human co-driver breaks the monotony on motorway trips, motivates the driver and builds up pressure on the driver to perform [7,19,32,42]. The co-drivers were provided by the insti-tute and conducted scripted conversations with the test persons in order to ensure comparability between the test persons. One third of the conversation time was spent talking about the test person, his work and his hobbies, one third about trivia and another third of the conversation time was spent playing driving games (e.g. I spy). The test persons went through the three 2.5 h rides in randomised order on three different days to ex-clude sequence effects.
3.5 Participants
A total of 37 volunteers took part in the study, 6 of which had to stop the experiments temporarily due to the simulator sickness [13]. This left 31 usable data sets and thus a similar or higher number of subjects com-pared to other studies ([52]; cf. [89,94,98]). Of these, 18 male and 13 female subjects were involved in the driving Fig. 2Exemplary illustration of the route - cross-country (left) - rural (centre) - through town with noise protection (right)
experiments. Some participants were recruited from the institute’s pool of volunteers, while others were recruited from campus. Two men and two women indicated that they have already had experience with a driving simula-tor. All test persons had to be in possession of a valid driving licence. The test persons received 100€ after completion of the three journeys, if the tests were not finished, the test persons were compensated with 10€.
3.6 Procedure
Prior to the start of the driving tests, the test persons were briefed by telephone or e-mail that they should re-frain from taking caffeine on the day of the tests and go to bed early the evening before in order to be able to take part in the tests well rested. The test persons also brought a filled-in questionnaire on their person (age, sex, driving experience and the Epworth-Sleepness-Scale [45]) to the first test date. There were two test slots to choose from. The first slot was scheduled from 08:30– 11:30 and the second slot from 12:00–15:00. The test persons completed all three experiments at intervals of at least 2 days in the same slot in order to exclude effects of the circadian rhythm on the experiment as far as pos-sible. With more than 300 test hours on 55 test days, the trials covered the period from November 2017 to Janu-ary 2018.
Before each journey, the test persons were taken to a preparation room. There they filled out the Karolinska-Sleepiness Scale (KSS) [1] to record the state of fatigue before the start of the journey. They were also equipped with a Varioport system to measure electrocardio activ-ity (ECG, 3 electrodes on the chest) and electrodermal activity (EDA, two non-polarizing silver electrodes on the left feed) which collected data with a 60 Hz scan
rate. To avoid interference with the measurements, the test persons were asked to remove their mobile phones.
The test persons were then taken to the driving simu-lator, where the simulator functions were explained to them. Eye tracking glasses (SMI ETG 2) were applied to the test persons and set up using a 3-point calibration.
At the start of the journey, the test persons first drove a five-minute test section (see Fig. 4). The test section was simulated as a country road with many curves in order to familiarize the test persons with the simulator. In this section, subjects affected by the simulator sick-ness were able to determine whether they might have to stop the experiments.
Subsequently, the test persons drove onto the motor-way from the country road and the test recording began. All three tests had the same route over 235 km of motorway. During the solo ride the test person was therefore alone for approx. 135 min and occupied with the driving task only. During the ride with the developed interaction system there were a total of nine sessions for which the interaction system was activated. Each session consisted of a driving game and 3 quiz questions which were mixed together from a catalogue of 11 quiz ques-tions. Each subject performed the same driving tasks and answered the same questions at the same waypoints in order to ensure comparability of the experiments. An interaction session lasted about 5 minutes. The way-points that triggered the interaction were about 15 min apart, so there was a break of about ten minutes be-tween the interactions. The 10-min interval was previ-ously chosen to ensure that the driver was offered new stimuli at not too long intervals (see [44]).
person. Two different co-drivers shared the 31 rides with the test persons, addressing identical topics at the same time. The topic always changed at the same waypoints when a driving game was introduced on the interaction ride. The co-drivers received a signal via headphones that indicated the change of topic. In a total of nine ses-sions, topics from the areas of job, hobby and vacation of the test persons were discussed in the first three ses-sions. In the next three sessions, topics on general edu-cation from the fields of geography, famous personalities and music were addressed. In the last three sessions, games like“Who am I?”were played.
At kilometre 232, a dangerous situation was simulated on all journeys. Here, a wild boar crossed the lane of the test person 120 m in front of the vehicle. The hazard re-quired a sharp braking manoeuvre or an evasive steering manoeuvre and was included as an attention test ([47]; cf. procedure by [89]). The road section before the haz-ard was simulated as dense woodland for several kilo-metres, so that the test persons could not memorize the exact spot.
After the respective driving test, the eye movement system was immediately removed and the test persons completed a NASA-TLX questionnaire, a KSS question-naire and a vigilance test. The ECG and EDA electrodes were then removed. After driving with the developed interaction system, the test persons completed an add-itional acceptance questionnaire.
3.7 Research questions
The central research questions can be formulated as follows:
RQ1: How does the use of gamification in vehicle driving influence the development of subjective and objective psycho-physiological data and measurements compared to driving alone?
RQ2: How does the use of gamification in vehicle driving influence driving performance and safety compared to driving alone?
RQ3: Is the interaction system suitable for avoiding fatigue in the same way as a passenger during monotonous journeys?
3.8 Measures
Fatigue is not directly measurable, only its consequences. Since these can vary from person to person, however, a first difficulty regarding the interpretation is already ap-parent here. In order to be able to estimate the degree of fatigue, values must be known at which the performance decreases [51].
The measurement methods to identify fatigue where chosen through the review of Bier, Wolf, Hil-senbek and Abendroth [10]. A combination of
measured values was chosen for the test. This in-cludes values of subjective evaluation, psycho-physiological excitement and driving performance.
3.8.1 Subjective psycho-physiological measurements
The subjective evaluation of the effectiveness of the interaction system was carried out under various aspects. On the one hand, it was necessary to find out whether the subjective fatigue assessment of the test persons showed a difference between the trials. On the other hand, it was to be investigated whether the strain of the test persons differed during the trials.
3.8.1.1 Fatigue assessment Both individual-centred in-struments (unstructured interviews) and standardised measurement methods for subjective fatigue assessment are available. Since unstructured interviews are very time-consuming and do not offer a high degree of stand-ardisation, a self-rating procedure is used to record sleepiness.
The used “Karolinska-Sleepiness-Scale (KSS)” is ori-ginally derived from the “Stanford Sleepiness Scale” by Hoddes et al. [38]. Before and after each simulation run, fatigue was measured using the Karolinska-Sleepiness-Scale [1]. It is a nine-step scale, from “1 - extremely alert” to “9 - very sleepy, great effort to keep awake, fighting sleep”. The participant marks the appropriate number. According to Åkerstedt and Gillberg [1], the psychometric measurement methods for fatigue have a satisfactory, criterion-related validity. Although the scale was originally used to measure drowsiness, it can be used to measure fatigue [97], especially when the differ-ence between pre- and post-sleep is used.
100. The dimension is always evaluated from 0 for“low” to 100 for“high”.
3.8.2 Objective psycho-physiological measurements
Two different measuring systems were used to measure psycho-physiological excitement. The electrodermal ac-tivity (EDA), the electrocardiography (ECG) and the blink frequency of the test persons were recorded. All parameters were recorded throughout the entire dur-ation of the test. Eye tracking glasses from SMI (SMI ETG 2 System) were used to record the blink frequency and the Varioport system from Becker Meditec was used to record EDA and ECG.
3.8.2.1 Electrodermal activity (EDA) Electrodermal ac-tivity generally refers to bioelectrical phenomena in the skin that can be described physically as changes in con-ductivity, resistance and potential [100]. The measured electrodermal activity reflects the sweat production in the eccrine glands, which increases with growing excita-tion of the test persons and their nerve tracts and thus enhances skin conductivity [78].
The EDA was measured exosomatically via non-polarizing silver electrodes in combination with an elec-trode paste applied to the elecelec-trodes with a content of 0.5% NaCl. According to the recommendations of Bouc-sein [11], the palmar and planar surfaces are particularly suitable as optimal conductors of the EDA. Since the steering movements were carried out with the hands, however, an attachment should be avoided due to an in-creased probability of movement artefacts. Thus, the left foot proved to be particularly suitable. Due to the auto-matic gearshift, it is not used while driving and is there-fore available for measurements. The tonic skin conductance (SCL) was evaluated.
3.8.2.2 Electrocardiography (ECG) An electrocardio-gram (ECG) is used to determine cardiac activity. The electric activity of the heart muscle fibres is recorded by electrodes attached to the human chest. The frequency of the heartbeat can be evaluated by identifying so-called R waves. The most frequently used characteristic of heart rate is defined by the time interval between two heart beats and the number of beats per minute (see [52]). The variation of the heart beat intervals is called the heart rate variability (HRV). This parameter essen-tially expresses the rate at which the heart rate changes. It can be evaluated on the basis of various parameters. In this study the standard deviation of the R-wave inter-vals (SDNN) was used. Heart rate variability increases with fatigue (see [104]). The heart rate was measured using three disposable electrodes, which were attached according to the manufacturer’s specifications of the Varioport measuring system. A derivation from the
upper end of the breastbone to the left lowest ribcage is recommended. The ground electrode of the recorder is attached to the breast bone’s xiphoid, which is located at the lower end of the breastbone. The data was collected at 500 Hz and recorded at 60 Hz synchronously with the vehicle data via the Silab 5.1 simulation software.
3.8.2.3 Blink frequency The lid closure was recorded with eye tracking glasses ETG2 from SMI. The evalu-ation was carried out with regard to the blink frequency. Stern et al. [90] and Platho et al. [75] proved that the blink frequency increases with increasing fatigue before rapidly decreasing shortly before falling asleep.
3.8.3 Driving performance data
Driving performance data were recorded directly via the Silab driving simulator software at 60 Hz and could then be analysed and averaged for all test persons. Driving performance data are divided into vehicle data and vigi-lance data and are described below.
3.8.3.1 Lane-keeping To evaluate the lane keeping, the standard deviation of the lateral position (SDLP) is eval-uated. The lateral position is measured as the distance between the centre of the vehicle and the centre of the right-hand lane [5,12,67].
Within the framework of our study, the lane position was calculated using the simulation software SILAB. Route sections with a curve or forced overtaking ma-noeuvres were excluded from the respective interval data (see chapter 3.8).
3.8.3.2 IncidentsA frequently used method of perform-ance validation is to consider incidents that have oc-curred. In general, an incident is considered to be an overstepping of the road mark due to unintentional manoeuvring [23, 94]. In this study, an incident is as-sumed to have occurred when either the left or right lane markings are exceeded with the front and rear wheels. This corresponds to the definition of “crossing the road mark with only one side”, which is frequently used in the literature [54].
3.8.3.3 Accidents Accidents are evaluated separately, as an extreme form of incidents. In this context, an acci-dent is defined as the departure from the road to the right into the ditch or to the left across the lanes into the centre crash barrier.
deviating from 100 km/h were located within the evalu-ation intervals (see chapter 3.9), these sections were ex-cluded from the interval data, in order to consistently analyse the speed deviation from the 100 km/h speed limit.
3.8.3.5 Vigilance Vigilance is the term used to describe the continuous attention paid to a stimulus-poor task and was first examined by Mackworth [56] using the clock-hand test. Today there is a large number of test designs that often require a test person to respond to a certain signal (cf. [48, 72, 87]). However, these tests interfere with the monotonous task to be investigated by imposing a secondary task. For this reason, we have de-cided to develop our own investigation method for vigi-lance assessment. The vigivigi-lance measurement is carried out using two indicators. On the one hand, various traf-fic signs were (de)placed on the 240 km long route. This means that there were three intensity levels in which the traffic signs were set up, unsuitable for the chosen driv-ing scenario. The stages of intensity from which an as-cending signal effect can be expected for the driver are as follows:
Stage 1: Traffic sign known from national road traffic, but not to be found on motorways, Stage 2: Traffic sign shape/colouring known, but
warning content not (e.g. moose danger in Germany),
Stage 3: Traffic sign shape/colour unknown, content unknown (e.g. yellow warning sign for koalas in Germany).
One sign of each level was placed along the route for each driving scenario. After the test ride, the test per-sons had to identify the wrong signs from a list. They re-ceived a list of 12 signs, 9 of which did not appear during the test ride. While the vigilance measurement via the sign recognition rate was only carried out pas-sively, i.e. was queried afterwards, a further test was im-plemented in the route, which actively checked the vigilance. At a distance of 232 km and a pre-set speed of 100 km/h, a wild boar was simulated running into the lane at a distance of 120 m. The average reaction time of the test persons is used to record the vigilance. These re-action tests were also carried out by Steinberger et al. [89] and Neubauer et al. [66]. Both a brake pedal actu-ation and a steering manoeuvre are evaluated as a reaction.
3.9 Data analysis
For the data analysis, intervals were determined in which the driving tests were evaluated. The intervals where ne-cessary in order to show the development of the
measures over time and in order to have comparable sections between trials. As shown in Fig. 5, a total of nine interactions took place during the interaction ride. For each of these interaction sessions, a period of 5 nutes or 10 kilometres was evaluated. In addition, 5 mi-nutes or 10 kilometres between the interactions were also evaluated in order to analyse the course of the pa-rameters descriptively over time. This resulted in a total of 17 intervals with a starting point defined as a fixed waypoint. For the statistical comparisons between the driving scenarios, the total mean values over the entire driving time were calculated for each parameter, as well as the mean values for the second interaction interval (interval 3) and 3 further intervals every half hour (inter-val 7, inter(inter-val 11 and inter(inter-val 15). The e(inter-valuation started with interval 3 since interval 1 was necessary for habitu-ation of the test person. The identical route-dependent intervals were evaluated for all three driving scenarios. The data were adjusted for outliers according to the Winsor method [18]. In addition to the p-value, the ef-fect size (Cohen’s d) was calculated for all statistical comparisons. The comparisons were carried out in a pair comparison between solo ride & co-driver ride, interaction ride & solo ride and interaction ride & co-driver ride using t-tests for paired samples. In the case that no normal distribution of the data was given, the non-parametric Wilcoxon test was used.
4 Results 4.1 Sample details
The participants were distributed in almost equal pro-portions across the sexes. A total of 18 male (58.1%) and 13 female (41.9%) subjects took part in the experiment. The subjects were 20–60 years old and had an average age of about 30 years (M 30.45 years, SD 10.19), forming a rather young collective. In comparison, the average German professional driver is 39.8 years old [35]. The younger collective is reasoned by the fact that younger drivers in particular lose attention more quickly in mon-otonous driving situations [21], and by the fact that they are particularly frequently involved in fatigue-related ac-cidents [3, 68, 77, 91]. The average driving experience was approximately 13 years (M 13.29 years, SD 10.12).
4.2 Subjective psycho-physiological data
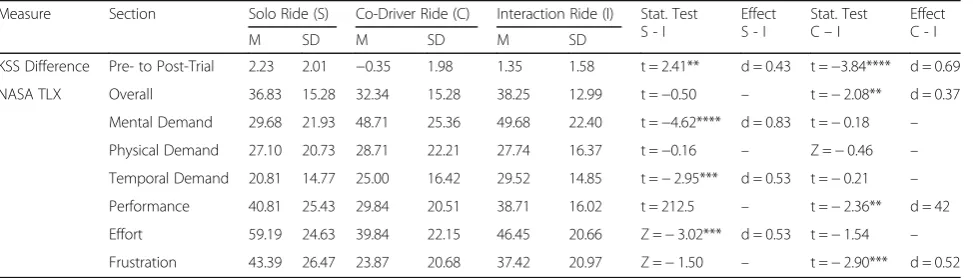
The results of the subjective psycho-physiological survey are shown in Table 3 and their comparisons are de-scribed below.
the trials. The differences thus describe the change in the state of fatigue over the course of the trial. A high positive difference represents a strong increase in the state of fatigue. The results show an average increase of 2.23 fatigue levels when driving alone and only 1.35 levels when interacting on the 9-step scale. The co-driver ride even led to a reduction of the subjectively perceived fatigue by 0.35 steps. The differences between the scenarios were significant in all pair comparisons.
Subjective strain: The subjective strain was evaluated using the short form of the NASA TLX. The overall evaluation shows that the strain was highest during the interaction ride with 38.25 points out of 100 possible points. In contrast, the perceived strain of 36.83 points was only slightly lower for the solo ride. The perceived strain for the co-driver ride was 32.34 points. The only significant difference, with a small effect, is between the co-driver ride and the interaction ride. The higher over-all score for solo driving results from a very high score for effort, which differs significantly from the score for effort in the other two scenarios. The high score of the interaction ride, on the other hand, results from a high evaluation of the mental requirement, which differs from the other rides with medium to strong effects.
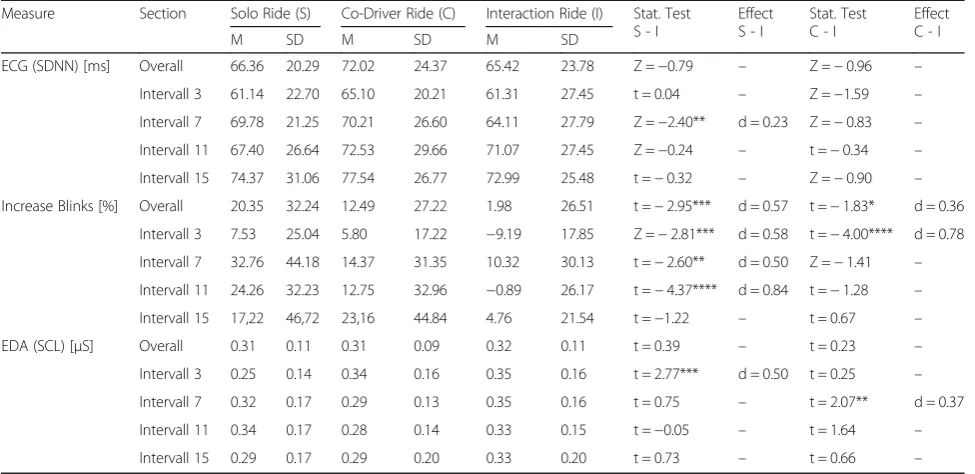
4.3 Objective psycho-physiological measurements The results of the analysis and comparisons of the ob-jective psycho-physiological measurements are presented
in Table 4 and explained below. Due to a system error, no reliable data were available for the ECG data for sub-ject P8, who was subsequently excluded from the evalu-ation. During the recording of the blink frequency, the measuring system of the test persons P3, P4, P5, P9 and P28 was disturbed during one solo test ride each. In addition, the measurement system was not compatible with the head dimensions of P20, for which no data was available either.
Electrocardiography: Electrocardiography provided the standard deviation of the R-wave intervals (SDNN).
The SDNN is 66.36 ms for the solo ride, 72.02 ms for the co-driver ride and 65.42 ms for the interaction ride. When comparing the total values, there are no cant differences. In the interval analysis there is a signifi-cant difference with a slight effect between the interaction drive and the solo drive in interval 7 only. Here, the SDNN is 69.78 ms for solo rides and 64.11 s for interaction rides. The general development over the duration of the test ride (from interval 3 to interval 15) is comparable for all three rides with an increase in SDNN of about 15 ms.
Blink frequency: The blink frequency was evaluated in form of an increase in relation to the first interval, since communication influences the blink frequency to a large extent and it therefore differs depending on the form of communication. The analysis of the increase in relation to the first interval with communication/interaction Fig. 5Evaluation intervals of the measurement data
Table 3Results related to the subjective experience
Measure Section Solo Ride (S) Co-Driver Ride (C) Interaction Ride (I) Stat. Test S - I
Effect S - I
Stat. Test C–I
Effect C - I
M SD M SD M SD
KSS Difference Pre- to Post-Trial 2.23 2.01 −0.35 1.98 1.35 1.58 t = 2.41** d = 0.43 t =−3.84**** d = 0.69
NASA TLX Overall 36.83 15.28 32.34 15.28 38.25 12.99 t =−0.50 – t =−2.08** d = 0.37
Mental Demand 29.68 21.93 48.71 25.36 49.68 22.40 t =−4.62**** d = 0.83 t =−0.18 –
Physical Demand 27.10 20.73 28.71 22.21 27.74 16.37 t =−0.16 – Z =−0.46 –
Temporal Demand 20.81 14.77 25.00 16.42 29.52 14.85 t =−2.95*** d = 0.53 t =−0.21 –
Performance 40.81 25.43 29.84 20.51 38.71 16.02 t = 212.5 – t =−2.36** d = 42
Effort 59.19 24.63 39.84 22.15 46.45 20.66 Z =−3.02*** d = 0.53 t =−1.54 –
corresponds to this circumstance. The average increase of the blink frequency was 20.35% on the solo ride, 12.49% on the co-driver ride and only 1.98% on the interaction ride. Significant with a medium effect are the differences between solo and interaction test rides and with weak significance and slight effect between co-driver and interaction test rides. The differences between solo and interaction driving increase over the course of the experiment and reach their maximum in interval 11. In contrast, no significant differences were observed in interval 15. Between co-driver ride and interaction ride there are significant differences at the beginning of the ride in interval 3 only.
Electrodermal activity: The SCL shows no differences between the mean values of the rides. The tonic value is 0.31μS for solo rides, 0.31μS for co-driver rides and 0.32μS for interaction rides. Over the course, significant differences occur in interval 3 with mean effects between co-driver and solo ride, as well as interaction and solo ride. Here, the SCL value of 0.25μS of the solo ride is significantly below the value of the interaction ride, 0.35μS.
4.4 Driving performance data
The driving performance data are divided into the ve-hicle data and the vigilance data.
4.4.1 Vehicle data
The results of the analysis and comparison of the vehicle data are presented in Table 5 and explained below. For
P3 and P7 no data on steering movements are available as these were not recorded due to a system error.
Small steering movements: The amount of small steer-ing movements with a steersteer-ing angle of less than 5° was 152.15 1/km on average for the co-driver ride and sig-nificantly higher with strong effects compared to 136.62 1/km for the solo ride and 139.08 1/km for the inter-action ride. The latter, on the other hand, show no sig-nificant differences. The effects of the sigsig-nificant differences are stable over all intervals, so that an identi-cal course over time at different levels can be assumed.
4.4.1.1 SDLP The standard deviation of the lateral pos-ition was significantly higher with 0.32 m for solo driving and with strong effects compared to 0.28 m for the co-driver driving and 0.29 m for interaction driving. The significant differences occur across all intervals. The SDLP drops to 0.22 m on the interaction ride in interval 3 and interval 11 and thus shows an overall minimum.
4.4.1.2 MS The average speed in the 100 km/h restricted areas of the route is significantly lower on the inter-action ride with 101.76 km/h compared to 103.61 km/h for the solo ride and 104.30 km/h for the co-driver ride. There is also an overall significant difference between solo and co-driver rides. The significant differences occur between solo and interaction driving from the 7th interval onwards and persist until the 15th interval. The significant differences between co-driving and interactive driving exist across all intervals and have the strongest effects in interval 11.
Table 4Results related to psycho-physiological arousal
Measure Section Solo Ride (S) Co-Driver Ride (C) Interaction Ride (I) Stat. Test S - I
Effect S - I
Stat. Test C - I
Effect C - I
M SD M SD M SD
ECG (SDNN) [ms] Overall 66.36 20.29 72.02 24.37 65.42 23.78 Z =−0.79 – Z =−0.96 –
Intervall 3 61.14 22.70 65.10 20.21 61.31 27.45 t = 0.04 – Z =−1.59 –
Intervall 7 69.78 21.25 70.21 26.60 64.11 27.79 Z =−2.40** d = 0.23 Z =−0.83 –
Intervall 11 67.40 26.64 72.53 29.66 71.07 27.45 Z =−0.24 – t =−0.34 –
Intervall 15 74.37 31.06 77.54 26.77 72.99 25.48 t =−0.32 – Z =−0.90 –
Increase Blinks [%] Overall 20.35 32.24 12.49 27.22 1.98 26.51 t =−2.95*** d = 0.57 t =−1.83* d = 0.36
Intervall 3 7.53 25.04 5.80 17.22 −9.19 17.85 Z =−2.81*** d = 0.58 t =−4.00**** d = 0.78
Intervall 7 32.76 44.18 14.37 31.35 10.32 30.13 t =−2.60** d = 0.50 Z =−1.41 –
Intervall 11 24.26 32.23 12.75 32.96 −0.89 26.17 t =−4.37**** d = 0.84 t =−1.28 –
Intervall 15 17,22 46,72 23,16 44.84 4.76 21.54 t =−1.22 – t = 0.67 –
EDA (SCL) [μS] Overall 0.31 0.11 0.31 0.09 0.32 0.11 t = 0.39 – t = 0.23 –
Intervall 3 0.25 0.14 0.34 0.16 0.35 0.16 t = 2.77*** d = 0.50 t = 0.25 –
Intervall 7 0.32 0.17 0.29 0.13 0.35 0.16 t = 0.75 – t = 2.07** d = 0.37
Intervall 11 0.34 0.17 0.28 0.14 0.33 0.15 t =−0.05 – t = 1.64 –
Intervall 15 0.29 0.17 0.29 0.20 0.33 0.20 t = 0.73 – t = 0.66 –
The number of incidents: The number of incidents over the entire duration of the experiment was 54.84 incidents per test person on the solo ride, 38.74 incidents on the co-driver ride and 42.84 incidents on the interaction ride. The differences between solo driving and co-driver re-spectively interaction driving are significant.
4.4.1.3 Accidents The number of accidents with the median crash barrier or the ditch was 0.58 accidents per test person on the solo ride and 0.13 accidents per test person on the co-driver and interaction ride. Due to the low overall number of accidents, the differences between the rides were only slightly significant. A total of 18 acci-dents occurred on the solo ride and 4 acciacci-dents on each of the other test rides.
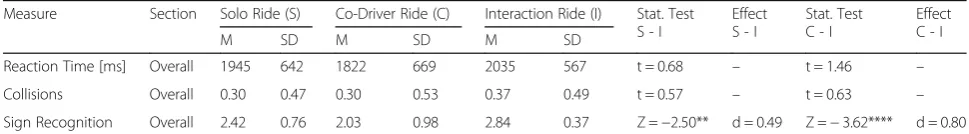
4.4.2 Vigilance
The results of the analysis and comparisons of the vigi-lance data are presented in Table 6 and are explained below. For P9, no data on the reaction time and collision of the solo ride are available, as the simulator suffered a system crash shortly before the hazard situation.
4.4.2.1 Reaction time The reaction time to the wild boar, which entered the traffic lane 120 m ahead of the
vehicle, was 1945 ms for the solo ride, 1822 ms for the co-driver ride and 2035 ms for the interaction ride. The differences between the rides were not significant.
4.4.2.2 Collisions A collision with the wild boar oc-curred in 30% of the trials when driving alone and with the co-driver, and in 37% of the trials when driving with the interaction. These differences were not statistically significant either.
4.4.2.3 Sign recognition Of the incorrectly placed signs, 2.42 out of 3 were recognized on the solo ride and only 2.03 out of 3 on the co-driver ride. On the interaction journey most signs were recognized with 2.84 out of 3 signs. The differences were significant with a slight effect between solo ride and interaction ride and highly signifi-cant with strong effects between co-driver ride and interaction ride.
5 Discussion
The results presented here are used at this point to an-swer the research questions presented at the beginning. Overall, the question arises as to whether the interaction system is a suitable way of avoiding fatigue caused by a Table 5Results related to driving performance
Measure Section Solo Ride (S) Co-Driver Ride (C) Interaction Ride (I) Stat. Test S - I
Effect S - I
Stat. Test C - I
Effect C - I
M SD M SD M SD
SDLP Overall 0.32 0.05 0.28 0.04 0.29 0.05 Z =−4.154**** d = 0.94 t = 1.275 –
[m] Intervall 3 0.29 0.08 0.23 0.06 0.22 0.06 t =−5.197**** d = 0.93 t =−1.293 –
Intervall 7 0.32 0.08 0.26 0.07 0.28 0.06 Z =−2.665*** d = 0.53 t = 1.462 –
Intervall 11 0.31 0.07 0.27 0.06 0.22 0.09 Z =−3.841**** d = 0.82 Z =−2.861*** d = 0.05
Intervall 15 0.34 0.07 0.29 0.06 0.31 0.08 t =−1.981* d = 0.36 t = 1.540 –
MS Overall 103.61 4.45 104.30 3.79 101.76 3.05 Z =−4.498**** d = 0.99 Z =−4.505**** d = 1.07
[km/h] Intervall 3 103.01 4.31 103.71 3.65 102.51 4.17 t =−1.208 – Z =−2.822*** d = 0.44
Intervall 7 103.52 4.96 102.83 3.89 101.67 2.37 t =−2.781*** d = 0.50 t =−2.424** d = 0.44
Intervall 11 104.89 5.92 106.76 7.43 102.71 4.20 Z =−2.332** d = 0.47 Z =−2.979*** d = 0.60
Intervall 15 103.96 5.98 104.18 5.86 102.25 2.93 Z =−2.047** d = 0.45 Z =−1.646* d = 0.40
Incidents [n] Overall 54.84 32.57 38.74 33.04 42.84 31.79 t = 3.205*** d = 0.58 - t = 1.126 –
Accidents [n] Overall 0.58 1.61 0.13 0.56 0.13 0.72 t =−1.813* d = 0.33 t = 0.000 –
*p< 0.1 low significance, **p< 0.05 significance, ***p< 0.01 strong significance, ****p< 0.001 highest significance; Z: Wilcoxon signed-ranks test; t: paired samples t-test;
Table 6Results related to vigilance
Measure Section Solo Ride (S) Co-Driver Ride (C) Interaction Ride (I) Stat. Test S - I
Effect S - I
Stat. Test C - I
Effect C - I
M SD M SD M SD
Reaction Time [ms] Overall 1945 642 1822 669 2035 567 t = 0.68 – t = 1.46 –
Collisions Overall 0.30 0.47 0.30 0.53 0.37 0.49 t = 0.57 – t = 0.63 –
monotonous driving situation. The reference is not only the solo ride, but also the ride with a co-driver.
5.1 RQ1: how does the use of gamification in vehicle driving influence the development of subjective and objective psycho-physiological data and measurements compared to driving alone?
An examination of the psycho-physiological parameters shows that the subjectively perceived fatigue increases significantly less when using the interaction system than when driving alone for the same driving time and dis-tance. The test persons therefore feel less tired after the interaction ride than without the system.
The assumption that this was due to higher stress on the test person could not, however, be confirmed at first glance, since the evaluation of load using NASA TLX shows no significant differences. However, it can also be argued that the NASA TLX as an overall value is not sufficiently suitable to distinguish between under-utilisation and overstrain. Galy et al. [27] have found similar results in a study and therefore suggest to con-sider the dimensions of the NASA TLX individually. This shows that the NASA score in solo driving is mainly caused by a high effort of the test persons, which differs significantly from the other test rides, although objectively the physical as well as mental effort is lowest. The stress therefore does not result from within the task but through the participant’s effort to deal with being under-challenged.
The overall score of the interaction ride, on the other hand, results from a high rating of the mental require-ment. This rating differs significantly from the other rides. As presumed, it is clear that the subjects are chal-lenged to a greater extent by the interaction system. The lower subjective fatigue is therefore due to a less distinct under-utilisation.
The measurement methods used to collect psycho-physiological data provide differing results. The mental strain is shown by ECG data on the SDNN. An increas-ing SDNN indicates higher fatigue [52]. However, the course of the SDNN and the overall average of the two test rides (solo and interaction) are largely identical. There was a significantly lower SDNN for the interaction ride in interval 7 only. It can be concluded that although the fatigue of the test persons reaches the same level over the entire driving time, the interaction system de-lays the occurrence of fatigue. Furthermore, it is possible that the used recording rate of 60 Hz is not sufficiently sensitive to detect further effects [49].
The increase of the blink frequency in relation to the first interval, on the other hand, shows clear effects of the interaction system. The blink frequency with a total increase of only 2% remains almost at its starting level. In comparison, the blink frequency increases by more
than 20% on the solo ride, at times even by more than 30% (interval 7). Compared to the findings of McIntire et al. [61], this shows that the monotonous fatigue of the eyes and thus a decrease in vigilance can be avoided by using the interaction system through the presentation of new stimuli.
The SCL is not able to support this hypothesis at first sight, since the level of SCL in the investigated intervals was almost identical for both test rides. However, a look at the entire course (see Fig.6) provides further informa-tion. There could be a superposition of influences on the SCL. Since the values for the solo rides increase steadily, an increase in fatigue can be deduced due to the absence of further influences on the SCL. During the interaction rides, however, the SCL starts at a higher level with con-tinuous ascents and descents over time. A higher skin conductivity can be observed in all interaction intervals. This is obviously due to the excitement or tension of the subject during the interactions [15, 31]. Subsequently, however, SCL dropped back to a significantly lower level. Nevertheless, no significance could be found for the dif-ferences. In combination with the clear results of the blink frequency it can be concluded that the SCL is only conditionally suitable as a measured quantity due to the superimposition effects.
In summary, the results of the different tests are con-tradicting and don’t give clear enough information to answer the research question in detail.
5.2 RQ2: how does the use of gamification in vehicle driving influence driving performance and safety compared to driving alone?
The standard deviation of the lateral position provides information about the quality of the lateral control. With the SDLP there are significant differences between the rides, whereby the SDLP of the interaction ride is lower with strong effects than that of the solo ride. The test persons were therefore able to significantly improve their driving performance in terms of lateral guidance by using the interaction system. It should be noted that that the effect has decreased significantly in interval 15, caus-ing the SDLP to gradually align. This suggests that even when using the interaction system, the driving task should be gradually interrupted after 2.5 h.
fact that a total of 18 accidents with the centre crash barrier or the side ditch were caused by all test persons during the solo ride shows the drastic extent of such in-cidents. During the interaction ride this risk could be clearly reduced by the system introduction and thus the driving safety could be increased. Here only 4 accidents occurred.
Another important aspect of driving performance is the longitudinal guidance, which can be measured quali-tatively, for example, in compliance with speed limits. For this purpose, we have evaluated the average speed driven in 100 km/h zones. There is a significant differ-ence with strong effects between solo driving and inter-action driving. It is clear that the interinter-action system contributes to a safer driving style. In addition, the mean values of the speed driven are stable during interaction driving, while they increase steadily during solo driving.
The vigilance of the test persons was considered and evaluated as a further component of the driving per-formance. Here the reaction test might have occurred too late to gain any information from the test. This con-clusion can be traced back to the fact that the reaction times to the hazard at the end of the driving test were, with just under 2 s, significantly higher in all driving sce-narios than in attentive drivers. The literature suggests reaction times of 1.2–1.4 s [88, 106]. Since braking was computationally possible in relation to the speed driven, the frequency with which a collision with the wild boar occurred was too high. For all tests, this frequency varied from 30% to 37% and did not differ significantly between the groups.
The sign recognition, on the other hand, shows that the test persons were more vigilant for the driving task due to the interaction system, because significantly more
signs were recognized compared to driving alone. Awareness of the vehicle environment and of current traffic regulations is an important part of the driving task [24]. This once again shows that the interaction sys-tem increases driving safety.
In summary, the research question can be answered as follows. The interaction system significantly improves the driving performance of the test persons compared to solo driving and contributes to an increase in vigilance and thus overall driving safety.
5.3 RQ3: is the interaction system suitable for avoiding fatigue in the same way as a passenger during monotonous journeys?
The last research question can only be answered by a renewed consideration of all measured variables. Psycho-physiological parameters, e.g. the assessment of subject-ive fatigue with the KSS, showed a difference in favour of the co-driver. Even tendencies which could not be proven to be significant by comparison tests indicate for SCL that the passenger interaction is slightly superior to the interaction system with regard to fatigue avoidance. The increases in the blink frequency, on the other hand, are significantly greater for the co-driver ride, indicating higher fatigue.
and showed the greatest violations during the co-driver ride. The number of incidents and accidents, on the other hand, showed no differences.
The vigilance measured through the reaction time and the collisions during hazard was identical. How-ever, the sign recognition was weakest during the co-driver ride. It can therefore be concluded that, accord-ing to the study, fatigue can be avoided with compar-able success when driving with the interaction system and when driving with co-drivers. However, distrac-tions from conversadistrac-tions with the co-driver tended to have a negative effect on driving performance. The topics of conversation during the passenger ride did not offer any potential for conflict and the co-drivers were also urged not to engage in any disputes in order not to influence the trials. Nevertheless, disputes with the co-driver can have a considerable influence on driving safety [99].
5.4 Limitations
Every study has certain limitations that must be taken into account when interpreting the results. Due to the composition of our study, the results reflect the opinion and performance of young adults. Consequently, we can-not generalize our findings to drivers of all ages. How-ever, young drivers are likely to be an important user group of applications for safe driving. The heterogeneity of the examined sample in relation to driving practice also limits the generalizability of the findings, since driv-ing behaviour is experience-related [60]. Similarly, previ-ous experience with driving simulators and computer games may have affected the participants’performance.
Due to the partial need to use the non-parametric Wilcoxon test, which has less ability to detect signifi-cance than parametric tests, quantitative results were often not statistically recorded. A larger sample size would be required to determine the significance of the results. However, our sample size was similar to related studies [81] and sufficient to show effect sizes.
In order to finally ensure that the distraction by the system does not represent a safety-critical risk, the gaze distribution should be examined in further studies. Fur-ther a larger number of hazards should be integrated into the examination concept in order to analyse the re-action times in more detail.
However, in order to achieve the most monotonous route possible, the present study avoided those hazards.
The lack of significant differences in SDNN may have been caused by the controlled laboratory envir-onment. Specifically, the interaction system required a darkened room for optimal visual representation in the head-up display. The driving simulator is also known to cause lower excitation values by reducing the ambient light [73].
6 Conclusion
In a simulator study, we investigated the safety-critical effects of monotony in vehicle driving. Digital technolo-gies and the approach of gamification, which has so far been unused, offer the possibility of permanently inte-grating the driver into the driving task and thus increas-ing safety. This paper presents empirical data that investigate the effects of a gamification concept and con-tribute to a better understanding of monotony and its effects on driving performance.
The investigated intervention contributed to a signifi-cant reduction in speed and thus promotes safe driving. We also found effects that speak for increased attention to the primary driving task, which is reflected both in the driver behaviour data (improved lateral control) and in the physiological data (decreased fatigue signs of vis-ual sensory modality). We can further deduce that the intervention has not only increased attention and excite-ment during the use of the interaction system, but also in between. This is indicated by the improved perception of street signs, which are part of the driving task. This could also be derived from trends in SCL, but could not be confirmed significantly.
The stimuli presented by gamification can thus help to maintain attention and excitement during a journey. In comparison to stimuli caused by communication with a co-driver, the stimuli provided by gamification are di-rected towards the driving task itself. Therefore, the driving task becomes more attractive for the drivers again. This approach ensures that the distraction from the primary task is kept to a minimum. These findings reflect results from Markey et al. [58] and Steinberger et al. [89], whose experiments have shown that engage-ment in repetitive computer-based tasks can be in-creased through additional challenges, performance feedback and rewards.
Future research studies should focus on improving inter-val distances between incipient interactions. A follow-up survey of the test persons showed that the intervals of 10 min between two interactions were too long and the object-ive data also suggest this in parts. Overall, however, the interaction system was very positively received by the test.
Implementation of the interaction concept in practice must ensure that the use of interactions is prevented or interrupted in critical traffic situations. For this purpose, the interaction system must be connected to the vehi-cle’s environmental sensors. Since all results have been obtained in a driving simulator, this study must be re-peated in real traffic before such an interaction system can be used in practice.
Abbreviations
Conductance Level; SD: Standard Deviation; SDLP: Standard Deviation of the Lateral Position; SDNN: Standard Deviation of the R-wave Intervals;μS: Micro Siemens
Acknowledgements Not applicable.
Authors’contributions
BL was leading the research team on“gamification as intervention of fatigue caused by monotony”. He wrote the article by himself with the data provided by following authors. EM wrote his bachelor thesis in the research team about blink frequency and analyzed mentioned data. He also supervised parts of the simulator study. GK wrote her master thesis in the research team about acceptance of the gamification system and analyzed mentioned data. She also supervised parts of the simulator study. KJ wrote her student research thesis in the research team about lateral control and analyzed mentioned data. She also supervised parts of the simulator study. RD wrote his bachelor thesis in the research team about longitudinal control and analyzed mentioned data. He also supervised parts of the simulator study. PM wrote his student research thesis in the research team about monotone track design and implemented the track into the simulator. AB Is the deputy director of the institute and has proofread the article and advised on changes. She is now the corresponding author. All authors read and approved the final manuscript.
Funding
This research project was financially supported by the German Social Accident Insurance Institution for Commercial Transport, Postal Logistics and Telecommunication (BG Verkehr). The authors are fully responsible for the content of this study and publication. We further acknowledge support by the German Research Foundation and the Open Access Publishing Fund of Technische Universität Darmstadt.
Availability of data and materials
The datasets used and/or analysed during the current study are available from the corresponding author on reasonable request.
Competing interests
The authors declare that they have no competing interests.
Received: 3 July 2019 Accepted: 4 October 2019
References
1. Åkerstedt, T., & Gillberg, M. (1990). Subjective and objective sleepiness in the active individual.The International Journal of Neuroscience, 52(1–2), 29–37.
https://doi.org/10.3109/00207459008994241.
2. Åkerstedt, T., Peters, B., Anund, A., & Kecklund, G. (2005). Impaired alertness and performance driving home from the night shift: A driving simulator study.Journal of Sleep Research, 14(1), 17–20. https://doi.org/10.1111/j.1365-2869.2004.00437.x.
3. Al-Houqani, M., Eid, H. O., & Abu-Zidan, F. M. (2013). Sleep-related collisions in United Arab Emirates.Accident; Analysis and Prevention, 50, 1052–1055.
https://doi.org/10.1016/j.aap.2012.08.010.
4. Anund, A., Kecklund, G., Vadeby, A., Hjälmdahl, M., & Akerstedt, T. (2008). The alerting effect of hitting a rumble strip—A simulator study with sleepy drivers.Accident; Analysis and Prevention, 40(6), 1970–1976.https://doi.org/ 10.1016/j.aap.2008.08.017.
5. Arnedt, J. T., Wilde, G. J. S., Munt, P. W., & MacLean, A. W. (2001). How do prolonged wakefulness and alcohol compare in the decrements they produce on a simulated driving task?Accident; Analysis and Prevention, 33(3), 337–344.https://doi.org/10.1016/S0001-4575(00)00047-6.
6. Atchley, P., Chan, M., & Gregersen, S. (2014). A strategically timed verbal task improves performance and neurophysiological alertness during fatiguing drives.Human Factors: the Journal of the Human Factors and Ergonomics Society, 56(3), 453–462.https://doi.org/10.1177/0018720813500305. 7. Bach, W. E., & Müller, H. A. (1981). Beifahrer und Mitfahrer im Straßenverkehr
- Risikofaktoren oder Sicherheitsfaktoren?: Eine Diskussion auf gruppentheoretischer basis.Zeitschrift Für Verkehrssicherheit, 27(2), 60–64. 8. Becker-Carus, C. (2009). Ermüdung. In H. Häcker, K. H. Stapf, C. Becker-Carus,
& F. Dorsch (Eds.),Dorsch Psychologisches Wörterbuch: [15000 Stichwörter, 800
Testnachweise] hrsg. von Hartmut O. Häcker ; Kurt-H. Stapf. Unter ständiger Mitarb. von Christian Becker-Carus(pp. 281–282). Bern: Huber.
9. Bier, L., Negash, S., & Pommeranz, T. (2018). Preventing monotony caused fatigue with driver-vehicle-interaction–A design concept. InArbeit(s). Wissenschaf(f)t–Grundlage für Management & Kompetenzentwicklung: 64. Kongress der Gesellschaft für Arbeitswissenschaft : Frankfurt, 21.-23. Februar 2018 (B.4.2). Dortmund: GfA-Press.
10. Bier, L., Wolf, P., Hilsenbek, H., & Abendroth, B. (2018). How to measure monotony-related fatigue? A systematic review of fatigue measurement methods for use on driving tests.Theoretical Issues in Ergonomics Science, 52(1), 1–38.https://doi.org/10.1080/1463922X.2018.1529204.
11. Boucsein, W. (1988).Elektrodermale Aktivität: Grundlagen, Methoden und Anwendungen. Berlin: SpringerRetrieved from. https://doi.org/10.1007/978-3-662-06968-4.
12. Boyle, L. N., Tippin, J., Paul, A., & Rizzo, M. (2008). Driver performance in the moments surrounding a microsleep.Transportation Research Part F, 11(2), 126–136.https://doi.org/10.1016/j.trf.2007.08.001.
13. Brooks, J. O., Goodenough, R. R., Crisler, M. C., Klein, N. D., Alley, R. L., Koon, B. L., et al. (2010). Simulator sickness during driving simulation studies.Accident; Analysis and Prevention, 42(3), 788–796.https://doi.org/10.1016/j.aap.2009.04.013. 14. Campagne, A., Pebayle, T., & Muzet, A. (2004). Correlation between driving
errors and vigilance level: Influence of the driver‘s age.Physiology & Behavior, 80(4), 515–524.https://doi.org/10.1016/j.physbeh.2003.10.004. 15. Carter, J. R., Durocher, J. J., & Kern, R. P. (2008). Neural and cardiovascular
responses to emotional stress in humans.American Journal of Physiology. Regulatory, Integrative and Comparative Physiology, 295(6), R1898–R1903.
https://doi.org/10.1152/ajpregu.90646.2008.
16. Cooper, M. D. (2000). Towards a model of safety culture.Safety Science, 36(2), 111–136.https://doi.org/10.1016/S0925-7535(00)00035-7. 17. Deterding, S., Dixon, D., Khaled, R., & Nacke, L. (2011). From game design
elements to gamefulness. In A. Lugmayr, H. Franssila, C. Safran, & I. Hammouda (Eds.), Proceedings of the 15th International Academic MindTrek conference on envisioning future media environments-MindTrek‚ 11 (p. 9). New York: ACM Press.https://doi.org/10.1145/2181037.2181040. 18. Dixon, W. J., & Yuen, K. K. (1974). Trimming and winsorization: A review.
Statistische Hefte, 15(2–3), 157–170.https://doi.org/10.1007/BF02922904. 19. Doherty, Andrey, & Gregor. (1998). The situational risks of young drivers: The
influence of passengers, time of day and day of week on accident rates. In B. V. Elsevier (Ed.),Accident analysis and prevention(pp. 45–52). Philadelphia: Elsevier B.V. 20. Drews, F. A., Pasupathi, M., & Strayer, D. L. (2008). Passenger and cell phone conversations in simulated driving.American Psychological Association (Hg) 2008–Journal Of Experimental Psychology, 14(4), 392–400.https://doi.org/10. 1037/a0013119.
21. Drory, A. (1982). Individual differences in boredom proneness and task effectiveness at work.Personnel Psychology, 35(1), 141–151.https://doi.org/ 10.1111/j.1744-6570.1982.tb02190.x.
22. Eoh, H. J., Chung, M. K., & Kim, S.-H. (2005). Electroencephalographic study of drowsiness in simulated driving with sleep deprivation.International Journal of Industrial Ergonomics, 35(4), 307–320.https://doi.org/10.1016/j. ergon.2004.09.006.
23. Fairclough, S. H., & Graham, R. (1999). Impairment of driving performance caused by sleep deprivation or alcohol: A comparative study.Human Factors: the Journal of the Human Factors and Ergonomics Society, 41(1), 118– 128.https://doi.org/10.1518/001872099779577336.
24. Fastenmeier, W., & Gstalter, H. (2007). Driving task analysis as a tool in traffic safety research and practice.Safety Science, 45(9), 952–979.https://doi.org/ 10.1016/j.ssci.2006.08.023.
25. Fletcher, L., Petersson, L., & Zelinsky, A. (2005). Road scene monotony detection in a fatigue management driver assistance system. InIntelligent vehicles symposium(pp. 484–489).https://doi.org/10.1109/IVS.2005.1505150. 26. Forsman, P. M., Vila, B. J., Short, R. A., Mott, C. G., & van Dongen, H. P. A.
(2013). Efficient driver drowsiness detection at moderate levels of drowsiness.Accident; Analysis and Prevention, 50, 341–350.https://doi.org/10. 1016/j.aap.2012.05.005.
27. Galy, E., Paxion, J., & Berthelon, C. (2018). Measuring mental workload with the NASA-TLX needs to examine each dimension rather than relying on the global score: An example with driving.Ergonomics, 61(4), 517–527.https:// doi.org/10.1080/00140139.2017.1369583.