O R I G I N A L R E S E A R C H A R T I C L E
Open Access
Fat Utilization During High-Intensity
Exercise: When Does It End?
Ratko Peric
1*, Marco Meucci
2and Zoran Nikolovski
3Abstract
Background:This study examined substrate oxidation at high-intensity exercise and aimed to determine when fat
oxidation ends (FATmin). We hypothesized the existence of a connection between the anaerobic threshold (AnT) and FATminpoint.
Methods:Breath-by-breath data obtained from indirect calorimetry during a graded treadmill test were used to measure substrate oxidation and maximal oxygen uptake (VO2max) on 47 males (30 athletes (ATL) and 17 non-athletes (NATL)). Pearson correlation coefficient (r) and effect size (R2) were used to test correlations between VO2at AnT and at FATmin. Results:Maximal oxygen uptake (VO2max) was 56.17 ± 4.95 and 46.04 ± 3.25 ml kg−
1
min−1in ATL and NATL, respectively. In ATL, AnT was observed at 87.57 ± 1.30 % of VO2maxand FATminwas observed at 87.60 ± 1.60 % of VO2max.In NATL, AnT and FATminwere at 84.64 ± 1.10 % of VO2maxand 85.25 ± 1.10 % of VO2max, respectively. Our data show large correlations between VO2at AnT and VO2at FATminfor ATL (r= 0.99,p< 0.01, 95 % CI 0.99 to 1.00) and NATL (r= 0.97,p< 0.01, 95 % CI 0.91 to 0.98). The effect size of correlations for ATL and NATL were 0.98 and 0.94, respectively.
Conclusions:Our results show high correlation between AnT and FATminin both ATL and NATL with equal substrate oxidation rates at AnT.
Keywords:Fat, Oxidation, High intensity, Anaerobic threshold, Running
Abbreviations:AerT, Aerobic threshold; AMP, Adenosine monophosphate; AnT, Anaerobic threshold; ATL, Athletes; CHO, Carbohydrates; FATmax, Maximal point of fat oxidation; FATmax, Point at which the fat oxidation ends; FFA, Free fatty acids; GXT, Graded exercise testing; HSL, Hormone sensitive lipase; NATL, Non-athletes; Pi, Inorganic phosphate; RQ, Respiratory quotient; SD, Standard deviation; VCO2, Carbon dioxide production; VO2, Oxygen consumption; VO2max, Maximal oxygen uptake; VT2, Second ventilatory threshold
Key Points
A high correlation between FATminand anaerobic threshold (AnT) exists in both athletes and recreationally active males.
CHO and fat utilization at AnT are equal in both groups.
At intensities above AnT, no presence of lipids in energy expenditure was observed.
Background
It is well documented that carbohydrates (CHO) and lipids are simultaneously oxidized during energy produc-tion. Although proteins are also involved in this process, their contribution to energy expenditure is minimal [17]. At the onset of exercise, there is an increase of glycoly-sis, which drops after several minutes if low or moderate intensity is maintained. During that time, there is an in-crease in fat oxidation in the muscle due to stimulation of lipolysis in adipose tissue, augmented muscle blood flow, possibly enhanced translocation of FAT/CD36 pro-tein into the cell membrane, and the possibility of stimu-lated lipolysis in the muscles themselves through increased levels of hormone-sensitive lipase (HSL) [8]. Intensity of the exercise where there is maximal utilization of lipids as a fuel is referred to as FATmax, which is correlated with * Correspondence:[email protected]
1Institute for Sport and Occupational Medicine Banja Luka, Zdrave Korde 4, 78000 Banja Luka, Bosnia and Herzegovina
Full list of author information is available at the end of the article
aerobic threshold (AerT) [3, 5, 9]. In contrast to CHO oxi-dation, which increases together with the work rate, abso-lute fat oxidation rate declines at high-intensity exercises. Achten et al. [1] introduced the point where fat utilization becomes negligible (FATmin).
During prolonged activities at high-intensity exercises, the main energy source is CHO derived from the muscle and liver glycogen [26]. However, since the body can only store a limited amounts of this metabolic substrate (up to 600 g), prolonged high-intensity physical activity above FATmincould lead to depletion of glycogen stores,
therefore making FATmin an important parameter to
consider when exercising at high-intensity for long pe-riods of time.
Few studies exist which were performed systemically and accurately with the aim of determining the intensity at which FATmin is reached. There are divergent study
findings with previous research since some have shown negligible fat oxidation in cyclists and runners at inten-sities of approximately 80 to 95 % of maximal oxygen uptake (VO2max) [1–3, 27]. Yet, others report that fat
oxidation was not negligible in cyclist and runners while exercising at the 86 and 95 % of VO2max [13, 28]. The
wide range of intensities reported leads to inconsistency of data obtained and may be a consequence of differences between subject fitness levels and a lack of consistency of testing methodologies.
The mechanism behind fat utilization at high intensities has not been fully elucidated and the topic warrants fur-ther discussion. Horowitz and Klein [14] support the hypothesis that reduction of fat oxidation during high-intensity exercise is caused by increased trapping of fatty acids within adipose tissue due to a decrease in blood flow and insufficient removal by the bloodstream. Another fac-tor which can limit fat mobilization during high-intensity exercise is the lactate accumulated in the blood. Lactate promotes re-esterification of free fatty acids (FFA) pro-duced during lipolysis limiting the entry of lipids into the bloodstream [19]. Dyck et al. [9] reported when increased fat is available in the plasma at high-intensity exercises (above 80 % of VO2max), a reduction of glycolysis is
ob-served and the breakdown of muscle glycogen decreases. Also, it has been shown that allosteric regulators (inorganic phosphate (Pi) and adenosine monophosphate (AMP)) play a major role in the regulation of glycogenolysis [17]. Van Loon et al. [29] reported low fat utilization during high-intensity exercises hypothesizing that carnitine acts as a sink for acetyl group storage during continuous accumula-tion of muscle acetyl carnitine when oxygen deficit occurs.
The second ventilatory threshold (VT2) or AnT is often
considered a point of a transition from aerobic to anaer-obic metabolism and a well-established marker of an indi-vidual’s endurance capacity [12]. It varies from person to person and sport to sport. Due to the high individuality of
each parameter, we hypothesize that FATmincould
correl-ate highly with AnT making it a valid indicator of sub-strate utilization and the end point of fat oxidation.
Therefore, the primary aim of this study was to assess the substrate oxidation at high-intensity physical activity and to determine the point at which FATmin occurs in
athletes and non-athletes during a continuous incremen-tal treadmill test. Furthermore, we aimed to explore an existence of relationships between FATminand AnT. Methods
Participants
Forty-seven healthy, non-smoking males (30 athletes (ATL) and 17 non-athletes (NATL)) participated in this study. ATL (basketball, football, and handball) competed at national or international levels and undertook ≥13 h of training per week over the last 8 years. NATL (recre-ational football) performed ≤2 h of physical activity per week for the last 6 months. Subjects were recruited through a voluntary, open-access, online poll. Prior to testing, all subjects completed a questionnaire regarding their exercise and health histories. Informed consent was obtained from all individual participants for whom identi-fying information is included in this article. This research was conducted according to the policies and a guideline provided by the Declaration of Helsinki and was approved by the Institutional ethics committee. Anthropometric values for both groups are presented in Table 1. The body mass and height were assessed as they reported to the laboratory for the first time using a Seca 763 digital med-ical scale and stadiometer (SECA®, Hamburg, Germany).
Subjects were asked to abstain from any laborious physical activity 24 h prior to the testing and instructed to have their last meal 2 h before the testing session. Also, they were asked to refrain from consuming caffeine and nutri-tional supplements on the testing day. Pre-test meals were not standardized. Testing was performed between 09:00 and 12:00 h in the winter period. The laboratory where the study was performed was located 270 m above sea level, and standard conditions were maintained (21 °C and 43 % humidity).
Exercise Protocols
All subjects performed a graded exercise testing (GXT) on a T170D motorized treadmill (COSMED®, Rome, Italy) until
volitional exhaustion to measure gas concentration and to
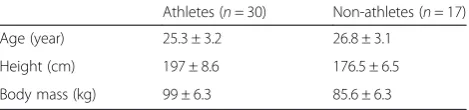
Table 1Anthropometric values of the subjects
Athletes (n= 30) Non-athletes (n= 17)
Age (year) 25.3 ± 3.2 26.8 ± 3.1
Height (cm) 197 ± 8.6 176.5 ± 6.5
Body mass (kg) 99 ± 6.3 85.6 ± 6.3
Values are expressed as means ± SD
calculate the oxidation rate. All subjects were experienced in treadmill exercise testing. Oxygen consumption (VO2)
and carbon dioxide production (VCO2) were assessed
du-ring exercise using a breathe-by-breath Quark PFT Ergo (COSMED®, Rome, Italy) system. Prior to each test session,
a two-point gas calibration for oxygen and carbon dioxide (O216.10 and 20.93 %; CO20.00 and 5.20 %, respectively)
and a turbine flow meter calibration (3-L syringe) were per-formed according to the manufacturers’ recommendation. Fluctuations of breath-by-breath data were minimized using a six-breath smoothing and consequent 30-s aver-aging. An experienced exercise physiologist determined AerT and AnT manually, using the methods described by Meyer et al. [21]. VO2maxwas determined using the
follow-ing criteria: a respiratory quotient (RQ) ≥1.15 or a plateau of VO2in spite of a load increase [15]. The GXT protocol
used consisted of three stages: rest, exercise, and recovery. The resting stage of 2 min standing was performed to ob-tain baseline values. The exercise stage started at 6 km h−1 speed and constant 1 % incline, followed by an increase in speed of 1 km h−1every 2 min until volitional exhaustion. A 3-min active recovery was performed immediately after stopping and required the subjects to run for a further 3 min at the starting speed in order to observe physiological recovery of the subjects. To test the reliability of the proto-col, a repeat test was performed on ten randomly selected subjects under identical laboratory conditions and daytime to avoid circadian variance. VO2max data obtained were
compared with the initial test.
Metabolic Calculations
Substrate oxidation was estimated continuously during GXT by using modified stoichiometric equation from Elia and Livesey [10], which assumed negligible contri-bution of protein oxidation.
RQ = VCO2/VO2if calculated RQ < 0.7 than RQ = 0.7 or if calculated RQ > 1.0 than RQ = 1.0.
CHO % = (5.045 × RQ−3.582) / (0.36 × RQ + 1.103) if CHO % < 0 than CHO % = 0 or if CHO % > 1 than CHO % = 1.0
FAT % = 1.0−CHO %
VO2maxwas expressed as maximum amount of oxygen
in milliliters, used per kilogram of body weight in 1 min (ml kg−1min−1). Fat and CHO utilization was expressed in grams per minute (g min−1) or as percentage of the total energy production. The test results for each indi-vidual were used to create a fat oxidation curve that was in turn used to determine FATmin.
Statistical Analysis
Data were analyzed and presented as mean ± standard de-viation (SD), 95 % confidence interval (CI), and lowest to
highest values using MedCalc 12 (MEDCALC®, Ostend,
Belgium) statistical software. Normal distribution of all measured variables was assessed using the Shapiro-Wilk test with normal distribution accepted for all variables. A Studentttest was used to test-retest reliability of VO2max
protocol with no statistical differences observed (p= 0.76). To assess differences in measured parameters between ATL and NATL, we used Mann–WhitneyUtest. A Pear-son product-moment correlation coefficient (r) was used to assess the linear relationship between VO2at AnT and
VO2at FATmin. Coefficient of determination (R2) was used
to detect the effect size and strength of relationships. Alpha intervals for all hypothesis testing were set atp≤ 0.05 as the level of significance for statistical tests unless stated otherwise.
Results
The subjects’metabolic values are presented in Table 2. As expected, higher VO2max results were found in ATL (95 %
CI 54.32 to 58.05) compared to NATL (95 % CI 44.37 to 47.71) (U= 0.00,p< 0.01). AerT was reached at a 37.01 ± 5.33 ml kg−1min−1VO2(95 % CI 34.02 to 39.56) in ATL
and at a 23.59 ± 4.51 ml kg−1min−1VO2(95 % CI 21.49 to
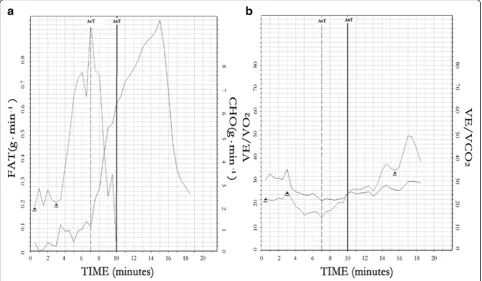
25.33) (U= 28.00, p< 0.01) in NATL. Fat utilization in-creased with exercise intensity until the AerT was reached, followed by a decrease of total fat oxidation and an increase of CHO utilization (Fig. 1).
AnT was reached at a 49.19 ± 6.52 ml kg−1min−1VO2
(95 % CI 46.76 to 51.63) in ATL and at a 38.97 ± 3.26 ml kg−1min−1VO2(95 % CI 37.29 to 40.65) in NATL
(U= 27.00,p< 0.01).
FATmin was obtained at 49.22 ± 6.53 ml kg−1 min−1 of
VO2 (95 % CI 46.78 to 51.66) or at 87.60 ± 1.60 % of
VO2max for ATL and 39.25 ± 3.44 ml kg−1min−1 of VO2
(95 % CI 37.48 to 41.02) or at 85.25 ± 1.10 % of VO2maxfor
NATL (U= 29.00,p< 0.01).
Pearson correlations between VO2at AnT and at FATmin
in ATL (Fig. 2b) and NATL (Fig. 2a) was high (r= 0.99,p< 0.01, 95 % CI 0.99 to 1.00 andr= 0.97, p< 0.01, 95 % CI 0.91 to 0.98), respectively. Effect size for ATL wasR2= 0.98 explaining for 98.01 % of variance. NATL had R2= 0.94 effect size explaining 94.09 % of variance.
Fat oxidation at AnT in ATL and NATL was 0.00 ± 0.00 g min−1(95 % CI−0.00 to 0.00) and 0.02 ± 0.02 g min−1 (95 % CI 0.00 to 0.03) (U= 168.00,p< 0.01), respectively.
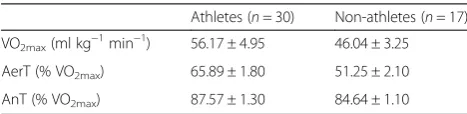
Table 2Subjects metabolic data
Athletes (n= 30) Non-athletes (n= 17)
VO2max(ml kg−1min−1) 56.17 ± 4.95 46.04 ± 3.25
AerT (% VO2max) 65.89 ± 1.80 51.25 ± 2.10
AnT (% VO2max) 87.57 ± 1.30 84.64 ± 1.10
Values are expressed as means ± SD
CHO oxidation at AnT in ATL averaged 4.47 ± 1.24 g min−1(95 % CI 4.01 to 4.93) and provided 97.91 ± 1.02 % (95 % CI 97.52 to 98.29) of the total energy expend-iture. The lowest value was 94.50 % and the highest 99.20 %. CHO utilization in NATL at AnT was equal to 4.17 ± 0.95 g min−1 (95 % CI 3.68 to 4.66) with average
contribution to total energy production of 96.99 ± 2.21 % (95 % CI 95.82 to 98.15). The lowest to highest value was 90.00 to 98.85 %. Mann–WhitneyUtest revealed no differ-ence in CHO oxidation between ATL and NATL at AnT, expressed in g min−1(U= 207.50,p< 0.29) or in percent of total energy contribution (U= 194.00,p< 0.18).
Fig. 1Graphic representation of correlation between AerT and FATmaxand AnT and FATmin.aFat and CHO utilization (g min− 1
) at AerT and AnT in tested subjects (PFT Suite Software, COSMED®, Rome, Italy).bThreshold detection method by EqO2and EqCO2principles [21]
Discussion
The purpose of this study was to assess substrate oxidation during a GXT to exhaustion while determining the point at which FATminoccurs in ATL and NATL. Our secondary
aim was to determine if there was a correlation between VO2at AnT and at the FATmin. Our results showed that
FATminwas obtained at 87.60 ± 1.60 % of VO2maxin ATL
and at 85.25 ± 1.10 % of VO2max in NATL. AnT was
reached at 87.57 ± 1.30 % of VO2maxin ATL and 84.64 ±
1.10 % of VO2maxin NATL. Hetlelid et al. [13] found AnT
in well-trained and recreationally trained athletes to be at 90 and 83 % of VO2max, respectively. Mickelson et al. [20]
found AnT in elite athletes at 83 % VO2max. Our results
coincide with previous studies confirming higher anaerobic capacities in athletes.
Pearson correlations for AnT and FATminin ATL and
NATL were very high (r= 0.99,p< 0.01, 95 % CI 0.99 to 1.00 andr= 0.97,p< 0.01, 95 % CI 0.91 to 0.98), respect-ively. Large effect size explained 98.01 % of variance in ATL demonstrating high strength of connection. The corresponding effect size in NATL explained 94.09 % of variance.
Previous studies examining the variability of substrates utilization at high intensities did not report intensities and total fat and CHO oxidation values when RQ ≥1. Goedecke at al. [11] investigated substrate oxidation at three different intensities and reported RQ of 0.97 at last stage equaling 70 % peak power output. Van Loon et al. [29] performed measurements at different intensities, with the last stage corresponding to 72 % VO2max. RQ
was not reported, but it was stated that fat was contributing up to 25 % to total energy production. Therefore, we esti-mated that last stage RQ was 0.92 ± 0.05. Stepto et al. [28] performed testing at 86 % VO2maxand reported RQ = 0.92.
Coyle et al. [7] performed testing at 80 % VO2maxwithout
reporting RQ but confirmed“high lactate threshold,” lead-ing to an assumption that exercise intensity was under AnT. Romijn et al. [25] performed testing at 85 % VO2max
and reported RQ of 0.91. Hetlelid et al. [13] performed test-ing at 94 and 89 % of VO2maxand reported RQ of 0.88 and
0.95, respectively. The results of these studies suggest that, at the highest measured intensities, subjects were conti-nuously under RQ = 1 or AnT, which may explain why fat oxidation was present.
To the best of our knowledge, there have been no studies on CHO utilization at intensities corresponding to AnT. In our study, ATL had CHO oxidation of 4.47 ± 1.24 g min−1 when RQ = 1.00 contributing to 97.91 ± 1.02 % of total en-ergy production. NATL had 4.17 ± 0.95 g min−1 CHO utilization (RQ = 1.00) and 96.99 ± 2.21 % contribution to total energy expenditure. Rehrer et al. [24] found an aver-age CHO oxidation to be 2.50 g min−1at 70 % VO2maxin
sedentary population, but did not report RQ. Stepto et al. [28] reported CHO oxidation of 4.95 g min−1while cycling
at 86 % VO2max(RQ = 0.92) which is higher than in our
study. Romijn et al. [25] reported CHO oxidation of 3.22 g min−1in male cyclists at 85 % VO2max and RQ =
0.91. Hetlelid et al. [13] reported CHO oxidation of 3.61 g min−1(RQ = 0.88) at 94 % VO2maxand 3.79 g min−1
(RQ = 0.95) at 89 % VO2maxin well-trained and
recreation-ally trained athletes, respectively. Our data is in agreement with these studies; nevertheless, a direct comparison with other studies is difficult due to differences in factors affect-ing CHO utilization (diet, pre-trainaffect-ing meal, age, sex, wea-ther conditions, and testing methodology).
In our study, we used a GXT treadmill protocol with 2-min stages and a constant incline of 1 %. With this type of protocol, we aimed to compensate for the lack of air resistance while running on a treadmill and to obtain more accurate and detailed sample data [6, 18]. The aver-age duration of the exercise staver-age was 16 min in ATL and 12 min in NATL. Numerous authors recommend that tests for VO2maxshould last no longer as 12 min, as
pro-longed tests could lead to inconsistent results [4, 23]. We noticed that athletes could not achieve VO2max within
12 min due to their high endurance capacity, making short test stages more preferable. Finally, this type of protocol is highly correlative to running economy and actual VO2max consumption with outdoor running. This
provided additional reassurance that the protocol used is suitable for accurate measurement of VO2max, correlation
assessment, and physiological testing of athletes in their natural environment [6, 18, 22].
A mechanism behind lipid oxidation at high intensities has not been fully elucidated. With increased intensity, there is a gradual shift from fat as a primary fuel source to CHO, until complete cessation of fat as a fuel for high-intensity exercise. This point, called FATmin, highly
correlates with AnT in our study. It is important to note two things: (1) AnT and FATmin are interchangeable
because they occur at the same individual point and (2) the point at which they occur depends on several factors such as training level and activity type, sex, age, and genetics which could explain both inter-subject and inter-study differences [16].
Additional benefits for athletes and coaches can be sur-mised from this study. The size of the glycogen storage depends on the muscle size, with approximately 500 g lo-cally available (additional 100 g globally available in liver), corresponding to approximately 3000 kcal of produced energy. Since there are no lipids available at intensities above AnT, CHO storage would be depleted after approxi-mately 2 h, contributing towards the effect known as“ hit-ting the wall,”therefore limiting not only athletes but also every subject performing at this level.
sizes including different types of subjects (sedentary, obese, different sports) would allow investigators to fur-ther understand how high-intensity exercise and the lipid oxidation are related. Other limitations include lack of control over the pre-test nutritional habits of the subjects which could have affected fat and CHO oxidation levels. High or low CHO diets could have some impact on total oxidation rates of the substrates making this question open for further studies.
Conclusions
In conclusion, this is the first study to report the point at which fat utilization ends at high-intensity exercise in male athletes and non-athletes. These results confirm our hy-pothesis that FATminand AnT are related and highly
indi-vidual and therefore can be used as a determination end point of fat oxidation and to enhance exercise perform-ance. Our data suggest no presence of lipids and demon-strated equal CHO oxidation levels at intensities matching AnT in both test groups.
Acknowledgements
The study authors would like to thank Pitre Bourdon and Scott Collier for technical and language editing support.
Authors’Contributions
RP contributed to the study design, data collection and analysis, and manuscript drafting. MM and ZN contributed to the study design and manuscript drafting. All authors read and approved the final manuscript.
Competing Interests
Ratko Peric, Marco Meucci, and Zoran Nikolovski declare that they have no conflict of interest, and no financial support was received for the conduct of this study or preparation of this manuscript.
Ethics Approval and Consent to Participate
All procedures performed in studies involving human participants were in accordance with the ethical standards of the institutional and/or national research committee and with the 1964 Helsinki declaration and its later amendments or comparable ethical standards.
Author details 1
Institute for Sport and Occupational Medicine Banja Luka, Zdrave Korde 4, 78000 Banja Luka, Bosnia and Herzegovina.2Department of Health and Exercise Science, Appalachian State University, Boone, NC, USA.3Department of Biochemistry, Aspire Academy, Doha, Qatar.
Received: 26 April 2016 Accepted: 22 August 2016
References
1. Achten J, Gleeson M, Jeukendrup AE. Determination of the exercise intensity that elicits maximal fat oxidation. Med Sci Sports Exer. 2002;34:92–7. 2. Achten J, Jeukendrup AE. Maximal fat oxidation during exercise in trained
men. Int J Sports Med. 2003;24:603–8.
3. Astorino TA. Is the ventilatory threshold coincident with maximal fat oxidation during submaximal exercise in women? J Sports Med Phys Fitness. 2000;40(3): 209–16.
4. Bentley D, Newell J, Bishop D. Incremental exercise test design and analysis: implications for performance diagnostics in endurance athletes. Sports Med. 2007;37(7):575–86.
5. Bircher S, Knechtle B. Relationship between fat oxidation and lactate threshold in athletes and obese women and men. J Sports Sci Med. 2004;3(3):174–81.
6. Billat VL, Hill DW, Pinoteau J, Petit B, Koralsztein JP. Effect of protocol on determination of velocity at VO2maxand on its time to exhaustion. Arch Physiol Biochem. 1996;104(3):313–21.
7. Coyle EF, Coggan AR, Hopper MK, Walters TJ. Determinants of endurance in well-trained cyclists. J Appl Physiol. 1988;64:2622–30.
8. Dyck DJ, Peters SA, Wendling PS, Chesley A, Hultman E, Spriet LL. Regulation of muscle glycogen phosphorylase activity during intense aerobic cycling with elevated FFA. Am J Physiol. 1996;270(1):116–25.
9. Dyck DJ, Putman CT, Hegenhauser GJF, Hultman E, Spriet LL. Regulation of fat-carbohydrate interaction in skeletal muscle during intense aerobic cycling. Am J Physiol. 1993;265(6):852–9.
10. Elia M, Livesey G. Energy expenditure and fuel selection in biological systems: the theory and practice of calculations based on indirect calorimetry and tracer methods. World Rev Nutr Diet. 1992;70:68–131.
11. Goedecke JH, St Clair GA, Grobler L, Collins M, Noakes TD, Lambert EV. Determinants of the variability in respiratory exchange ratio at rest and during exercise in trained athletes. Am J Physiol Endocrinol Metab. 2000; 279(6):1325–34.
12. Ghosh AK. Anaerobic threshold: its concept and role in endurance sport. Malays J Med Sci. 2004;11(1):24–36.
13. Hetlelid KJ, Plews DJ, Herold E, Laursen PB, Seiler S. Rethinking the role of fat oxidation: substrate utilization during high-intensity interval training in well-trained and recreationally trained runners. BMJ Open Sport Exerc Med. 2015:e000047. doi:10.1136/bmjsem-2015-000047.
14. Horowitz FJ, Klein S. Lipid metabolism during endurance exercise. Am J Clin Nutr. 2000;72(2):558–63.
15. Howley ET, Bassett DR, Welch HG. Criteria for maximal oxygen uptake: review and commentary. Med Sci Sports Exer. 1995;27(9):1292–301. 16. Jeukendrup AE. Modulation of carbohydrate and fat utilization by diet,
exercise and environment. Biochem Soc Trans. 2003;31(6):1270–3. doi:10. 1042/bst0311270.
17. Jeukendrup AE. Regulation of fat metabolism in skeletal muscle. Ann N Y Acad Sci. 2002;967:217–35.
18. Jones AM, Doust JH. A 1 % treadmill grade most accurately reflects the energetic cost of outdoors running. J Sport Sci. 1996;14:321–7.
19 Maughan JR, Gleeson M. The biochemical basis of sports performance. 2nd ed. Oxford University Press; 2010.
20 Mickelson TC, Hagerman FC. Anaerobic threshold measurements of elite oarsmen. Med Sci Sports Exer. 1982;14(6):440–4.
21 Meyer T, Lucia A, Earnest CO, Kindermann W. A conceptual framework for performance diagnosis and training prescription from submaximal gas exchange parameters—theory and application. Int J Sports Med. 2005;26(1):38–48. 22 Mooses M, Tippi B, Mooses K, Durussel J, Mäestu J. Better economy in field
running than on the treadmill: evidence from high-level distance runners. Biol Sport. 2015;32(2):155–9.
23 Pierce S, Hahn A, Davie A, Lawton E. Prolonged incremental tests do not necessarily compromise VO2maxin well-trained athletes. J Sci Med Sports. 1999;2(4):356–63.
24 Rehrer NJ, Wagenmakers AJM, Beckers EJ, Halliday D, Leiper JB, Brouns F, Maughan RJ, Westerterp K, Saris WHM. Gastric emptying, absorption and carbohydrate oxidation during prolonged exercise. J Appl Physiol. 1992; 72(2):468–75.
25 Romijn JA, Coyle EF, Sidossis LS, Zhang XJ, Wolfe RR. Regulation between fatty acid delivery and fatty acid oxidation during strenuous exercise. J Appl Physiol. 1995;79:1939–45.
26 Rapoport BI. Metabolic factors limiting performance in marathon runners. PLoS Comput Biol. 2010;6(10), e1000960. doi:10.1371/journal.pcbi.1000960. 27 Sidossis LS, Gastaldelli A, Klein S, Wolfe RR. Regulation of plasma fatty acid oxidation during low- and high-intensity exercise. Am J Physiol. 1997;272(6): 1065–70.
28 Stepto NK, Martin DT, Fallon KE, Hawley JA. Metabolic demands of intense aerobic interval training in competitive cyclists. Med Sci Sports Exer. 2001; 33:303–10.