Nanfeng Z h u . Chiaki Tanaka 9 Tadashi Ohtani Hiroshi U s u k i
Automatic detection of a damaged cutting tool during machining I: method
to detect damaged bandsaw teeth during sawing
Received: February 3, 1999 / Accepted: December 3, 1999
Abstract This paper presents an on-line method for detect- ing damaged teeth in the bandsaw using acoustic emission (AE) signal energy. The method is based on an analysis of differences in A E energies generated by normal and dam- aged teeth during sawing. Because of the difference in the amount of sawing, the A E energy was low for sawing by the damaged tooth and high for sawing by the normal tooth immediately after the damaged tooth. The ratio of A E en- ergy for two successive teeth - a normal tooth immediately following a damaged tooth - was much greater than 1, whereas the ratio of A E energy for two successive normal teeth was close to 1. The results demonstrate that the tech- nique using the A E energy ratio for two successive teeth is effective for on-line detection of damaged bandsaw teeth. Key words Acoustic emission. Damaged bandsaw teeth 9 Two successive teeth - A E energy ratio
Introduction
In recent years, more efficient sawing methods have been sought with the objectives of improving sawing accuracy, reducing kerf, and in turn increasing lumber yield. One way to achieve these objectives is to monitor the sawing process automatically. A possible method for automatically moni- toring the sawing process is to use acoustic emission (AE) measurements, which have enabled on-line monitoring of the cutting behaviors for various cutting conditions. 1~
N. Zhu. C. Tanaka ([]). T. Ohtani 9 H. Usuki
Faculty of Science and Engineering, Shimane University, Matsue 690-8504, Japan
Tel. +81-852-32-6562; Fax +81-852-32-6598 e-mail: [email protected] p
Part of this paper was presented at the 9th Annual Meeting of the Chugoku Skikoku Branch of the Japan Wood Research Society, Tottori, October 1997
Machining control systems using A E signals have been proposed to produce a desired surface finish by automatic control of the workpiece feed rate for circular sawing and routing. 5'6 Many researchers have used A E measurement techniques for identifying the wood machining process and sensing tool wear. 7-10 However, the use of the technique is limited to tool failure. The detection of tool failure, which includes cracking, chipping, and fracture of the tool during cutting, is more important than sensing tool wear. The rea- sons are that (1) tool failure is a stochastic process and is more difficult to predict and detect than tool wear, and (2) tool failure is apt to cause fatal damage to the product. Therefore it must be avoided or immediate measures taken once it happens, n
During actual production, bandsaw teeth are sometimes damaged by sawing pieces of metal, small stones, and un- usually hard knots. A bandsaw with damaged teeth ad- versely affects the surface roughness, sawing accuracy, and other normal teeth. This study investigates the possibility of detecting damaged teeth on a bandsaw during sawing by using A E signal measurement technology.
Experimental procedures
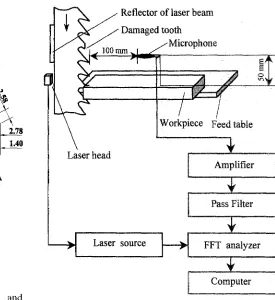
Cutting conditionThe sawing was conducted using a woodworking bandsaw with 700mm wheel diameter and a distance between the wheel axles of 1250mm. The saw blades had a length of 4700mm, width 75mm, thickness 0.75mm, gullet depth 5 mm, tooth pitch 20mm, and number of teeth 235. Four saw blades were used in this experiment. One of them was the normal tooth, and the others consisted of one, two succes- sive, and three successive damaged teeth. Figure i shows the damaged tooth in the bandsaw blade used for the experiment. The sawing velocity and the feed speed were kept at 13.3m/s and 3m/min in the experiment. The workpiece for the experiment was yellow poplar
2.78 1.40
Unit: mm
Fig, 1. Damaged tooth in the bandsaw blade
12%-14%, specific gravity 0.51, thickness 20mm, and length 300 mm.
A E signal measurement method
~ ~ Damaged tooth
II , - ~ i ~ / M i c r o p h o n e ]~" ( I..4 l O O m m ~ l ~
~ o r k p l e c e Feed table
L a s e r h e a d ~ A m p l i f i e r j
q
Laser s o u r c eI
]
FFT nalyz0r 1
i
]
Fig. 2. Experimental setup used for acoustic emission (AE) signal acquisition, digitization, and processing. FFT, fast Fourier transform
A microphone, amplifier, high-pass filter, fast Fourier transform (FFT) analyzer, and a personal computer were used to measure the A E signal, as shown in Fig. 2. The microphone was used as the A E sensor, which was posi- tioned at a height of 50mm from the top of the workpiece and 100ram away in the front of the sawteeth. The micro- phone responded up to 100kHz with uniform sensitivity. The A E signal was measured on the frequency range be- tween 35 and 100kHz through the pass filter. The FFT analyzer recorded data at a rate of 256 sample points per millisecond. The A E signal data recorded in the FFT analyzer were transmitted to the personal computer. The A E signal was measured for two cases. One was the A E signal for sawing by several teeth including the damaged teeth. The other was the A E signal for the whole sawing process.
A laser beam was used to recognize the A E signal for sawing by the damaged teeth. A reflector for the laser beam was attached on the back edge of the saw blade in line with the damaged tooth positions as shown in Fig. 2. This allowed measurement of the A E signal for sawing by the damaged teeth. The input laser intensity signal was con- nected to the trigger of the FFT analyzer to record the A E signal for sawing by the reflector portion of the saw blade. The laser beam was continuously energized during sawing. As soon as the laser beam hit the reflector, the size of the laser reflection signal suddenly reached a set level and auto- matically triggered the recording of the A E signal for saw- ing by the damaged teeth.
Results and discussion
Figure 3 shows the A E signal, A E energy, and AE energy ratio of two successive teeth from sawing by several teeth including a damaged tooth. A workpiece of 20ram thick- ness, which was equal to the tooth pitch of the bandsaw, was used to identify the A E signal generation per tooth, It was observed that the amplitudes of the A E signals for normal teeth (T1, T2, T3, Tv) were almost equal. As tooth T~ was missing its tip. it did not saw like a normal tooth. Therefore. the amplitude of the A E signal for T~ was smaller than that for T1, T2,
T3, and %. As a result, the following normal tooth
(Ts) had to cut an increased amount of wood to make up for the damaged tooth (T4). Therefore. the amplitude of the A E signal from sawing by tooth Ts was the largest. The amplitude of the A E signal for tooth •6 was larger than that for teeth T1, T2, T3, and % because of the influence of the attenuated A E signal of tooth Ts.Time (ms)
Fig. 3. A E signal, A E energy, and A E energy ratio of two successive teeth for several teeth including a damaged tooth. T~-T 3 and Ts-T7 are normal teeth; T 4 is the damaged tooth. E 1 - E 7 are A E energy values for teeth T1-T 7
considers signal amplitude only indirectly in that a large- amplitude signal often lasts longer than a low-amplitude signal; and (3) there is no direct relation between the count and a physically meaningful parameter. One of the primary methods for quantitatively presenting acoustic emission data is by measuring the energy of the A E signal. ~3 In this study, the method of A E energy analysis was used.
The energy of a transient signal can be defined as .3
where D is A E energy of a transient A E signal,
V(t)
is the instantaneous voltage, and R is the input impedance of the voltage measuring circuit. In discrete form, which is suitable for digital processing, Eq. (1) becomes6O
i &
30
0
0 2
Sawing time (s)
Fig. 4. AE energy ratio of two successive teeth during the sawing process by the bandsaw with a damaged tooth
A ~ m
ER = ~ ' ~ V ~ (2)
R i=1
where ER is A E energy during an interval time, V~ is the voltage at each sample point, and
At
is a time interval be- tween samples. In this study, the time interval(At)
for calcu- lating A E energy is defined as the sawing time per tooth. That is, as the bandsaw velocity was 13.3 m/s and tooth pitch was 20ram, At was 1.5ms. Therefore, the number of sample points of the voltage was 384. Because the A E signal passed through the same circuit for the same period of time, the impedance R was not considered. The A E energy per tooth can be calculated by10.5
384
En = 1.5 • (3)
j-1
where En is the A E energy from sawing by the/1/th tooth, and is the voltage point in the n th tooth sawing time. The ratio of A E energy (A C) due to sawing by two successive teeth, that is, by the/2 th tooth and the (r/-1) th tooth, can be calcu- lated by the equation
A C - En
(4)E n 1
In Fig. 3, E~ to E7 show the A E energy for teeth T1-T7. The A E energy showed the same tendency as the amplitude of the A E signal. That is, the A E energy was the smallest for tooth Y 4 and largest for tooth T 5. The A E energy for the other normal teeth (Tx, T2, T3, Y6, T7) was an intermediate value. The
E2/E~,
andEa/E2
ratios were approximately 1.The
E4/E3, E6/Es,
andET/E6
ratios were less than 1. TheEJ
(1) Er ratio was about 18. This demonstrates that the A E en- ergy ratio for two successive teeth can easily distinguish a damaged tooth, the normal tooth immediately after the damaged tooth, and other normal teeth.
.g 0
m
<
-2
I TAxi TA2 I TA3 I TA4 IT^5 ] TA6 [ TA7[
Ah
Ah
Ah
Ah
At5
At6
A%
2 SUCceSSIVe 2 s u c c e s s i v e ~ SUCcessive
[ normal teeth [ damaged teeth[
normal
teeth
[
Bandsaw A
>
g2
<-2
I Tm [ TB2 [ Tm [ TB4 [ TBS [T~ [ TB7 [
normal
3 successive
" 3 successive
[ tooth [ damaged teeth
[
normal
teeth
I
Bandsaw B
0
12
Time (ms)
Fig. 5. AE signal due to sawing by several teeth including two (bandsaw A) and three (bandsaw B) successive damaged teeth. TAI , TA2 , and TAS--TA7 are normal teeth; TA3 and TAg are damaged teeth; Tm and TBs-TB7 are normal teeth; TB2-Ts4 are damaged teeth. Ati, sawing time by tooth TAi, and TBi (i = 1-7)
damaged tooth. The ratio of A E energy for two successive teeth was calculated by Eq. (4). It was found that the ratio increased abruptly after every 0.35 s. This sawing time inter- val corresponded to the time for one revolution of the bandsaw. This behavior was caused by the fact that the ratio of A E energy for two successive normal teeth was almost 1, and that the ratio of A E energy for the damaged tooth and the normal tooth immediately following, was much greater than 1. Therefore, the periodically increased ratio is consid- ered to be caused by the damaged tooth. This result indi- cates that the method to investigate the A C described above (A C method) is effective for on-line detection of a damaged tooth.
Figure 5 shows the A E signal for several teeth including two (bandsaw A) and three (bandsaw B) successive dam- aged teeth. TA3 and TAg w e r e two successive damaged teeth. TB2, TB3, and TB4 were three successive damaged teeth. Be- cause all the damaged teeth did not saw like normal teeth, the amplitude of the A E signal for successive damaged
A bandsaw B
~
I
40
/
/
/
E 3 0 / g t \ L
// \ \
10
0
T1 T2 T3 3"4 T5 1"6 T7
Saw teeth T1 to T7
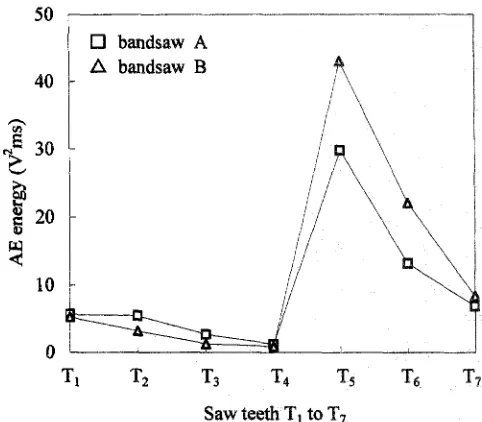
Fig. 6. AE energy for teeth Ti-T 7 of bandsaws A and B~ T1, T2, and Ts- Tv are normal teeth; T3 and T4 are damaged teeth in bandsaw A. T~ and Ts-T 7 are normal teeth; T2-T 4 are damaged teeth in bandsaw B
teeth decreased. The amplitude of the A E signal for tooth TB5 was larger than that for tooth TA~ because of the in- creased amount of sawing by tooth TBs. Figure 6 shows the A E energy for teeth TI-T7 of bandsaws A and B. l~he A E energy was smallest for the sawing by the last damaged tooth, and the energy was almost the same for •A4 and TB4.
Among the normal teeth, the A E energy was largest for the normal tooth immediately after the damaged tooth, and the energy was larger for TB5 than for TAS. Therefore. the A E energy ratio of EBs/EB4 was larger than that of
EAs/EA4.
The ratio of A E energy for the damaged tooth and the following normal tooth increased with increasing numbers of suc- cessive damaged teeth for the number of damaged teeth investigated. Using this method may be difficult, however. for detecting the successwe damaged teeth of the specific bandsaw with irregular tooth pitch. This problem will be discussed in further studies.In the workpiece variables including earlywood and late- wood. the number of growth rings, the density of the wood. and the knot size and distribution are believed to affect the amplitude of the A E signal. Therefore. application of the A C method was directed to a workpiece including knots. Figure 7 shows the AE signal. A E energy, and A E energy ratio of two successive teeth from sawing a workpiece with a knot by normal teeth T1 to Tso. The knot appeared to have a great influence on the A E signal based on the experimen- tal observation. The amplitude of the A E signal increased rapidly after sawing by the 24 th tooth, which began to saw the hard knot. because of its high density and the disorder of the fiber direction around the k n o t . TM
E1-Eso
represent the A E energy for teeth T1-Ts0. The A E energy showed the same tendency as the amplitude of the AE signal: that is. the A E energy was low for sawing the normal part and high for sawing the knot part. The A E energy for teeth after the 24 th>
<
2 TI'~2
-2
T24 T25
1
I I
120
8o
40
0
40
El E9 El3
I
~
E~3a:- &
20
J
0 75
Time (ms)
Fig. 7. A E signal, A E energy, and A E energy ratio of two successive teeth from sawing a workpiece with a knot by normal teeth T1-Ts0.
E~-Eso
are A E energy values for teeth T1-Ts0During sawing the normal part, the A E energy ratios of
EIo/E 9 and
E14/E13
w e r e between 1 and 5, respectively. This can be explained by the fact that the wood was not homoge- neous in structure.At the transition period from normal wood to the knot portion, the A E energy for successive normal teeth increased gradually. A E energy E23-E2a for teeth T23-T2s showed this phenomenon. The
E24/E23
ratio was about 5. This ratio was small comparing with the A E energy ratio for the damaged tooth and the normal tooth immediately fol- lowing, as shown in Fig. 3. However, because of the com- plex wood structure in this part, the ratio for two successive normal teeth may be large, like that for a damaged tooth and the normal tooth immediately following, although this situation was not found in this experiment. If this situation occurs, the damaged tooth still can be detected by observing the periodically increased ratio due to the damaged tooth in sawing normal wood, as shown in Fig. 4.60
al 30
al
,,ul,.,~,,mJ_ . ,~,,a,ak.,h,lk_,,a,.,la ... I.aJ,.,.LJd~ . . .
0 2
Sawing time (s)
Fig. 8. A E energy ratio of two successive teeth during sawing of the part of the workpiece with a knot by the bandsaw with normal teeth
While sawing the knot, the A E energy ratios from E28/E;7
to Eso/E49 for two successive teeth were nearly 1. This occurs because the A E energy for each tooth was high, however the difference in A E energy between two adjacent teeth was relative small.
During the transition period from knot to normal wood, the A E energy for successive teeth decreases. If the dam- aged tooth happens to saw this part, the ratio of A E energy for the damaged tooth and the normal tooth immediately following, may not be easily distinguished from that for two successive normal teeth. However, as described above, by observing the periodically increased ratio caused by the damaged tooth when sawing the normal part, as shown in Fig. 4, the damaged tooth still can be detected.
Figure 8 shows an example of the A E energy ratio of two successive teeth while partially sawing the part of the workpiece with a knot by the bandsaw with normal teeth. A periodic large value was not observed in the A E energy ratios (A C), though the A E energy for each normal tooth was high, as shown in Fig. 7. This phenomenon proves that knots do not influence use of the A C method for detecting a damaged tooth. The A E signal, A E energy, and A E en- ergy ratio of two successive teeth when a knot was sawn by several teeth including a damaged tooth are shown in Fig. 9. T 1 - T 7 w e r e the same teeth as in the situation shown in Fig.
3. El-E7 were the A E energies for teeth T1-T 7. It was ob- served that the amplitude of the A E signal, A E energy, and A E energy ratios for T 1 - T 7 showed the same tendency as described in Fig. 3. That is, the amplitude of the A E signal and A E energy for the damaged tooth (T4) were the small- est, and those for the normal tooth immediately after the damaged tooth T5 were the largest. The E2/E] and E3/E2
ratios were approximately 1. The E4/E3, E6/Es, and ET/E 6
0 ' '
-2.5 600
>
300
0
20
Ex E~ E~
I0
0 0
E~E, E/E~
" - " " - - 4
Time (ms)
10.5
Fig. 9. AE signal, AE energy, and AE energy ratio of two successive teeth while sawing a knot by several teeth including a damaged tooth. T~-T7 are the same as those in Fig. 3. El-E7 are AE energy values for teeth T I - T 7
F i g u r e 10 shows an e x a m p l e of the A E e n e r g y ratio of two successive t e e t h while p a r t i a l l y sawing the p a r t of the w o r k p i e c e with a k n o t b y the b a n d s a w with a d a m a g e d tooth. It was f o u n d that the ratio i n c r e a s e d a b r u p t l y every 0.35 s. This t i m e interval c o r r e s p o n d e d to the time for one r e v o l u t i o n of the bandsaw. This m e a n s that the p e r i o d i c a l l y i n c r e a s e d ratio was c a u s e d b y the d a m a g e d tooth. T h e r e - fore, this m e t h o d , using the A E e n e r g y ratio for two succes- sive teeth, is c o n s i d e r e d effective for on-line d e t e c t i o n of a d a m a g e d t o o t h when sawing w o r k p i e c e s with and w i t h o u t knots.
Conclusions
T h e conclusions o b t a i n e d in this study are s u m m a r i z e d as follows.
30 1
0 2
Sawing time (s)
Fig. 10. AE energy ratio of two successive teeth during sawing of the part of the workpiece with a knot by the bandsaw with a damaged tooth. The length of the knot was about 25rnm
1. B e c a u s e of the difference in the a m o u n t of sawing, A E energy was low for sawing b y the d a m a g e d t o o t h a n d high for sawing by the n o r m a l t o o t h i m m e d i a t e l y after the d a m a g e d tooth. T h e A E e n e r g y r a t i o for the d a m - aged t o o t h and the n o r m a l t o o t h i m m e d i a t e l y following, was m u c h g r e a t e r t h a n 1. H o w e v e r , the A E e n e r g y ratio for two successive n o r m a l t e e t h was a l m o s t 1.
2. T h e A E e n e r g y ratio for the d a m a g e d t o o t h and the n o r m a l t o o t h i m m e d i a t e l y following, i n c r e a s e d with in- creasing n u m b e r s of successive d a m a g e d t e e t h for the n u m b e r of d a m a g e d t e e t h investigated.
3. T h e A E e n e r g y f r o m sawing a h a r d k n o t was l a r g e r t h a n that for n o r m a l wood. T h e A E e n e r g y ratio in a work- piece with a k n o t sawn b y a b a n d s a w with a d a m a g e d t o o t h i n c r e a s e d a b r u p t l y after a constant time interval, c o r r e s p o n d i n g to the t i m e for one r e v o l u t i o n of t h e bandsaw.
4. It is possible to d e t e c t d a m a g e d b a n d s a w t e e t h a u t o m a t i - cally using the A E energy r a t i o for two successive teeth.
References
1. Tanaka C, Nakao T, Nishino Y, Hamaguchi T, TakahashiA (1992) Detection of wear degree of cutting tool by acoustic emission signal (in Japanese). Mokuzai Gakkaishi 38:841-846
2. Murase Y, Ike K, Mori M (1988) Acoustic emission monitoring of wood cutting. II. Effect of slope angle of grain on AE characteris- tics (in Japanese). Mokuzai Gakkaishi 34:271-274
3. Murase Y, Torihara N (1990) Acoustic emission monitoring of wood cutting, III. Effect of cutting angle on AE characteristics in cutting parallel and perpendicular to the grain (in Japanese). Mokuzai Gakkaishi 36:269-275
4. Cyra G, Tanaka C, Yoshinobu M, Nishino Y (,!998) Effect of helical angle of router bit on acoustic emission. J Wood Sci 44:169- 176
6. Tanaka C, Cyra G, Nakao T, Yoshinobu M, Katayama H (1997) On-line control of router feed-speed in routing. Mokuzai Gakkaishi 43:544-550
7. Murase Y, Ike K, Mori M (1988) Acoustic emission monitoring of wood cutting. I. Detection of tool wear by A E signals (in Japanese). Mokuzai Gakkaishi 34:207-213
8. Lemaster RL, Klamecki BE, Dornfeld D A (1982) Analysis of acoustic emission in slow speed wood cutting. Wood Sci 15:150-160 9. Lemaster R, Tee L (1985) Monitoring tool wear during wood
machining with acoustic emission. Wear 101:273-282
10. Cyra G, Tanaka C, Nakao T (t996) Effect of router tool wear on A E count rate. J Mater Sci Jpn 45:403-409
11. Moriwaki T (1980) Detection for cutting tool fracture by acoustic emission measurement. Ann CIRP 29(1):35-40
12. One K, Stern R, Long M (1972) Application of correlation analysis to acoustic emission. ASTM STP 505:152-163
13. Beattie A G (1976) Energy analysis in acoustic emission. J Mater Process Technol 58:73-78