https://doi.org/10.5194/jsss-8-207-2019
© Author(s) 2019. This work is distributed under the Creative Commons Attribution 4.0 License.
Double entry method for the verification of data a
chromatography data system receives
David Thomas Marehn1,2,3, Detlef Wilhelm1, Heike Pospisil2, and Roberto Pizzoferrato3 1AnaTox GmbH & Co. KG, 15517 Fuerstenwalde, Germany
2TUAS Wildau, High Performance Computing in Life Sciences, 15745 Wildau, Germany
3Dipartimento Ingegneria Industriale, Università degli Studi di Roma “Tor Vergata”, 00133 Rome, Italy
Correspondence:David Thomas Marehn ([email protected])
Received: 29 September 2018 – Revised: 9 April 2019 – Accepted: 25 April 2019 – Published: 17 May 2019
Abstract. The importance of software validation increases since the need for high usability and suitability of software applications grows. In order to reduce costs and manage risk factors, more and more recommendations and rules have been established. In the field of pharmacy the vendors of so-called chromatography data systems (CDSs) had to implement the guidelines of the Code of Federal Regulations Title 21 (CFR 21) during the last few years in order to fulfill the increasing requirements. The CFR 21 part 11 deals with electronic records and signatures. This part is binding for each company in the regulated environment that wishes to create, edit and sign electronic information instead of printing them on paper. Subsection CFR 21 part 11.10(h) explains how to perform an input check for manual user entries as well as for data that will be collected from an external device. In this article we present an approach performing the double entry method on data provided by the hardware instrument in order to investigate possible influences on the raw data by the handling CDS.
A software tool has been written which allows us to communicate with a high-performance liquid chromatog-raphy (HPLC) detector and acquire data from it. The communication is completely independent of a CDS which is started separately and connected to the same system. Using this configuration we made a parallel data ac-quisition of two instances at the same time possible. Two CDSs have been tested and for at least one of them it has been shown that a comparison of the acquired data can be done as with the double entry method for the data verification. For the second CDS we checked whether it would be applicable after a few modifications. The given approach could be either used for a live data verification of produced raw data or as a single test during a software operational qualification to verify the data acquisition functionality of the software.
1 Introduction
High usability and suitability, risk management and data in-tegrity are terms more and more users of software applica-tions have to consider when they integrate them into their standard operating procedures. Especially in the fields of medicine, pharmacy and the food industry any occurrence of risk to patients and customers leads to the usage of software applications whose developers established the principles of software validation in their software development life cycle. Following these guidelines helps to reduce long-term costs, failure rates and recalls (Center for Biologics Evaluation and Research Center for Devices and Radiological Health, 2002).
procedures like input checks, encryption, signatures and au-dit trails.
For this article we focused on point (h) of subpart 11.10: Use of device (e.g., terminal) checks to determine, as ap-propriate, the validity of the source of data input or oper-ational instruction(Office of the Federal Register and Na-tional Archives and Records Administration, 2017). That means manually entered as well as automatically incoming data given to the software application (e.g., CDS) have to be validated and verified. The validation of data ensures sensible and reasonable inputs. Manual entries of data or automati-cally received data can be validated by checks for length, for-mat and range (Bitesize, 2014a). The data verification on the other hand ensures that the incoming data match the original one. For manual entries there are two methods for the data verification (Bitesize, 2014b). The data could either be en-tered twice by two separate persons and compared afterwards using the double entry method or the entered data could be proofread using the original data as a reference. Both meth-ods are time-consuming, especially when data are collected manually. The comparison of received data with a reference could be handled relatively quickly using an algorithm ex-ecuted by a computer. But what about data provided by an analytical instrument like a HPLC system? Usually there are no reference data inside the instrument available for proof-reading and the data will be acquired once by the connected controller, the CDS software package installed on the com-puter. To fulfill CFR 21 part 11.10(h) for data collected from an external instrument, an interpretation of this part says that a suitable connection between the hardware system and the controller and an identity verification of the source data is required (Ofni Systems, 2017). One suitable connection type is based on the TCP/IP protocol which uses handshakes and checksums in order to guarantee reliable transport of the data. But for the user themselves it is not apparent whether there happen to be any faults when preparing the data for the trans-port within the device or whether the acquiring software pro-cesses the raw data before making them available for export. We show how to perform the double entry method for the provided data of a HPLC system manufactured by Agilent Technologies based on parallel data acquisition using two in-stances that communicate with the instrument at the same time.
is able to connect to a HPLC system manufactured by Ag-ilent Technologies. In contrast to a fully functional CDS, our tool searches for a detector module in the HPLC clus-ter and uses as little access as possible in order to acquire its signal data only. The necessary communication is based on the freely availableLICOP library provided by Agilent Technologies (Agilent Technologies, 2016). This library es-tablishes a TCP/IP connection to the HPLC detector and pro-vides several channels dealing with the module like sending instructions, monitoring, or acquiring raw data. After a suc-cessful connection the tool uses the two instructions
RAWD:SIGSTOR:SET "SourceNumber" RAWD:SIG:SET "SourceNumber"
without quotation marks and send them via an instruction channel in order to subscribe to the raw data from the given source number. The source number depends on the given type of HPLC detector and the desired signal. Additionally these commands involve a module firmware “B.x” and higher (Agilent Technologies, 2014). All experiments in this article are done with a diode array detector and the desired signal is absorbance signal no. 1 of the detector. Therefore source number 0 has been chosen here. After the subscription to the data the so-called RAWD channel defined in theLICOP li-brary will handle incoming data and provide it for the tool. This way it is possible to connect to the HPLC instrument even after the lock of the parallel-running CDS. A LAN con-nection to the HPLC system which allows two instances is necessary only. This can be handled by one LAN card that allows two instances or by two LAN cards in two different HPLC modules.
2.1 Analytical instruments
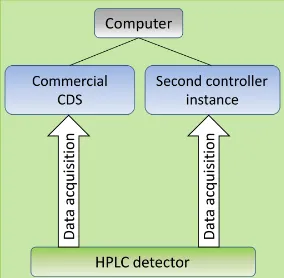
Figure 1.The whole configuration using theSecond Controller In-stancefor a parallel data acquisition. It runs concurrently with the commercial chromatography data system (CDS) which parameter-izes the HPLC system and starts/stops all experiment sequences.
degasser, G1311A quaternary pump, G1329A standard au-tosampler, G1316A column compartment and G1315D diode array detector.
All experiment sequences shown in Fig. 2 using a network protocol analyzer have been done with HPLC system B.
2.2 Chemicals
All experiments with the Second Controller Instancehave been done using an isocratic test sample containing the four substances dimethyl phthalate, diethyl phthalate, biphenyl and o-terphenyl. These components were solved in methanol. The mobile phase consisted of a mix of 35 % vol HPLC-grade water and 65 % vol Acetonitrile and the stationary phase was an installed Zorbax xDB-C8 column supplied by Agilent Technologies according to a reverse-phase chro-matography configuration. The column had a length of 50 mm, a diameter of 4.6 mm and a pore size of 1.8 µm.
For the network tracking experiments a simpler configura-tion was used. The sample was 50 µg mL−1 caffeine solved in HPLC-grade water. The mobile phase was HPLC-grade water. Due to one single substance in the sample no separa-tion was needed, and so a restricsepara-tion capillary was installed instead of a separation column.
2.3 Experiment setup
Two setups have been created. The first one was used to eval-uate the reliability of a second instance acquiring data in par-allel for the double entry method. The second setup included a network tracking to examine possible processing of the raw data provided by the device during the storage procedure.
2.3.1 Second Controller Instance
The complete HPLC systems A and B were parameterized and controlled by commercial CDSOpenLab ChemStation®
Figure 2.The network tracking of the data transmitted using TCP over the ethernet bypasses the not well-known storage procedure of the acquired raw data of the commercial CDS.
(Rev. C.01.07 Build 27) developed and published by Agi-lent Technologies or byChromeleon®(Rev. 6.80 SR15 Build 4656) developed and published by Thermo Fischer without any influence of the Second Controller Instance. But dur-ing the run all generated data were received in parallel by both the CDS and theSecond Controller Instanceas shown in Fig. 1.
Both CDSs were used to set up the following specifications for the experiments: 1 mL min−1flow, 1 µL injection volume, 40◦C column temperature and 254 nm detection wavelength for absorbance signal no. 1. These parameters were fixed for each experiment, but several available detector sampling rates were used by changing the “expected narrowest peak width at half height” parameter of the HPLC detector. For HPLC detectors manufactured by Agilent Technologies this parameter implies a specific combination of sampling rate and signal filtration. For example, a configured “expected narrowest peak width at half height” of 0.0125 min (0.75 s) using a G4212B DAD detector leads to a sampling rate of 20 Hz and a response time of 0.2 s as the filtration value.
Every experiment condition has been repeated 10 times. After the setup of the HPLC cluster by the CDS, theSecond Controller Instancehas been executed and connected to the same system. Then theSecond Controller Instancewas re-quested to subscribe to the detector signal data. The incoming data handled by the raw data channel (RAWD) of theLICOP library were interpreted by theSecond Controller Instance tool relating to the data specification (Agilent Technologies, 2014). That way theSecond Controller Instancecreated sep-arate text files for each run containing a header and the raw data.
2.3.2 Raw data check by network tracking
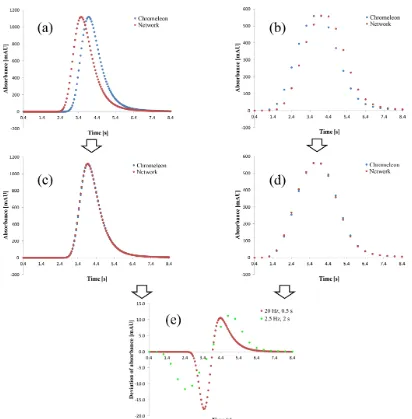
Figure 3.Chromatogram of dimethyl phthalate (a), diethyl phtha-late (b), biphenyl (c) and o-terphenyl (d) using a sampling rate of 20 Hz and a response time (signal filtration) of 0.5 s or 2.5 Hz and a response time of 2 s.
tool allows us to catch data packages between the HPLC de-vice and computer that will be sent and received via TCP and UDP. As shown in Fig. 2 this constellation bypasses the un-known storage process of the CDS orLICOPlibrary used by ourSecond Controller Instance.
Using this setup a simple run was performed injecting 10 µL of the caffeine solution. The flow of the pump was set to 1 mL min−1and the detector wavelength to 273 nm for ab-sorbance signal no. 1. The temperature control of the column compartment was turned off here. The provided data were ac-quired then either by ourSecond Controller Instanceor CDS Chromeleon®and caught by Wireshark at the same moment.
3 Results and discussion
All experiments using the commercial CDS andSecond Con-troller Instanceresulted in chromatograms as shown in Fig. 3 or similar ones. The four substances of the isocratic test sam-ple have been separated and correspond to the four peaks. The shown chromatograms in Fig. 3 were acquired by Open-Lab ChemStation®and generated by HPLC system A using a sampling rate of 20/2.5 Hz and a response time of 0.5/2 s as a signal filtration parameter. This is the usual result of a CDS before the data processing is executed including peak detection and peak integration in order to evaluate the chro-matogram.
3.1 Double entry method
For the data verification of the chromatogram a complete comparison of all data points between the two instances that acquired the absorbance signal is necessary as for the dou-ble entry method. Such a comparison is shown in Fig. 4. The deviation of the signal given as the difference between the
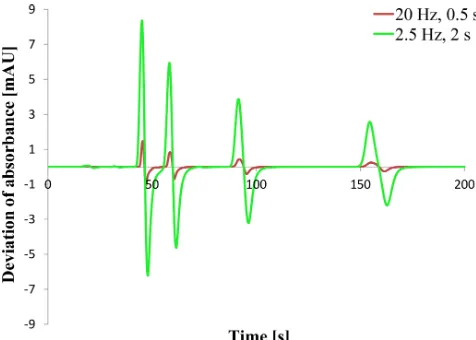
Figure 4. Signal deviation as the difference between OpenLab ChemStation® and Second Controller Instance when using sam-pling rates of 20 Hz (0.5 s response time) and 2.5 Hz (2 s response time).
signal value of CDSOpenLab ChemStation®and theSecond Controller Instanceis plotted against time like in the default chromatogram (Fig. 3). Two experiments are shown using two different sampling rates and response times. Both plots present an increasing deviation at the time range of the peaks. Only for the first peak does the deviation exceed a value of 10−5 or−10−5mAU. This also applies to the second peak using a 20 Hz sampling rate and 0.5 s response time.
A closer examination of the data points shows that the de-viation completely depends on the data accuracy given as the available number of decimal places. The exported data from OpenLab ChemStation® have a single precision which rep-resents up to 7 digits where the acquired data of the Sec-ond Controller Instancehave a double precision with 15 dig-its. So all the deviations are caused by rounding. Round-ing the Second Controller Instance data like for example 150.307349860668 mAU at time point 46 s to single preci-sion 150.3073 mAU leads to totally equal data points. This behavior applies for all experiments done with systems A and B and every used sampling rate/response time.
The phenomenon that the deviation of the second peak in Fig. 4 got a greater maximum is based on the sampling rate. A lower sampling rate can lead to a lower peak height (Wahab et al., 2016; Felinger et al., 2015) that is visible in Fig. 3. That is why the signal value of the second peak ex-ceeds a value of 100 mAU (single precision with a maximum of four decimal places now), leading to a deviation greater than 10−5mAU for a 20 Hz sampling rate but not for a 2.5 Hz sampling rate.
Figure 5.Signal deviation as the difference betweenChromeleon®
and Second Controller Instance when using a sampling rate of 20 Hz (0.5 s response time) and 2.5 Hz (2 s response time).
positive) describing one peak in the default chromatogram. These peaks visualize that the biggest deviation occurs dur-ing the risdur-ing and falldur-ing areas of the peaks in the chro-matogram. That means the negative deviation increases to a local minimum and decreases afterwards until the apex of the peak when crossing the abscissa in the deviation plot. Then the deviation increases once more in a positive way when the peak is falling. The minimum and maximum seem to be the inflection points caused by the greatest slope at these points. This information indicates that there is a time delay be-tween the signal acquired byChromeleon®andSecond Con-troller Instance because this explains why a low change in the signal leads to a marginal deviation where a great signal slope (e.g., at the inflection points) induces a high deviation between two data points. As is visible in Fig. 5, a higher sam-pling rate reduces the maximal deviation due to a smaller time delay between two data points. In this case the global maximum decreases 5.7-fold when using 20 Hz instead of 2.5 Hz. The dependency on the sampling rate also applies to HPLC system B.
3.2 Data handling of theLICOPlibrary
The relative large deviations between the stored and exported data of CDS Chromeleon® and our Second Controller In-stancebrought us to a more detailed comparison of the raw data that will be provided by the HPLC device and stored by the corresponding software package. First of all we wanted to find out whether the two tested CDSs are using different drivers communicating with the device. But by means of the Wiresharknetwork protocol analyzer it has been determined that both CDSs OpenLab ChemStation® andChromeleon® are based on theLICOPlibrary, too. On the one hand the li-brary file exists in the installation location of both CDSs and on the other hand the commands that have been sent to the
device and caught in the network are equal or similar to the Second Controller Instance, which is definitely based on the library.
On the basis of the fact that theLICOPis the only external library used by theSecond Controller Instancewhose source code is unknown, the influence of that library on the incom-ing data was checked. Therefore, a sincom-ingle injection of a caf-feine solution was performed, resulting in a chromatogram containing one peak. The data were acquired and stored by theSecond Controller Instanceand caught in parallel by the network analyzer. The provided data of the HPLC device within the TCP packages are given as hexadecimal values. For the interpretation of the data format a description file was used (Agilent Technologies, 2014). That way the data which belong to the run of the experiment have been extracted and converted from hexadecimal to decimal format. These val-ues have the unit count. In order to compare the raw data, the counts have been converted to mAU using a factor of 2 097 152 counts per AU, which could be requested from the HPLC detector. So the conversion from counts to mAU can be done using Eq. (1).
counts· 1 mAU
2097.152 counts=absorbance (1) Example:
(00 02e8 60)hex· 1
2097.152mAU= (190 560)dec·
1
2097.152mAU=
≈90.8661 mAU.
A value-by-value comparison of the stored and caught raw data showed that both of them are totally equal. The conver-sion and comparison of all data points around the peak are presented in the Supplement. That means the underlying LI-COPlibrary does not modify the incoming raw data just be-fore they are available for theSecond Controller Instance.
3.3 Processing of the raw data during the storage procedure within CDSChromeleon®
As with theLICOPlibrary an experiment using the network analyzer has been performed in order to bypass the data stor-age procedure of the CDS (Fig. 2). The experiment condi-tions are similar. The caffeine solution has been injected, generating a chromatogram with one peak, andChromeleon® acquired the data. Meanwhile, the network was tracked si-multaneously.
ample is 0.01 s (100 Hz sampling rate) and the enteredstep value is 0.2 s (20 Hz sampling rate), either every fifth data point will be stored only (average=off) or five data points will be averaged to form one data point (average=on).
Based on the given HPLC detector of system B, we con-figured a peak width of > 0.1 min. That way the detector used an internal sampling rate of 2.5 Hz to digitize the signal. The stepparameter inChromeleon®was set to 0.4 s, which corre-sponds to the 2.5 Hz sampling rate of the incoming data. For a second data rate of 20 Hz a peak width of > 0.01 min and a step of 0.05 s were configured. The experiments have been repeated for an activated and deactivatedaverageparameter. The results for 20 and 2.5 Hz sampling rates and deac-tivated averaging are visible in Fig. 6a and b. They show the exported chromatograms of Chromeleon® and chro-matograms formed by the caught data from the network. Both plots have an apparent time shift between the sig-nals. The exact time shift between the peak apexes in both chromatograms is 0.4 s. But, in contrast to Fig. 6a, in Fig. 6b the network data have a delay related to the data of Chromeleon®. Additionally counting the number of data shows that the network analyzer caught more data points than the CDS stored.
In order to check whether the time shift is the only differ-ence between the signals, the network data have been shifted by+0.4 s in Fig. 6a and−0.4 s in Fig. 6b to align the reten-tion times. That forms the chromatograms shown in Fig. 6c and d. After the normalizing of the shift there are still ap-parent deviations in the rising and falling areas of the peaks. That is why a deviation plot has been formed in Fig. 6e, as with the results of theSecond Controller Instance. It is ob-vious that there is still a deviation after the time shift, but unlike before it does not depend on the set sampling rate as much as for the experiment in Fig. 5. The wider range of the deviation plot when using 2.5 Hz is due to a peak broadening when using a more intense signal filtration (Lytle and Julian, 2016). The 2.5 Hz setup uses 2 s as its response time com-pared to 0.5 s for the 20 Hz setup. The response time itself is defined by the American Society for Testing and Materials (ASTM) as the time required for the signal to rise from 10 % to 90 % in response to an upward step function (ASTM E13 Committee, 2011). The filter algorithm used in the Agilent Technologies detector seems to be based on a moving
aver-mined during the double entry experiments are completely based on unknown, internal processing ofChromeleon®on the incoming data before storing them. Even if the provided sampling rate and the desired one defined in thestepoption are equal, the data will be modified and reduced and the pure raw data transmitted over the ethernet are not available any-more. That means there is an algorithm like an interpolation applied to the raw data that can not be deactivated. Even if the user has a look into the detailed manual of the detector in order to determine the sampling rate of the device that be-longs to the configured “narrowest peak width at half height” parameter and no reduction of data points is needed here, the data will be modified, and for an activated averageoption the deviations are significant here. Furthermore, it is possible to enter astepvalue corresponding to a sampling rate that is higher than the provided one. So non-sampled but estimated data will be stored as raw data.
4 Conclusions
Using the new writtenSecond Controller Instancehas shown that it is possible to acquire data generated by an HPLC detector manufactured by Agilent Technologies twice dur-ing one and the same run. We found out that the chro-matography data systems (CDSs) OpenLab ChemStation® andChromeleon® are based on the LICOP library for the instrument communication, as with ourSecond Controller Instance. The parallel data acquisitions have shown that the data received byOpenLab ChemStation® are totally equal, except for the rounding process when it exports its data. That way it was possible to prove that when two different con-trollers (OpenLab ChemStation®andSecond Controller In-stance) subscribe to the same source, we get the same results. So not only the transport itself via TCP could be ensured, but also the identification of the source data that will be loaded from the internal device storage and packaged for the trans-port.
be-Figure 6.Comparison plots betweenChromeleon®and the caught data packages of the network generated by HPLC system B.(a)Raw data of 20 Hz without data averaging,(b)raw data of 2.5 Hz without data averaging,(c, d)time shift of the network data to align the peak apexes, and(d)deviation as the difference between the chromatograms in(c, d)computingChromeleon®data−network data.
fore processing them. Alternatively, the data verification by the double entry method could be performed once within a software operational qualification as a test of the receiving data functionality right after the installation of the software application. Additionally, it is conceivable to use the dou-ble entry generally to compare a new software package with already existing and validated ones, as done here for the Sec-ond Controller Instance.
Regarding CDSChromeleon®, the signal deviations which occurred even if the CDS is also based on theLICOPlibrary are caused by internal data processing during the storage rou-tine. So it has been shown that the original provided data of the HPLC device are not accessible when using this software package. Additionally, without these internal computations the data between the CDSs and the Second Controller
In-stancewould be totally equal. This fact shows that a com-plete comparison of raw data generated by one given HPLC system under identical conditions always results into two dif-ferent data sets if the two tested CDSs are used. So the main problem is thatChromeleon®only stores the processed data and not the pure raw data which are gone that way.
Data availability. The underlying measurement data are not pub-licly available and can be requested from the authors if required.
Supplement. The supplement related to this article is available online at: https://doi.org/10.5194/jsss-8-207-2019-supplement.
Author contributions. DTM and DW prepared and performed the data acquisition experiments. DTM implemented the Seconds Controller Instanceand evaluated results. DW, HP and RP advised, reviewed and recommended the corrections of the article.
Competing interests. The authors declare that they have no con-flict of interest.
Special issue statement. This article is part of the special issue “Sensors and Measurement Systems 2018”. It is a result of the “Sen-soren und Messsysteme 2018, 19. ITG-/GMA-Fachtagung”, Nürn-berg, Germany, from 26 June 2018 to 27 June 2018.
Acknowledgements. We thank AnaTox GmbH and Co. KG for supporting this research by providing all software packages, re-quired materials, chemicals and HPLC systems.
Review statement. This paper was edited by Andreas Schütze and reviewed by two anonymous referees.
https://www.bbc.co.uk/schools/gcsebitesize/ict/databases/ 3datavalidationrev1.shtml (last access: 23 March 2018), 2014a. Bitesize: BBC – GCSE Bitesize: Verification, available at:
https://www.bbc.co.uk/schools/gcsebitesize/ict/databases/ 3datavalidationrev2.shtml (last access: 23 March 2018), 2014b. Center for Biologics Evaluation and Research Center for
Devices and Radiological Health: General Principles of Software Validation; Final Guidance for Industry and FDA Staff – Version 2.0, available at: https://www.fda. gov/regulatory-information/search-fda-guidance-documents/ general-principles-software-validation (last access: 18 Novem-ber 2017), 2002.
Felinger, A., Kilár, A., and Boros, B.: The myth of data acquisition rate, Anal. Chim. Acta, 854, 178–182, https://doi.org/10.1016/j.aca.2014.11.014, 2015.
Lytle, F. E. and Julian, R. K.: Automatic Processing of Chro-matograms in a High-Throughput Environment, Clin. Chem., 62, 144–153, https://doi.org/10.1373/clinchem.2015.238816, 2016. Office of the Federal Register and National Archives and
Records Administration: Code of Federal Regulations Ti-tle 21: Food and Drugs – Parts 1 to 99, available at: https://www.gpo.gov/fdsys/pkg/CFR-2017-title21-vol1/pdf/ CFR-2017-title21-vol1.pdf (last access: 8 March 2018), 2017. Ofni Systems: 21 CFR 11.10(h): Input Checks, available at: http:
//www.ofnisystems.com/21-cfr-11-10h-input-checks/ (last ac-cess: 18 November 2017), 2017.