A computer-aided model for the
simulation of railway ballast by
random sequential adsorption process
Andrea Benedetto, Luca Bianchini Ciampoli
Department of Engineering, Roma Tre University, Rome, Italy
&
Maria Giulia Brancadoro, Amir M. Alani, Fabio Tosti*
School of Computing and Engineering, University of West London (UWL), London, United Kingdom
Abstract: This paper presents a computer-aided
multi-stage methodology for the simulation of railway ballasts using the Random Sequential Adsorption (RSA – 2D domain) paradigm. The primary stage in this endeavour is the numerical generation of a synthetic sample by a “particle sizing and positioning” process followed by a “compaction” process. The synthetic samples of ballast are then visualised in the Computer-Aided Design (CAD) environment. The outcomes of the simulation are analysed by comparison with the results of an experimental investigation carried out using a methacrylate container in which real samples of railway ballast are formed. A test of model reliability is carried out between the aggregates number and the grading curves of the synthetic sample and the real one. A validation is therefore performed using the ground-penetrating radar (GPR) non-destructive testing (NDT) method and the finite-difference time-domain (FDTD) simulation developed in a computer-aided environment. The results prove the viability and the applicability of the proposed modelling for the assessment of railway ballast conditions.
1 INTRODUCTION
Nowadays railways are increasingly competitive and are alternative transportation systems to airlines for both middle-range and long-distance journeys. A high proportion of existing tracks (both ordinary and high-speed services) have been constructed using ballast, as
opposed to other construction materials (e.g., concrete) used in “ballastless” tracks. This is due to the original construction methods of railways that have changed little in concept across the years as well as to several advantages that can be attributed to ballast. The resilience provided by the ballast, the effective drainage, the possibility of track realignment and low initial construction cost are all attractive features of ballasted systems. On the contrary, routine maintenance costs to maintain the track quality are usually higher. This is exacerbated as train speeds increase, pushing wheel-rail contact forces higher.
The traditional structure of a railway track-bed consists of several components grouped into i) the superstructure and ii) the substructure. Ballast and sub-ballast layers are considered to be part of the superstructure (Giese et al., 1925; Tzanakakis, 2013; Pyrgidis, 2016) rather than the substructure (Indraratna, 2016; Li et al., 2016), and this classification may vary depending on the engineering discipline. In any case, the ballast layer is acknowledged to play a role of paramount importance to guarantee the safety and the highest standard of operability to the railway traffic (Al-Qadi et al., 2010).
distribution of the vertical, the longitudinal and the lateral stresses (exerted by the train loads passing on the rails) from the superstructure toward the foundation level, iii) suitable acoustic noise absorption and iv) the timely water drainage of the track-bed (Al-Qadi et al., 2010).
In this framework, the effective health monitoring of railway ballast is crucial to preserving the quality standards of a track-bed and ensuring the safety of the operations. An early-stage assessment of the track-bed decay is in fact an important input variable in every risk assessment model. In this regard, a reliable model output must allow to quantify effectively the likelihood of potential train derailments along the investigated track-bed sections (Castillo et al., 2016a; Castillo et al., 2016b). To a lesser extent, the decay of the ballast layer affects the original layout of the rail tracks and may imply a reduction of the operational speed of the trains. This countermeasure is usually taken to prevent damage to the convoys as well as to limit the probability of accidents. Thereby, a comprehensive assessment and health monitoring of the railway track-bed subsurface is crucial to prioritize any maintenance actions (Peng et al., 2011) as well as to schedule the train rides more efficiently (Castillo et al., 2016c).
Over the last two decades, many studies investigated the effects of poor ballast conditions in both real-life (Hugenschmidt, 2000; Olhoeft and Selig, 2002; Roberts et al., 2007) and experimental applications (Al-Qadi et al., 2008; Al-Qadi et al., 2010; Leng and Al-Qadi, 2010; De Chiara et al., 2014). Nevertheless, the manufacturing of a full-scale railway track-bed in a laboratory environment is a logistic issue, due to the substantial amount of ballast aggregates to handle. On the other hand, the results of tests carried out over a real-life track-bed are likely affected by approximations. This is mostly due to the problems that can be encountered when attempting to control boundary conditions and test parameters in these types of investigations.
Within this context and referring to this specific but relevant application area in civil engineering, the computer-aided numerical simulation stands as an innovative tool to overcome the above limitations. If proper assumptions and suitable resolutions are provided, the simulation may allow to reproduce the boundary conditions and the degradation processes of a railway ballast layer effectively. Following the Monte-Carlo method (Metropolis et al., 1949), the numerical simulation also allows to simulate a considerable number of samples from the same initial grain size condition (i.e., the same ballast grading curve). This process generates multiple tests with random different arrangements of the same components (i.e., the ballast aggregates sizes). All of the above features are extremely difficult or impossible to achieve in both real-life conditions and full-scale experimental surveys carried out in a laboratory
environment.
Nevertheless, the numerical modelling of the ballast layer is a challenging task due to the irregular and sharp shape of the aggregates. From a computational point of view, the simulation process is compute-intensive, hence, some approximations are required to provide a proper trade-off between the representativeness of the modelling and the computational load (Ahmed et al., 2016).
To the best of the Authors’ knowledge, two main methodologies were proposed in the literature for modelling the polyhedral shape of railway ballast aggregates. One approach relies on “clump logic”, whereby each particle consists of a clumping of non-overlapping spheres (3D domain) or circles (2D domain), characterised by different sizes and positions (Ferellec and McDowell, 2010; Thakur et al., 2009; Indraratna et al., 2016). The second methodology is known as the “potential particle method” and requires the preliminary generation of a set of particles. The numerical ballast sample is then developed using the particles selected within a specific set. This set owns ballast grains with size and shape in accordance with the real ballast aggregates (Ahmed et al., 2016; Houlsby, 2009).
The above two approaches have shown some limitations that are discussed in Benedetto et al. (2017). In more detail, one of the restrictions of the “clump logic” approach is that the model ignores the internal contacts between the overlapping spheres (Ferellec and McDowell, 2010; Indraratna et al., 2011). Secondly, the “potential particle method” might be not effective for modelling sharp aggregates as it is mostly used for the simulation of slightly rounded polyhedral particles of moderate complexity (Ahmed et al., 2016).
2 THE RANDOM SEQUENTIAL ADSORPTION PARADIGM: BASIC CONCEPTS AND MODEL
APPLICATIONS
The RSA is a classical model of irreversible adsorption. The model attempts to attach a number of objects to a d-dimensional domain in a sequential and random process. During the adsorption process, the object is removed if it absorbs any other covering parts of the domain; else, the object is irreversibly adsorbed (i.e., its position becomes fixed and it cannot be moved from the structure). Thereby, the object covers part of the surface, preventing the adsorption in its neighbourhood by the other objects. The process ends when no objects can be further placed in the space without overlapping with the existing ones. This theoretical condition is known as the “jamming limit” and it is associated with a zero probability of adsorption or insertion of the objects in the domain (Viot et al., 1992).
The RSA model was used first by Flory (1939) to account for the intramolecular reactions between linear polymers. Later on, Rényi (1958) proposed another one-dimensional version of the RSA approach, known as “the parking car problem”. Within the applications of the model in the bi-dimensional domain, the sequential adsorption problem was related to the adsorption of aligned squares (Finegold and Donnell, 1979) and the adsorption of disks (Talbot and Schaaf, 1989; Hinrichsen et al., 1990; Romàn et al., 1996). One of the major applications of the RSA model in the bi-dimensional domain was presented by Feder (1980). The author modelled monolayers by an adsorption process of proteins. Over time, the RSA model was used in several scientific disciplines (Talbot et al., 2000). Hard-sphere packing was applied for modelling different systems including liquids (Hansen and McDonald, 1986), ion implantation in semiconductors (Roman and Majilis, 1983) and macromolecules (Van Tassel et al., 1994). In addition, the random generation of packing spheres in a multi-dimensional domain was used for developing codes in mathematics, telecommunication and information theory (Zong, 1994; Coffman et al., 1998; Hastings, 2005).
To the best of the Authors’ knowledge, the use of the RSA model was relatively limited in civil and materials engineering applications. A major investigation simulated the water seepage in hot-mix asphalt (HMA) samples for highway engineering applications. In more detail, Umiliaco and Benedetto (2012) and Umiliaco et al. (2012) used the RSA model to generate synthetic asphalt-concrete samples. The purpose of the research was to investigate the water drainage within the asphalt material. Apart from this study, the research was mostly addressed at the micro- and the nano-scale to simulate the structure of composite and special materials. Cadilhe et al. (2007) reported the use of the RSA model for deposition on
pre-treated substrates. Bailakanavar (2013) evaluated the degradation of the physical and the mechanical properties of short glass fiber and carbon fiber-filled thermoplastic material systems. To this purpose, the author modelled the morphological details of the microstructures with randomly distributed inclusions. Zhuang et al. (2017) investigated the effective properties of composite materials with the periodic random packing of ellipsoids of different volume fractions and aspect ratios.
In view of the above, it is important to emphasize the innovation of this study in terms of i) the improved approach for modelling purposes and ii) the specific area of application (i.e., railway engineering).
3 AIM AND OBJECTIVES
This paper proposes a novel computer-aided algorithm for the bi-dimensional simulation of the structure of railway ballast layers. The main aim of the investigation is to prove the viability of the proposed RSA modelling for the numerical reproduction of the solid matrix and the arrangement of ballast material. The algorithm relies on a number of preliminary assumptions and data inputs, and it is organised as a cascade model of two main chronological stages, i.e., i) the sample generation (i.e., the particle sizing and positioning) and ii) the compaction process.
In this regard, it is worth reminding that the first stage above is inspired by the model used in Umiliaco and Benedetto, (2012) and Umiliaco et al. (2012) for the simulation of HMA samples. To a similar extent, the conceptual model used for an HMA sample is here adapted to the ballast layer case using different aggregates and inter-particle fills (in terms of both size and physical properties) placed within a default domain of a larger size. In view of this, the aim of the first stage is to reproduce reliably the geometric features of a set of railway ballast aggregates (i.e., the grain size and the mutual arrangement of differently-sized particles) into a default two-dimensional domain (i.e., a typical railway ballast layer). The condition imposed for the ballast aggregates is to comply with an inputted grading curve (i.e., the desired grain size properties of the ballast), whereas the positions of the particles are randomly assigned inside the domain.
4 METHODOLOGY
The methodology followed for the development of the RSA modelling is composed of three main steps. First, the preliminary assumptions (i.e., shape of the ballast particles and dimension of the simulation domain) and data input (i.e., ballast grading, compaction rate of the aggregates and geometry of the simulation domain) of the algorithm are defined. Subsequently, a multi-stage process of modelling is developed. To this purpose, the “particle sizing and positioning” and the “compaction process” stages are discussed. Finally, the data output files and the rendering of the synthetic compacted ballast sample are produced in a Computer-Aided Design (CAD) environment.
The viability of the above methodology is therefore investigated by way of comparison with the results of an experimental investigation carried out using a methacrylate container in which a real sample of railway ballast aggregates is formed. In more detail, a test of model reliability is carried out between the aggregates number and the grading curves of the synthetic and the real samples. A model validation is therefore carried out using the ground-penetrating radar (GPR) non-destructive testing method and the FDTD simulation performed in a computer-aided environment.
4.1 Preliminary assumptions and data input
The proposed two-dimensional model relies on two main assumptions regarding i) the shape of the ballast particles and ii) the dimension of the simulation domain.
In regard to the aggregates’ shape, the ballast particles are represented herein by a set of circles. The aim of this assumption is to provide a proper trade-off between the representativeness of the simulation process and the computational load. In this regard, although the assigned geometry is not fully realistic with respect to the sharp shape of real ballast aggregates, it well fits with the relatively uniform grading and the high content of voids of this material. Indeed, uniformly graded aggregates are generally demanded in technical standards to fulfil the ballast drainage requirements (Indraratna et al., 2011). Thereby, each particle is uniquely identified by i) the coordinates of the centre and ii) the diameter.
With reference to the dimension of the simulation domain, the main issue is to comply effectively with the dimensions of the real-life (physical) domain. In this regard, one main constraint at the experimental design stage is to avoid any scale effects due to the coarse size of the particles. Hence, a proper balance between the dimensions of the aggregates and the dimensions of the actual domain must be satisfied. The aggregate with the longest dimension is therefore identified experimentally as the reference. The condition of compliance in this case is set such that the length of the base of the real domain l must be at least five
times the reference dimension above. At the same time, the dimensions of the real domain must comply with the minimum requirements in terms of i) real-life design thickness for a ballast layer (Roberts et al., 2006) and ii) use of testing equipment for a comprehensive investigation of the ballast material (i.e., avoiding any edge affect). In regard to this latter parameter, the boundaries for avoiding edge effects with the GPR system used in this study are found according to the procedures discussed in ASTM D6087-08 (2008) and Benedetto and Tosti (2017).
In view of all of the above criteria, a real domain with base l ten times larger than the size of the biggest particle observed is finally set. Hence, a simulation domain with dimensions complying with the above real-life conditions is realised. This proves to be effective for model validation purposes (comparison between simulated and measured scenarios) (Benedetto et al., 2016; Benedetto et al., 2017), as will be discussed in Section 5. Nevertheless, if higher resolutions are required for the simulation of the real object (e.g., fine or micro scale investigations), it is worth noting that the size and the shape of the elementary components must be reproduced consistently.
In order to generate the synthetic (compacted) matrix of the ballast, the proposed RSA model requires an a-priori knowledge of three key pieces of information (data input), i.e., i) the ballast grading, ii) the compaction rate of the aggregates Pc and iii) the geometry (i.e., the height) of the simulation domain.
The first information can be extracted from the ballast grading curves used by the railway network operators for the construction of railway ballast layers. To comply with the actual grain size of ballast aggregates, the value of the particle diameter is varied between lower (δmin) and upper
(δmax) bounds (in accordance with the grading curve data).
In addition, the simulation process starts with the inclusion of the largest circles, i.e., the ballast particles retained at the top (larger) sieve of the sieving test machine (EN 933-1:2012, 2012).
Preliminary considerations about the input values to provide for the sample generation are also worthy of mention within the context of the compaction rate of the aggregates and the height of the simulation domain. In more detail, the “particle sizing and positioning” and the “compaction process” stages are run sequentially and independently each to one another.
In the “particle sizing and positioning” (first stage), the ballast solid matrix is generated inside a sample domain with an input height hinput. This height is initially assigned
to the simulation domain before running the “particle sizing and positioning” stage. The value of hinput is computed after
In the “compaction process” (second and later stage), a simulated sample with height and compaction rate, Pc (i.e, the percentage ratio between the area covered by the particles and the area of the simulation domain) consistent with the real data is instead generated. The condition of consistency is here reached when Pc is equal to the content
of voids in real-life conditions (Brancadoro et al., 2017). It is also worth noting that the “compaction” stage secures proper contact conditions between the particles as well as it leads to the reduction of the area of the sample. Hence, it contributes also to reduce the height of the sample (i.e., increase of the compaction rate).
In view of the above, two randomly assigned input parameters (i.e., the input height hinput and the input compaction rate Pc,input) will most likely not match the
corresponding real parameters (i.e., the real height hreal and
the real compaction rate Pc,real) at the end of the simulation
process. This issue can be addressed via an optimisation model able to identify on purpose an optimised pair of input values, i.e., hinput* and Pc,input* . These values ensure consistency between the simulated and the real-life conditions. The following conditions must be satisfied at the end of the compaction process:
hfinal= hreal (1)
Pc,final= Pc,real (2)
where hfinal and Pc,final are the height and the compaction
rate of the sample at the end of simulated compaction process, and ℎ𝑟𝑒𝑎𝑙 and Pc,real are the height and the
compaction rate of the real sample to reproduce, respectively.
The proposed modelling provides a number of assumptions about the rate of compaction as follows:
𝑃𝑐,𝑓𝑖𝑛𝑎𝑙= 𝐴𝑠𝑜𝑙𝑖𝑑
𝑙∙ℎ𝑓𝑖𝑛𝑎𝑙 (3)
𝑃𝑐,𝑖𝑛𝑝𝑢𝑡= 𝐴𝑠𝑜𝑙𝑖𝑑
𝑙∙ℎ𝑖𝑛𝑝𝑢𝑡 (4)
where l is the longitudinal dimension of the domain and Asolid is the area covered by the particles. This area is
defined starting from the real compaction rate as follows: Asolid= Pc,real100 ∙Ad,real (5)
where Ad,real is the area of the simulation domain (as per
the real dimensions of the sample to reproduce). To this effect, Ad,real can be expressed as follows:
Ad,real=l∙hreal (6)
The final pair of optimised values (hinput* ; Pc,input* ) is
obtained by the solution to the following system of three equations:
hinput=hreal∙(1+100Δ1) (7)
Pc,input=Pc,real∙(1-100Δ2) (8)
hfinal=hinput-Δh(hinput(Δ1),Pc,input(Δ2)) (9)
where 𝛥1is the incremental percentage of the real height;
Δ2 is the decremental percentage of the real compaction; Δh
is the difference between the initial and the final heights of the sample and it depends on the development of the compaction process. The system of Equations (7)-(9) is set to represent the initial conditions of the problem. In more detail, Equation (7) takes into account the input height hinput.
This is set as equal to the height of the real-life sample to reproduce (i.e., hreal) increased of an incremental percentage
𝛥1. Equation (8) represents the input compaction rate
Pc,input. This is set as equal to the real compaction rate Pc,real
decreased by a decremental percentage value Δ2. Finally,
Equation (9) sets the conditions for the final height of the sample hfinal, as reached at the end of the compaction
process. This turns out to decrease of a value equal to Δh (sets as a function ofΔ1and Δ2) with respect to the input
height hinput.
Working out the system of Equations (7)-(9), the following system of equations can be written:
Pc,real=Pc,input∙ 1
(1-100Δ2) (10)
hfinal=hreal∙(1+100Δ1)-Δh(Δ1,Δ2) (11)
Working out Equations (2)-(4) into Equation (10), the system of relationships expressed by Equations (10, 11) becomes:
𝐴𝑠𝑜𝑙𝑖𝑑
𝑙∙ℎ𝑓𝑖𝑛𝑎𝑙= 𝐴𝑠𝑜𝑙𝑖𝑑
𝑙∙ℎ𝑖𝑛𝑝𝑢𝑡∙ 1
(1−𝛥2
100)
(12)
ℎ𝑓𝑖𝑛𝑎𝑙 = ℎ𝑟𝑒𝑎𝑙∙ (1 + 𝛥1
100) − 𝛥ℎ(𝛥1, 𝛥2) (13)
where Δh(Δ1,Δ2) is estimated numerically as a function of
the variation of Δ1 and 𝛥2, as follows:
Δh = α∙Δ1
Δ2-β (14)
with the α and β parameters being 22.5 and 18.6, respectively. Equation (14) stands for the development of the compaction process depending on the shape of the particles and the geometry of the simulation domain. It is worth specifying that the values of the α and β parameters in Equation (14) have been obtained numerically after running simulations at 2.5% steps of incremental percentages 𝛥1 and
values related to the “height of the sample” and the “compaction rate” have been obtained at the end of each of the above simulation steps. These pairs have been then related to each of the stepped-percentage values of 𝛥1 and
Δ2. A numerical-based linear relationship (least-squares fitting curve), as expressed by Equation (14), has been therefore found. It is also worthy of mention that the α and β parameters vary as a function of the geometric shape of the particles (i.e., circular in the proposed model) and the simulation domain (i.e., rectangular).
Working out Equation (13) into Equation (12), a fundamental relationship is derived for the calculation of the wanted pair of optimised values (hinput* ; Pc,input* ) as follows:
Asolid
l∙hreal∙(1+100Δ1)-Δh (Δ1,Δ2)= Asolid l∙hreal∙(1+100Δ1)
∙ 1
(1-100Δ2) (15)
The solution to the optimisation problem lies in the computation of Δ1* and Δ2* (percentages) such that the
identity expressed by Equation (15) is verified and it is equal to Pc,real.
Thereby, the following equality is obtained under optimised conditions:
Asolid
l∙hreal∙(1+Δ1 *
100)-Δh(Δ1 *,Δ
2 *)=
Pc,real
100 (16)
Asolid
l∙hreal∙(1+Δ1 *
100)
∙ 1 (1-Δ2
*
100)
=Pc,real
100 (17)
Finally the input parameters are: hinput* =hreal∙(1+Δ1 *
100) (18)
Pc,input* =Pc,real∙(1-Δ2 *
100) (19)
Conventionally from now on, Pc,input is used to indicate
the optimised compaction rate to provide as the input information to the simulation code, h' indicates the height of
the virtual sample at the end of the “particle sizing and positioning” stage (being h'= h
input
* ), whereas h stands for the
height of the sample at the end of the “compaction process” stage (being h=hfinal=hreal). In regard to the latter parameter,
it is worth specifying that h'<h.
Once the relevant parameters are set and the model is run, a required number of samples are returned in the bi-dimensional domain. The grains in the samples are located at randomly different positions, whereas the grain size distribution and the compaction rate are kept constant.
4.2 The multi-stage RSA modelling
The two aforementioned data inputs are the source information for the development of the proposed multi-stage RSA modelling, i.e., i) the “particle sizing and positioning” and ii) the “compaction process”.
4.2.1 Sizing and positioning of the particles
The first stage of the proposed RSA modelling relies on the “intersection control” criterion according to the conventional RSA approach (Flory, 1939).
The primary step consists in the generation of a ballast sample from the emulation of the real case. To that effect, the fractions Fi(%) of the aggregates retained on the ith
sieve are considered, where i is comprised between 1 and M = 6 (i.e., the number of sieves in the sieving machine according to the EN 933-1:2012 (2012) standard). Each fraction Fi corresponds to an overall area Ai(m2), defined as
follows:
Ai= 100Fi ∙ Pc,input
100 ∙Ad (20) 0) (2
with Ad being the area of the simulation domain before
the compaction process equal to Ad=l∙h' and Pc,input being
the already-defined rate of compaction of the aggregates. In accordance with the sieving test, the material retained on the ith sieve is composed of the particles retained between
the size of the sieves i and i-1.
After the definition of the fraction areas, the generation of the ballast solid matrix is run by means of a selection model, based on the two following criteria:
priority in the adsorption process is given to the particles with a more limited probability to find an empty space within the simulation domain when the process has started (i.e., the coarser particles);
control of the adsorption of the area Ai of the ith sieve
fraction.
The motivation for the first criterion is to reach a more realistic configuration by easing the computational tasks. Indeed, if the adsorption process is instructed to allocate the small-size particles first, the probability to find space for the coarser ones could be compromised. As the particles are allocated one by one and randomly, the space available in the simulation domain when the process is ongoing lowers gradually. This happens regardless of the dimension of the particles that are first allocated, although the process becomes more critical in the case of an initial allocation of the smaller particles. Indeed, it is more likely that the space available in the simulation domain could decrease up to the point that it might not be possible anymore to complete the adsorption process for the biggest particles. It is also worth specifying that the above instruction has no implications on the final outcome of the model, as the “particle sizing and positioning” and the “compaction process” stages are sequential and independent each to one another. Hence, allocating the largest particles first allows to achieve a more time-efficient modelling.
The second criterion is related to the compliance with the ballast grading curve information. In this regard, whilst the already distributed particles covers the domain area Ai (i.e.,
passes to the following sieve fraction 𝑖 + 1 and so forth until the last sieve fraction is adsorbed.
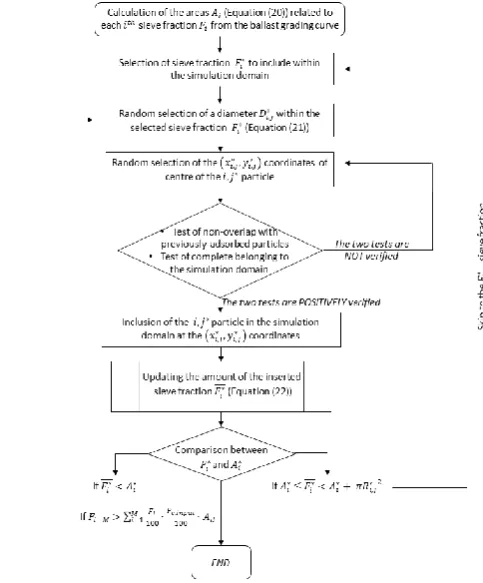
In more detail, the process for the simulation of the ballast solid matrix can be sorted into the following seven main stages:
1. calculation of the areas Ai (Equation (20)) related to
each ith sieve fraction F
i from the ballast grading
curve.
2. Selection of the sieve fraction Fi* to include within
the simulation domain.
3. Random selection of one diameter Di,j* within the
selected sieve fraction Fi*. In this regard, the
diameter of the particles is sorted out from 100 possible values comprised between the minimum and the maximum bounds of the ith sieve (i.e., D
i,min
and Di,max, respectively). The following relationship
is used:
Di,j=Di,min+Di,max -Di,min
100 ∙C (21)
with C being the random selected discrete variable that is a number between 0 and 100.
4. Random selection of the (xi,j*, yi,j*) coordinates of the
centre of the i,j* particle.
5. Test of the (xi,j*, yi,j*) coordinates of the centre of
the i,j* particle. Due to the random nature of this
multi-stage process, setting the coordinates for the particle position must comply with the following two major conditions:
the non-overlap with previously-adsorbed particles;
the complete belonging of the particles to the simulation domain.
If the above two conditions are verified simultaneously, the i,j* particle is included in the simulation domain (i.e., skip to step 6); else, new coordinates of the i,j* particle must be randomly selected (i.e. back to step 4).
6. Inclusion of the i,j* particle in the simulation
domain at the (xi,j*, yi,j*) coordinates.
7. Updating the amount of the inserted sieve fraction Fi* as follows:
F*i= ∑j=1N πRij2+πRij2* (22) 2) (2
where Ri,j is the radius of the i,jth particle, and N is
the total number of particles already included in the simulation domain.
8. Comparison between the amount of the inserted sieve fraction Fi* and the value of the corresponding
area Ai*. The algorithm skips to the subsequent
sieve fraction Fi+1* when the following condition is
verified:
Ai*<Fi*≤Ai*+πRmax* , i,j (23) 3) (2
where Ai* is the total area related to the sieve fraction
Fi* and Rmax* , i is the maximum value of radius that
can be selected for the sieve fraction Fi*.
The flowchart in Figure 1 summarizes the aforementioned multi-stage process.
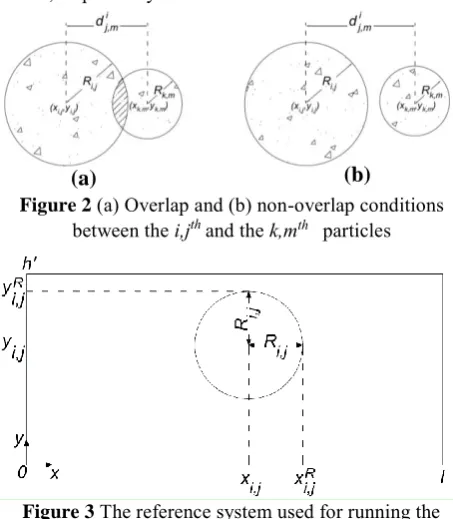
The details for the compliance to the aforementioned two tests, (i.e., i) the non-overlap with previously adsorbed particles and ii) the complete belonging of the particles to the simulation domain) as well as the final output of the process are discussed below.
Test of non-overlap between the particles
The aim of this test is to verify that the (xi,j,yi,j)
coordinates of the centre of the i,jth particle are not causing
any interferences between the actual and the previously-added particles, as it is shown in Figure 2.
Figure 1 Flowchart of the multi-stage process for the “sizing
To this effect, the distance dj,mi between the i,jth and any
k,mth particleisdefined as follows:
dj,mi =√(xi,j-xk,m) 2
+(yi,j-yk,m)2
2
(24) with k and m being the considered sieve fraction and the particle, respectively. The distance 𝑑𝑗,𝑚𝑖 must comply with
the following condition:
dj,mi <sj,m (25)
where sj,m is the sum of the radii Ri,j and Rk,m of the analysed
circles.
Test of complete belonging to the simulation domain The aim of this test is to verify that the (𝑥𝑖,𝑗, 𝑦𝑖,𝑗)
coordinates of the i,jth particle are not causing the total or
partial exclusion of the particle from the simulation domain. In this regard, a reference system with the origin at the lower-left corner of the simulation domain is set (Figure 3). Two conditions must be simultaneously verified:
0≤xi,jR ≥l ; 0≤yi,jR ≥h' (26)
where:
xi,jR =xi,j+Ri,j and yi,jR =yi,j+Ri,j (27)
are the updated coordinates of the i,jth particle that consider
the contribution of Ri,j (i.e., the radius of the i,jth particle),
whereas l and h’ are the length and the height (before running the “compaction process”) of the simulation domain, respectively.
Figure 2 (a) Overlap and (b) non-overlap conditions
between the i,jth and the k,mth particles
Figure 3 The reference system used for running the
“domain belonging” test
Output of the particle sizing and positioning stage
The sample generation ends when the solid-to-void ratio complies with the input requirement, i.e., the rate of compaction of the aggregates Pc,input. From an analytical
point of view, the generation algorithm stops when Equation (23) is verified for each sieve fraction or, in global terms, when the following condition applies:
∑Mi=1Fi>∑Mi=1Ai= Pc,input
100 ∙Ad (28) (28)
where M is the total number of investigated sieve fractions Fi, equal to 6 (i.e. the number of sieves in the sieving
machine according to the EN 933-1:2012 (2012) standard), and Ad is the already-defined area of the simulation domain
before the compaction process.
At the end of the simulation process, each particle is encoded in a list that includes the coordinates of the centre and the diameter value.
4.2.2 Compaction process
As the final outcome of the “particle sizing and positioning” stage is encoded, the simulation domain is configured as a simulated non-compacted sample filled up with ballast-like particles. In this regard, the particles are suspended in the air, as no contact conditions are here imposed.
Hence, a compaction process is run in order to i) reproduce carefully real-life track-bed conditions and ii) ensuring proper contacts between the ballast grains. To this effect, a shift of the grains along the vertical direction is imposed.
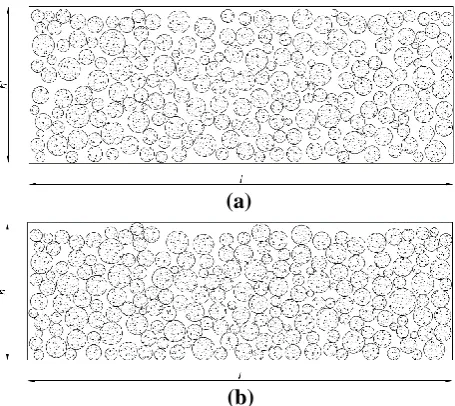
The aim of this process is to simulate the gravitational effect during the laying out of the aggregates for the construction of a railway ballast layer. An example of the ballast sample before undergoing the compaction procedure is given in Figure 4. As it can be noticed from the figure, the code is structured such that a graphic 2D illustration in the CAD environment can be rendered at the end of the simulation process. This stage is detailed further in Section 4.2.3.
As the first step of the compaction process, the simulation domain is discretised into several rectangular areas k. Each area has the same length l of the simulation domain with a thickness of 2 cm. In this regard, a value lower than the minimum radius likely to be generated inside the simulation domain is considered as suitable thickness dimension for the rectangular areas.
The whole compaction process develops upward, i.e., starting from the kth discretised area at the bottom of the whole simulation domain (i.e., the rectangle with the bottom base matching the bottom base of the whole simulation domain) up to the highest kth discretised area (i.e., the rectangle with the upper base matching the upper base of the whole simulation domain) (Umiliaco et al.,2012).
Figure 4 Ballast sample before the compaction process
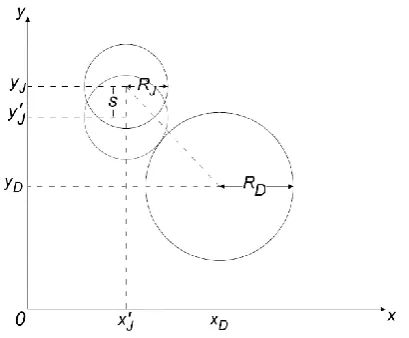
Once the domain is discretised, the compaction of the grains is run by a two-stage process as follows:
1. selection of the jth particle, belonging to the kth analysed (discretised) domain;
2. shifting of the coordinate yJ of the centre of the particle J. The new value of the ordinate of the centre yJ' complies with the following conditions:
yJ'<y
J ; yJ'=yJ-s (29)
where s is the downward shift of the particle: s= (yJ-yD) -(yJ'-yD) (30) where yJ' and y
D are the ordinates of the centre of
the particle J and the underneath particle D, respectively (Figure 5). The (yJ'-y
D) element in
Equation (30) can be geometrically derived as follows:
(yJ'-y
D)=√(RJ+RD)2-(xD-xJ')
2
(31) where RJ and RD are the radii of the two particles
and xJ' and xD are the values in abscissa of the centre
of the particle J and the underneath particle D, respectively.
The above compaction process stops when all the particles belonging to the last discretised rectangular area (i.e., the highest one) are shifted downwards (i.e., following the conditions expressed by Equations (29) – (31)).
4.3 Data output
The final output of the above full modelling development (i.e., the virtual railway ballast sample with ballast-like compacted aggregates) is encoded in two main data files, i.e., a Text File (.txt) and a Script File (.scr). The files are initialised before the generation of the synthetic ballast sample and they are automatically and progressively filled after the adsorption of each new particle in the simulation domain.
The Text File includes all the information about the execution of the algorithm and the characteristics of the simulation.
Figure 5 The ballast compaction process in the Cartesian
reference frame
In more detail, this file contains i) the input data (i.e., the grading curve and the compaction rate 𝑃𝑐), ii) the coordinates
list and the radii of the particles inserted into the domain, iii) the execution time of the process and iv) the total number of inserted particles. Despite of the above information framework, it is worth specifying the flexibility of the structure and the language of the Text File that can be adapted to comply with the developer’s requirements.
In regard to the Script File, it includes all the geometric features of each particle. The main advantage of this file is to support the graphic representation of the simulation domain in the CAD environment. An example of the fully compacted ballast sample returned in the CAD environment using the Script File is given in Figure 6.
As it can be seen from Figure 6, a number of particles are returned as "suspended" in the gravitational field. To this effect, it is important to point out that this output does not imply a mechanical instability of the modelled system, as the model is not focused on replicating the mechanics of the aggregates’ interlocking. Indeed, the focus of the model is to provide an effective simulation of the topology and grain size distribution of the aggregates in a given 2D space.
5 APPLICATION, TEST OF MODEL RELIABILITY AND VALIDATION OF THE COMPUTER-AIDED
SIMULATION
An experimental setup is arranged in a laboratory environment to reproduce a typical ballast layer of a track-bed substructure. To this purpose, a square-based container is filled with real ballast aggregates.
It is also worthy of mention that the numerical modelling proposed in this research is part of a fully comprehensive methodology for the assessment of railway ballast with the GPR non-destructive testing (NDT) method (Benedetto et al., 2016; Benedetto et al., 2017). Indeed, simulation is crucial to underpin the experimental outcomes for model validation purposes as well as to aid with the interpretation of the data collected in situ. The use of a simulation tool also allows to investigate effectively a wide range of ordinary to relatively complex ballast scenarios at low costs. Following the proposed approach, it is in fact possible to generate reference patterns and classifying the ballast condition by way of comparison.
In order to carry out a robust validation of the simulation algorithm, the aforementioned RSA model is embedded into a numerical model that reproduces a GPR investigation by the finite-difference time-domain (FDTD) technique (Yee, 1966; Kunz and Luebbers, 1993; Taflove, 1995). In more detail, the coupled model simulates the propagation of the EM waves (FDTD technique) within the synthetic ballast sample generated by the RSA model. To this purpose, a virtual 2D ballast layer (i.e., the final output of the RSA model) with the dimensions of the real container is first generated. Hence, this output is used as the input information for the FDTD electromagnetic investigation.Finally, the real data acquired by GPR in the laboratory environment and the simulated outcomes are compared for validation purposes.
5.1 Laboratory setup and experimental results
A methacrylate container with the dimensions of 1.5 × 1.5 × 0.5m is filled with ballast aggregates to reproduce in a laboratory environment the ballast layer of a typical railway track-bed.
Figure 6 Ballast sample (a) before and (b) after the
compaction process
The container is laid over a metal plate to allow the full EM reflection at the bottom of the sample. A GPR system equipped with an air-coupled antenna and central frequency of 1000 MHz is used for testing purposes. Three different methods are applied for the assessment of the relative dielectric permittivity, i.e., the Time-Domain Signal-Picking (TDSP) technique (Wu et al., 1999), the Surface Reflection Method (SRM) (Scullion et al., 1994; Benedetto et al., 2015) and the theoretical model of the Volumetric Mixing Formula (Birchak et al., 1974). The results prove that the 1000 MHz air-coupled antenna system provides reliable and stable data outputs in terms of relative dielectric permittivity for the assessment of railway ballast (Tosti et al., 2018).
A further investigation is carried out on the container filled with ballast aggregates and silty soil in different quantities to simulate the fouling of the ballast. Four different ballast fouling soil ratios are formed from clean (0% silty material by weight) to highly fouled (24% silty material). The results demonstrate that the dielectric permittivity values of the ballast system increase according to the fouling ratio. Further details about the experimental outcomes can be found in Benedetto et al. (2017).
5.2 Test of model reliability and validation of the RSA modelling
In order to analyse the viability of the RSA model, two different approaches are used. A test of model reliability is carried out by way of comparison between the real and the numerical ballast samples. To this effect, the main geometric (i.e., the number of the aggregates and the grading curve) and physical (i.e., percentage of intergranular voids) properties of the samples are compared. On the other hand, a validation is developed by comparison of the actual (i.e., the data obtained from a real GPR survey in the laboratory) and the synthetic GPR data (i.e., the synthetic data obtained from the combined simulation-based methodology).
5.2.1 Test of model reliability
The real and the synthetic ballast samples are compared to provide a test of reliability for the proposed RSA modelling. The algorithms are used to reproduce the grain size and the configuration of the actual ballast aggregates, according to the real truth.
The simulation domain reproduces the exact dimensions of the real container. A grain size distribution that complies with the experimental (actual) one is considered. The sieving procedure proposed in the EN 933-1:2012 (2012) standard is followed to assess the grain size distribution of the ballast aggregates (Table 1). Further experimental tests are carried out in the laboratory environment to assess the percentage of intergranular voids and provide virtual compaction conditions close to reality. To this purpose, the EN 1097-3:1998 (1998) standard is followed.
(a)
Table 1
Input ballast grading curve
Sieve Diameter [mm] 80 63 50 40 31.5 22.4
Passed at Sieve [%] 100 100 79.9 30.6 1.2 0.3 The voids content is 42% and it is consistent with common real-life conditions. This information is used as an input data to generate the sample in the simulation domain. Further details on how to retrieve the input value of the voids content in a ballast layer are given in Brancadoro et al. (2017).
Following Equations (18) and (19), hinput* and Pc,input* turn
out to be 55 cm and 50%, respectively, according to hreal =
48 cm and the percentage Pc = 58%.
The numerical procedure returns a number of 200 circles with diameters ranging from 2.5×10⁻² m to 8×10⁻² m. This output is consistent with the real grain size distribution shown in Table 1. To evaluate the reliability of the proposed RSA modelling, the number of adsorbed circles is compared first to the actual number of ballast particles in the laboratory container (Figure 7). The particles number is calculated by visual inspection of the front views of the four sides of the container. The comparison proves the consistency between the synthetic and the real conditions. In this regard, 198, 202, 203 and 207 ballast particles (average μ = 202.5; standard deviation σ = 3.201; Mean Percentage Error MPE = 1.210) are counted at each of the four mentioned sides.
A further model reliability test is focused on the comparison between the input (real aggregates) and the output (synthetic aggregates) grain size distribution of the ballast. As it is shown in Figure 8, the comparison proves the viability of the proposed RSA modelling. The output grading curve matches the input curve well. It is worth emphasizing the significance of this agreement if one considers the limited fitting expected when a random process of insertion (e.g., the RSA model) is used.
5.2.2 Model validation
The RSA numerical modelling is here validated using the outcomes of the real GPR inspections carried out in the laboratory environment. To this effect, real scenarios of ballast fouling soil mixes are simulated using the
Figure 7 Comparison between real (left) and synthetic
(right) arrangements of ballast aggregates in the sample
Figure 8 Comparison between the input (solid) and the
output/virtual (dashed) grading curves
aforementioned combined simulation-based methodology. The GPR inspection is simulated using the outcomes of the RSA modelling as input data and integrating the Maxwell’s equations by the FDTD scheme all over the domain. In this regard, the gprMax numerical simulator software package (Giannopoulos 2005) is used for simulation purposes. The design of the gprMax models and their distributed execution on multicore machines are aided by the freeware tool E2GPR (Pirrone & Pajewski 2015).
This process allows to obtain a synthetic GPR response for each combination of ballast scenarios. The synthetic GPR signals are therefore compared to the data collected on the real-life ballast sample in both clean and fouled conditions (Figure 9 and Figure 10).
Figure 9 Comparison between real (solid) and synthetic
(dashed) signals in the case of clean ballast
Figure 10 Comparison between real (solid) and synthetic
The overall good match between the radar data confirms the reliability of the proposed RSA numerical modelling. In this regard, the use of synthetic GPR data is of paramount importance for modelling complex physical conditions of the ballast, such as the fouling of the aggregates.
6 CONCLUSION AND FUTURE PROSPECTS
In this work, a novel computer-aided algorithm is proposed for the simulation of the ballast aggregates arrangement in a railway ballast layer. The solid matrix and the aggregates arrangement of the ballast layer are configured in the bi-dimensional domain using the Random Sequential Adsorption (RSA) model.
The proposed RSA modelling sets with the definition of the preliminary assumptions and data input regarding i) the shape of the ballast particles and ii) the dimension of the simulation domain.
The model therefore develops in two major stages, i.e., i) the “sizing and positioning of the particles” in a default domain and ii) the “compaction process”. To this purpose, three corresponding major data inputs are required, i.e., i) the ballast grading (information retrieved from a default ballast grading curve or through a sieving test (EN 933-1:2012, 2012)), ii) the rate of compaction between the particles (the percentage of intergranular voids in a default ballast domain (EN 1097-3:1998, 1998)) and iii) the geometry (i.e., the height) of the simulation domain.
Using the information from the above first stage, a random sequential process is run to define the dimension and the mutual position of the ballast particles in the simulation domain. In this regard, a set of circles with different diameters (in agreement with the particle size distribution from a default ballast grading curve) is sequentially and randomly extracted. The position of each extracted circle is then randomly determined in accordance with two major conditions, i.e., i) the non-overlap with previously absorbed particles and ii) the complete belonging of the particle to the simulation domain.
The second stage of the proposed modelling aims at simulating the topology of the particles in view of the effects of the gravitational compaction process undergone by the aggregates during the laying out stage of a real-life ballast layer. To this effect, the contacts between the grains are reached in compliance with a downward vertical shift of the particles. The final output returns a synthetic sample of ballast aggregates representable in a Computer-Aided Design (CAD) environment.
In regard to the study case addressed in this paper, a number of 200 circles with diameters ranging from 2.5×10⁻² m to 8×10⁻² m are returned by the numerical procedure. The viability of the proposed RSA modelling is therefore analysed using two main approaches. To this purpose, an experimental setup is arranged in a laboratory environment
to reproduce a typical ballast layer of a track-bed substructure. In more detail, a container (methacrylate material) of dimensions 1.5 × 1.5 × 0.5m is filled with ballast aggregates in the laboratory environment to reproduce the ballast layer of a typical railway track-bed.
A test of model reliability is first carried out by way of comparison between the virtual and the real ballast samples through visual and physical investigations. A substantial match is found in terms of aggregates number and ballast grading curve (i.e., Table 1). The particles number is assessed by visual inspection of the front views of the four sides of the container. A number of 198, 202, 203 and 207 ballast particles (average μ = 202.5; standard deviation σ = 3.201; Mean Percentage Error MPE = 1.210) are counted at each of the four mentioned sides.
Secondly, a validation of the model is developed using the ground-penetrating radar (GPR) non-destructive testing (NDT) method. In this regard, the RSA algorithm is integrated into a fully comprehensive methodology for the assessment of the railway ballast condition.
Further to the above real scenario with clean ballast aggregates, silty soil material is then added to the container in different quantities to form several levels of fouling. Hence, GPR investigations are carried out on the real sample. A “combined simulation-based methodology” couples the proposed RSA model and the finite-difference time-domain (FDTD) technique. To this effect, the numerical outputs of the RSA model are inputted into the gprMax numerical simulator for the FDTD simulation of the GPR signal.
The methodology allows to simulate the propagation of the electromagnetic (EM) waves within the synthetic ballast sample (generated by the RSA modelling) and to compare the synthetic GPR output with that from the real sample. Both the simulated and the real GPR-based investigations are carried out using a 1000 MHz antenna frequency.
An overall good match is proved from the comparison of the signals in both clean and fouled conditions, thereby indicating a substantial reliability of the proposed RSA numerical modelling.
It is important to emphasize the potential of the RSA modelling coupled with the FDTD technique. This is of paramount importance for the simulation of the GPR signal as well as for the generation of synthetic GPR data close to the experimental outcomes. It is also worth mentioning the advantage of simulating a reliable output from a 3D complex system, such as a railway ballast layer, using the approximation of a bi-dimensional space. This is crucial in terms of reduced computational load.
In addition, future research could task itself to raise the complexity of the simulated output model. In this regard, polygonal-shaped ballast particles and the corresponding modification of the compaction process (e.g., horizontal movements and rotation of the particles under compaction) might be modelled. The output could be included in a realistic model to account for a multi-component and comprehensive structure similar to a real-life railway track-bed.
ACKNOWLEDGMENT
The authors express their thanks to Mr. Spartaco Cera, from Roma Tre University, for the technical assistance during the laboratory surveys.
REFERENCES
Ahmed, S., Harkness, J., Le Pen, L., Powrie, W. & Zervos, A. (2016), Numerical modelling of railway ballast at the particle scale, International Journal for Numerical and Analytical Methods in Geomechanics, 40(5), 713– 737.
Al-Qadi, I. L., Xie, W. & Roberts, R. (2008), Time-Frequency Approach for Ground Penetrating Radar Data Analysis to Assess Railroad Ballast Condition, Research in Nondestructive Evaluation, 19(4), 219–237.
Al-Qadi, I. L., Xie W., Roberts, R. & Leng, Z. (2010), Data Analysis Techniques for GPR Used for Assessing Railroad Ballast in High Radio-Frequency Environment, Journal of Transportation Engineering, 136(4), 392-399.
ASTM D6087-08. Standard Test Method for Evaluating Asphalt-Covered Concrete Bridge Decks Using Ground Penetrating Radar. ASTM International, West Conshohocken, PA, 2008.
Bailakanavar, M. R. (2013), Space-time multiscale-multiphysics homogenization methods for heterogeneous materials, Ph.D. Dissertation, Columbia University Academic Commons.
Benedetto, A., Tosti, F., Bianchini Ciampoli, L., Calvi, A., Brancadoro, M. G. & Amir, A. M. (2017), Railway ballast condition assessment using ground-penetrating radar – An experimental, numerical simulation and modelling development, Construction and Building Materials, 140, 508–520.
Benedetto, A., Tosti, F., Bianchini Ciampoli, L., Pajewski, L., Pirrone, D., Umiliaco, A. & Brancadoro, M. G. (2016), A simulation-based approach for railway applications using GPR, in Proceedings of the 16th
International Conference of Ground Penetrating Radar, Hong Kong, China, June 13-16.
Benedetto, A., Tosti, F., Ortuani B., Giudici, M. & Mele, M. (2015), Mapping the spatial variation of soil moisture at the large scale using GPR for pavement applications, Near Surface Geophysics, 13(3), 269–78.
Benedetto, F. & Tosti, F. (2017), A signal processing
methodology for assessing the performance of ASTM standard test methods for GPR systems, Signal Process.
132, 327–337.
Birchak, J. R., Gardner, C. G., Hipp, J. E. & Victor, J. M. (1974), High dielectric constant microwave probes for sensing soil moisture, in Proceedings of the IEEE, 62(1), pp. 93–98.
Brancadoro, M. G., Bianchini Ciampoli, L., Pirrone, D., Benedetto, A., Tosti, F., Alani & A. M. Pajewski, L. (2017), How to create a full-wave GPR model of a 3D domain of railway track bed?, in Proceedings of 10th International Conference on the Bearing Capacity of Roads, Railways and Airfields – BCRRA 2017, Athens, Greece, June 28-30.
Cadilhe, A, Araujo, N. A. M. & Privman, V. (2007), Random sequential adsorption: from continuum to lattice and pre-patterned substrates, Journal of Physics: Condensed Matter, 19(6).
Castillo, E., Grande, Z. & Calviño, A. (2016), Bayesian Networks-based probabilistic safety analysis for railway lines, Computer-Aided Civil and Infrastructure Engineering, 31(9), 681–700.
Castillo, E., Grande, Z., Calviño, A., Sánchez-Cambronero, S., Gallego, I., Rivas, A. & Menéndez J. M. (2016), A Markovian–Bayesian Network for risk analysis of high speed and conventional railway lines integrating human errors, Computer-Aided Civil and Infrastructure Engineering, 31(3), 193–218.
Castillo, E., Grande, Z., Moraga, P. & Menéndez, J. M. (2016), A Time partitioning technique for railway line design and timetable optimization, Computer-Aided Civil and Infrastructure Engineering, 31(8), 599–616.
Clark, M. R., Gillespie, R., Kemp, T., McCann, D. M. & Forde, M. C. (2001), Electromagnetic properties of railway ballast, NDT & International, 36(5), 305–311.
Coffman Jr. E. G., Flatto, L., Jelenkovich, P. & Poonen, B. (1998), Packing random intervals on-line, Algorithmica, 22(4), 448–476.
De Chiara, F., Fontul, S. & Fortunato, E. (2014), GPR Laboratory test for railways materials dielectric propriety assessment, Remote Sensing, 6(10), 9712–9728.
EN 933-1:2012, Tests for geometrical properties of aggregates - Part 1: Determination of particle size distribution - Sieving method. European Committee for Standardization, 2012.
EN 1097-3:1998, Tests for Mechanical and Physical Properties of Aggregates – Part 3: Determination of Loose Bulk Density and Voids, European Committee for Standardization, 1998.
Feder, J. (1980), Random Sequential Adsorption, Journal of Theoretical Biology, 87(2), 237–254.
Ferellec, J. F. & McDowell, G. R. (2010), A method to model realistic particle shape and inertia in DEM, Granular Matter, 12(5), 459–467.
of random placing of membrane particles, Nature, 278, 443–445.
Flory, P. J. (1939), Intramolecular Reaction between neighbouring substituents of vinyl polymers, Journal of the American Chemical Society, 61(6), 1518–1521.
Giannopoulos, A. (2005), Modelling ground penetrating radar by GprMax, Constraction and Building Materials,
19(10), 755–762.
Giese, E., Blum, O. & Risch, K. (1925), Linienführung, Springer, Berlin, Germany.
Hansen, J. P. & McDonald, I. R. (1986), Theory of Simple Liquids Academic, New York, USA.
Hastings M. B. (2005), Statistical Mechanics of Interfering Links, Physical Review E, 72(1).
Hinrichsen, E. L., Feder, J. & Jøssang, T, (1986), Geometry of Random Sequential Adsorption, Journal of Statistical Physics, 44(5), 793–827.
Hinrichsen, E. L., Feder, J. & Jøssang, T. (1990), Random packing of disks in two dimensions, Physical Review A, 41(8), 4199.
Houlsby, G. T. (2009), Potential particles: a method for modelling non-circular particles in DEM, Computers and Geotechnics, 36(6), 953–959.
Hugenschmidt, J. (2000), Railway track inspection using GPR, Journal of Applied Geophysics, 43(2-4), 147–
155.
Indraratna, B. (2016), 1st Proctor Lecture of ISSMGE: Railroad performance with special reference to ballast and substructure characteristics, Transportation Geotechnics,
7, 74-114.
Indraratna, B., Ngo, N. T., Rujikiatkamjorn, C. & Vinod, J. S. (2014) Behavior of fresh and fouled railway ballast subjected to direct shear testing, Discrete element simulation, International Journal of Geomechanics, 14(1),
34–44.
Indraratna, B. & Nimbalkar, S. S., Ngo, N. T. & Neville T. (2016), Performance improvement of rail track substructure using artificial inclusions – Experimental and numerical studies, Transportation Geotechnics, 8, 69–85.
Indraratna, B., Salim, W. & Rujikiatkamjorn C. (2011), Advanced Rail Geotechnology – Ballasted Track, CRC Press, Boca Raton, USA.
Kunz K. S. & Luebbers, R. J. (1993), The Finite Difference Time Domain Method for Electromagnetics, CRC Press.
Leng, Z. & Al-Qadi, I. L. (2010), Railroad ballast evaluation using ground-penetrating radar, Transportation Research Record, 2159, 110–117.
Li, D., Hyslip, J., Sussmann, T. & Chrismer S. (2016) Transportation Geotechnics, CRC Press, Roca Baton, USA.
Meakin, P. & Jullien, R. (1992), RSA of disks of different sizes, Physical Review A, 46(4), 2029–2038.
Metropolis, N. & Ulam, S. (1949), The Monte Carlo Method, Journal of the American Statistical Association,
44(247), 335–341.
Olhoeft, G. R. & Selig, E. T. (2002), Ground penetrating radar evaluation of railroad track substructure conditions, in Proceedings of the 9th International Conference on Ground Penetrating Radar (GPR 2002), Santa Barbara, USA, April 29–May2.
Peng, F., Kang, S, Li X., Ouyang, Y., Somani, K. & Acharya, D. (2011), A euristic approach to the railroad track maintenance scheduling problem, Computer-Aided Civil and Infrastructure Engineering, 26(2), 129–145.
Pirrone, D. & Pajewski, L. (2015), E2GPR – Edit your geometry, Execute GprMax2D and Plot the Results!, in Proceedings of the 15th Mediterranean Microwave Symposium, Lecce, Italy, Nov 30–Dec 2.
Pyrgidis, C. N. (2016), Railway Transportation Systems: Design, Construction and Operation, CRC Press, Boca Raton, USA.
Rényi, A. (1958), On a one-dimensional problem concerning random space-filling, Publication of the Mathematical Institute of the Hungarian Academy of Sciences, 3, 109–127.
Roberts, R., Al-Qadi, I., Tutumluer, E., Boyle, J. & Sussmann, T. R. (2006). Advances in railroad ballast evaluation using 2 GHz horn antennas, in Proceedings of the 11th International Conference on Ground Penetrating
Radar, Columbus, OH., USA, 2006.
Roberts, R., Rudy, J., Al-Qadi, I. L., Tutumluer, E. & Boyle J. (2006), Railroad ballast fouling detection using Ground Penetrating Radar – A new approach based on scattering from voids, ECNDT 2006 - Th.4.5.1, 1–8.
Roberts, R., Schutz, A., Al-Qadi, I. L. & Tutumluer, E. (2007), Characterizing railroad ballast using GPR: recent experiences in the United States, in Proceedings of the 4th International Workshop on Advanced Ground Penetrating Radar (IWAGPR 2007), Naples, Italy, Jun 27-29.
Roman, E. & Majilis, N. (1983), Computer simulation model of the structure of ion implanted impurities in semiconductors, Solid State Communications, 47(4), 259–
261.
Romàn, F. L., White, J. A. & Velasco, S. (1996), Probability distribution function for the random sequential adsorption of hard disks onto a surface, Physica A, 233,
283–292.
Scullion, T., Lau, C. L. & Chen, Y. (1994), Implementation of the Texas ground penetrating radar system, Texas Transportation Institute, The Texas A&M University System, Texas, USA.
Talbot, J., Tarjus, G., Van Tassel, P. R. & Viot, P. (2000), From car parking to protein adsorption: an overview of sequential adsorption processes. Colloids and Surfaces A: Physicochemical and Engineering Aspects,
165(1), 287–324.
Talbot, J. & Schaaf, P. (1989), Random sequential adsorption of mixtures, Physical Review A, 40(1), 422.
The Finite-Difference Time-Domain Method, Artech House.
Thakur, P. K., Indraratna, B. & Vinod, J. S. (2009), DEM simulation of effect of confining pressure on ballast behaviour, in Proceedings of the 17th International Conference on Soil Mechanics and Geotechnical Engineering, Amsterdam, Netherlands, pp. 602–605.
Tosti, F., Bianchini Ciampoli, L., Calvi, A., Alani, A. M. & Benedetto, A. (2018). An investigation into the railway ballast dielectric properties using different GPR antennas and frequency systems, NDT & E International,
93, 131–140.
Tzanakakis, K. (2013), The railway track and its long term behaviour, Springer, Berlin, Germany.
Umiliaco, A. & Benedetto, A. (2012), Unsteady flow simulation of water drainage in open-graded asphalt mixtures, in Procedia – Social and Behaviour Sciences,
53, 346–355.
Umiliaco, A., Benedetto, A. & D’Amico F. (2012), Prediction of drainage capability of open graded mixture A state of the art and novel perspectives, Recent Advances in Engineering, 228–233.
Van Tassel, P. R., Viot, P., Tarjus, G. & Talbot, J. (1994), Irreversible adsorption of macromolecules at a liquid-solid interface: Theoretical studies of the effects of conformational change, The Journal of Chemical Physics,
101(8).
Viot, P., Tarjus, G., Ricci, S. M. & Talbot J. (1992), Random sequential adsorption of anisotropic particles. I. Jamming limit and asymptotic behaviour, The Journal of Chemical Physics, 97(7), 5219–5228.
Wu, R., Li, J. & Liu, Z. S. (1999), Super resolution time delay estimation via MODEWRELAX, IEEE Transactions on Aerospace and Electronic Systems, 35(1),
294–307.
Yee, K. S. (1966), Numerical solution of initial boundary value problems involving Maxwell’s equations in isotropic media, IEEE Transaction on Antennas and Propagation, 14, 302–307.
Zhuang, X., Wang, Q., & Zhu, H. (2017), Effective properties of composites with periodic random packing of ellipsoids, Materials, 10(2), 112.